



GREEN BAY
PACKERSGB
4-3 | Road
17


DETROIT
LIONSDET
4-2 | Home
20
Key Game

KEY GAME
Daniel Whelan
#19 | Punter@
KEY GAME
Jack Fox
#3 | Punter| Player | |
|---|---|
| Daniel Whelan | None-None |
| Jack Fox | None-None |
None-None
W-L
None-None
AI Model Win Probability
PACKERS
44%
LIONS
56%
▲ Edge: +8.20% (GB)
PACKERS
36%
Book Odds: +181
LIONS
67%
Book Odds: -204
AI Model Projected Total
AI Projection
50.4
Projected
Book Total
55.5
Over / Under Line
▼
Edge: +5.1 (Under)
Over 55.5
35%
Under 55.5
65%
AI Model Spread Expectation
AI Spread Proj
+2.0
GREEN BAY
Book Spread
+3.5
Book Line
▲ Edge: +1.5 points (Green Bay)
Spread Distribution
AI Model
+42+28+140-14-28-42
Distribution centered around GB +2.0 expected margin.
Margin of Victory (GB)
GB By 1-6 points
15.7%
GB By 7-13 points
13.8%
DET By 1-6 points
16.9%
DET By 7-13 points
16.8%
AI Model Projected Score
Green Bay
24.2
GREEN BAY
Book Implied: 26
Detroit
26.2
DETROIT
Book Implied: 29.50
Simulated Score
Green Bay
24
GREEN BAY
Book Implied: 26
Detroit
27
DETROIT
Book Implied: 29.50
Projections Grades
Moneyline (ML)
Agreement
AI
Lions
Win
56% Win Prob
D
Sim
Lions
Win
61% Win Prob
C
Point Spread (ATS)
Agreement
AI
Packers (+3.5)
Win
Proj Spread: +2.0
D
Sim
Packers (+3.5)
Win
Proj Spread: +3.0
D
Over/Under (Total)
Agreement
👑 Top Selection
AI
u55.5
Win
Proj Total: 50.4
B
Sim
u55.5
Win
Proj Total: 51.0
A
Head-to-Head History
Date
Game
Score
Oct 25, 2026
GB @ DET
17 - 20
Nov 27, 2025
GB @ DET
31 - 24
Sep 7, 2025
DET @ GB
13 - 27
Dec 5, 2024
GB @ DET
31 - 34
Nov 3, 2024
DET @ GB
24 - 14
Key Model Drivers
Rushing Yards (L5)
+71.3% more
Detroit: 113.4
vs
Green Bay: 66.2
First Downs (L5)
+31.2% more
Detroit: 23.8
vs
Green Bay: 18.2
Total Yards (L5)
+19.8% more
Detroit: 401.9
vs
Green Bay: 335.6
Yards Per Play (L5)
+12.4% more
Detroit: 6.1
vs
Green Bay: 5.4
Post-Mortem Analysis
Metric
Projected
Actual
Score Game
GB Score
24.2
17
DET Score
26.2
20
Team Stats Splits (Home / Away)
First Downs
23.8 / 18.2
26.0 / 17.0
Net Passing Yards
288.5 / 269.4
296.0 / 264.0
Rushing Yards
113.4 / 66.2
119.0 / 60.0
Third Down Efficiency
0.4 / 0.4
0.5 / 0.33
Time of Possession
0.5 / 0.5
0.5 / 0.5
Total Yards
401.9 / 335.6
415.0 / 324.0
Turnovers
0.3 / 0.9
2.0 / 1.0
Yards Per Play
6.1 / 5.4
6.3 / 5.0
Public Market Splits
Moneyline
Open: +120 / -142
→
+181 / -204
↑
Spread (ATS)
Open: +2.5 / -2.5
→
+3.5 / -3.5
↑
Total (O/U)
Open: 50.5
→
55.5
↑
Situational Trends
📊 Win-Loss
GB
6-4-0
(60.0%)
Margin: 0.5
ATS +/-: +0.1
DET
Advantage
7-2-0
(77.8%)
Margin: 6.4
ATS +/-: +2.7
🎯 ATS (Spread)
GB
Advantage
6-4-0
(60.0%)
Margin: 0.5
ATS +/-: +0.1
DET
4-4-1
(50.0%)
Margin: 6.4
ATS +/-: +2.7
⚖️ Over/Under
GB
3-7-0
O: 30.0% / U: 70.0%
Total +/-: -1.5
DET
5-4-0
O: 55.6% / U: 44.4%
Total +/-: -0.8
Season to Date Model Accuracy
AI Model
SIM Engine
DET
GB
DET
GB
ML
89%
8-1
60%
6-4
67%
6-3
50%
5-5
ATS
50%
4-4-1
44%
4-5-1
75%
6-2-1
44%
4-5-1
TTL
44%
4-5
40%
4-6
44%
4-5
60%
6-4
Contextual Game News

Vikings' Brian Flores Raves About Kirk Cousins' Impact Ahead of …

Lions' Super Bowl Hopes Dealt Major Blow by Aidan Hutchinson Inj…
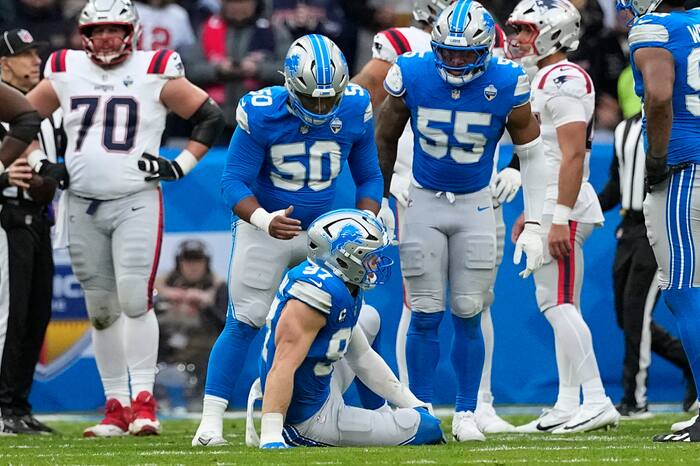
Aidan Hutchinson Sidelined for 2026 Season After ACL Tear

Dan Campbell Shuts Down Celebration Ban After Aidan Hutchinson's…

Dan Campbell Vows Lions Will Persevere Despite Aidan Hutchinson'…