



CINCINNATI
BENGALSCIN
4-2 | Road
35


BALTIMORE
RAVENSBAL
4-3 | Home
13
Key Game

KEY GAME
Ryan Rehkow
#8 | Punter@
KEY GAME
Ryan Eckley
#30 | Punter| Player | |
|---|---|
| Ryan Rehkow | None-None |
| Ryan Eckley | None-None |
None-None
W-L
None-None
AI Model Win Probability
BENGALS
39%
RAVENS
61%
▲ Edge: +18.60% (BAL)
BENGALS
62%
Book Odds: -162
RAVENS
42%
Book Odds: +136
AI Model Projected Total
AI Projection
48.0
Projected
Book Total
46.5
Over / Under Line
▲
Edge: +1.5 (Over)
Over 46.5
56%
Under 46.5
44%
AI Model Spread Expectation
AI Spread Proj
-3.0
BALTIMORE
Book Spread
+3
Book Line
▲ Edge: +6.0 points (Baltimore)
Spread Distribution
AI Model
+42+28+140-14-28-42
Distribution centered around BAL -3.0 expected margin.
Margin of Victory (BAL)
CIN By 1-6 points
15.3%
CIN By 7-13 points
12.9%
BAL By 1-6 points
17.0%
BAL By 7-13 points
17.5%
AI Model Projected Score
Cincinnati
22.5
CINCINNATI
Book Implied: 24.80
Baltimore
25.5
BALTIMORE
Book Implied: 21.80
Simulated Score
Cincinnati
27
CINCINNATI
Book Implied: 24.80
Baltimore
23
BALTIMORE
Book Implied: 21.80
Projections Grades
Moneyline (ML)
Divergence
AI
Ravens
Loss
61% Win Prob
C
Sim
Bengals
Win
66% Win Prob
B
Point Spread (ATS)
Divergence
AI
Ravens (+3)
Loss
Proj Spread: -3.0
A
Sim
Bengals (-3)
Win
Proj Spread: -4.0
C
Over/Under (Total)
Agreement
AI
o46.5
Win
Proj Total: 48.0
C
Sim
o46.5
Win
Proj Total: 50.0
A
Head-to-Head History
Date
Game
Score
Oct 25, 2026
CIN @ BAL
35 - 13
Dec 14, 2025
BAL @ CIN
24 - 0
Nov 27, 2025
CIN @ BAL
32 - 14
Nov 7, 2024
CIN @ BAL
34 - 35
Oct 6, 2024
BAL @ CIN
41 - 38
Key Model Drivers
Rushing Yards (L5)
+64.1% more
Baltimore: 143.4
vs
Cincinnati: 87.4
Turnovers (L5)
+41.1% more
Cincinnati: 1.3
vs
Baltimore: 0.8
Net Passing Yards (L5)
+27.6% more
Cincinnati: 263.2
vs
Baltimore: 190.5
First Downs (L5)
+15.2% more
Cincinnati: 22.0
vs
Baltimore: 18.6
Post-Mortem Analysis
Metric
Projected
Actual
Score Game
CIN Score
22.5
35
BAL Score
25.5
13
Team Stats Splits (Home / Away)
First Downs
18.6 / 22.0
17.0 / 21.0
Net Passing Yards
190.5 / 263.2
276.0 / 284.0
Rushing Yards
143.4 / 87.4
83.0 / 73.0
Third Down Efficiency
0.4 / 0.5
0.56 / 0.55
Time of Possession
0.5 / 0.5
0.58 / 0.42
Total Yards
333.9 / 350.6
359.0 / 357.0
Turnovers
0.8 / 1.3
1.0 / 0.0
Yards Per Play
5.5 / 5.5
5.5 / 7.0
Public Market Splits
Moneyline
Open: +150 / -180
→
-162 / +136
↓
Spread (ATS)
Open: +3.5 / -3.5
→
-3 / +3
↓
Total (O/U)
Open: 51.5
→
46.5
↓
Situational Trends
📊 Win-Loss
CIN
Advantage
7-2-0
(77.8%)
Margin: 9.4
ATS +/-: +5.1
BAL
4-6-0
(40.0%)
Margin: -5.0
ATS +/-: -6.6
🎯 ATS (Spread)
CIN
Advantage
5-4-0
(55.6%)
Margin: 9.4
ATS +/-: +5.1
BAL
2-8-0
(20.0%)
Margin: -5.0
ATS +/-: -6.6
⚖️ Over/Under
CIN
6-3-0
O: 66.7% / U: 33.3%
Total +/-: +4.5
BAL
6-4-0
O: 60.0% / U: 40.0%
Total +/-: +1.1
Season to Date Model Accuracy
AI Model
SIM Engine
BAL
CIN
BAL
CIN
ML
50%
5-5
67%
6-3
40%
4-6
67%
6-3
ATS
33%
3-6-1
25%
2-6-1
56%
5-4-1
88%
7-1-1
TTL
50%
5-5
44%
4-5
50%
5-5
78%
7-2
Contextual Game News

Kraft and Belichick Again Named Hall of Fame Finalists

Urban Meyer Shuts Down Maryland Coaching Rumors: 'No Truth' to S…

Belichick and Kraft Get Another Shot at Hall of Fame in 2027
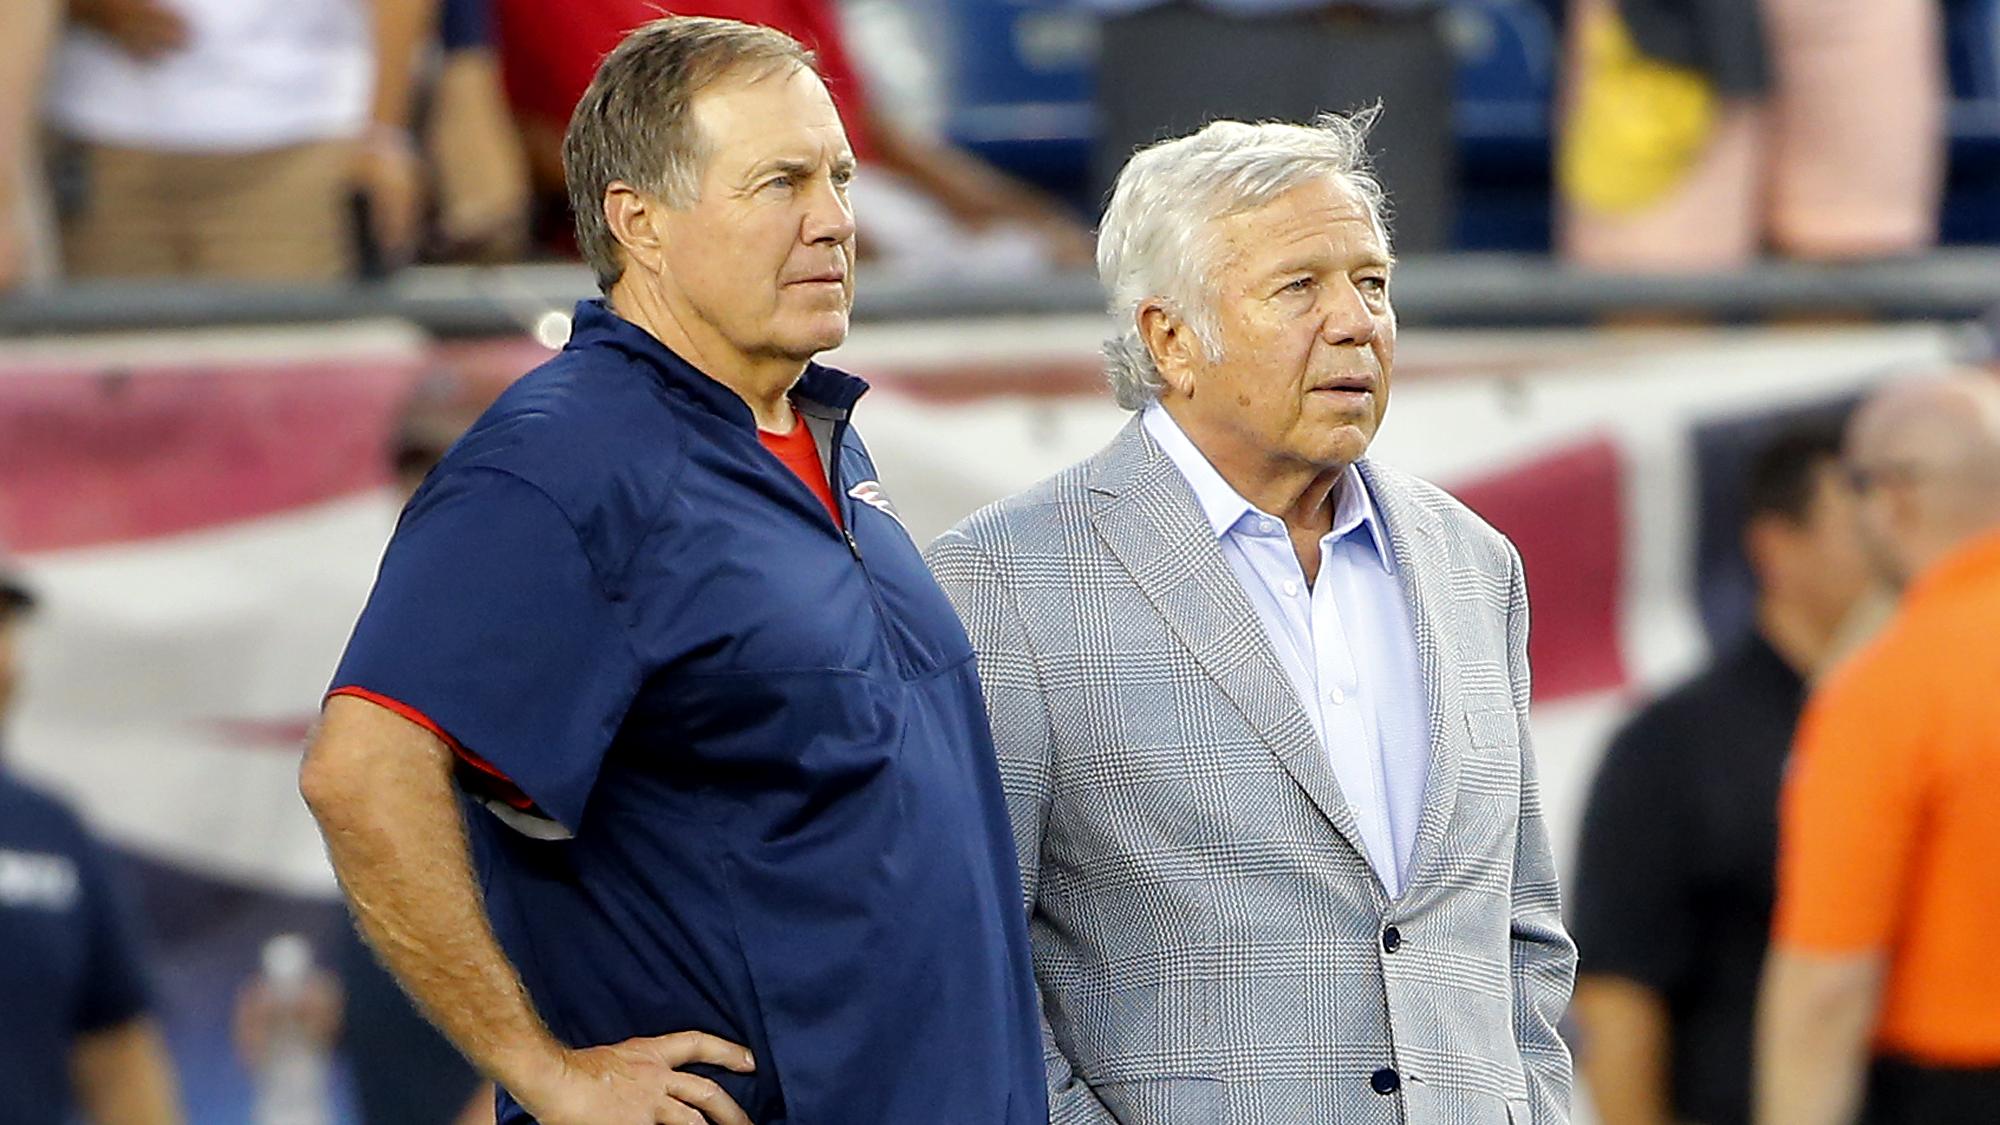
Belichick and Kraft Move One Step Closer to Pro Football Hall of…

Colts vs. Texans: Thursday Night Football Showdown with Second P…