



NEW ENGLAND
PATRIOTSNE
4-3 | Road
24


CHICAGO
BEARSCHI
5-2 | Home
30
Key Game

KEY GAME
Mitch Wishnowsky
#19 | Punter@

KEY GAME
Tory Taylor
#19 | Punter| Player | |
|---|---|
| Mitch Wishnowsky | None-None |
| Tory Taylor | None-None |
None-None
W-L
None-None
AI Model Win Probability
PATRIOTS
46%
BEARS
54%
▲ Edge: +4.10% (NE)
PATRIOTS
42%
Book Odds: +138
BEARS
61%
Book Odds: -154
AI Model Projected Total
AI Projection
41.5
Projected
Book Total
50.5
Over / Under Line
▼
Edge: +9.0 (Under)
Over 50.5
24%
Under 50.5
76%
AI Model Spread Expectation
AI Spread Proj
+2.5
NEW ENGLAND
Book Spread
+3
Book Line
▲ Edge: +0.5 points (New England)
Spread Distribution
AI Model
+42+28+140-14-28-42
Distribution centered around NE +2.5 expected margin.
Margin of Victory (NE)
NE By 1-6 points
15.5%
NE By 7-13 points
13.4%
CHI By 1-6 points
16.9%
CHI By 7-13 points
17.2%
AI Model Projected Score
New England
19.5
NEW ENGLAND
Book Implied: 23.80
Chicago
22
CHICAGO
Book Implied: 26.80
Simulated Score
New England
23
NEW ENGLAND
Book Implied: 23.80
Chicago
25
CHICAGO
Book Implied: 26.80
Projections Grades
Moneyline (ML)
Agreement
AI
Bears
Win
54% Win Prob
D
Sim
Bears
Win
57% Win Prob
D
Point Spread (ATS)
Agreement
AI
Patriots (+3)
Loss
Proj Spread: +2.5
D
Sim
Patriots (+3)
Loss
Proj Spread: +2.0
C
Over/Under (Total)
Agreement
👑 Top Selection
AI
u50.5
Loss
Proj Total: 41.5
A
Sim
u50.5
Loss
Proj Total: 48.0
B
Head-to-Head History
Date
Game
Score
Oct 22, 2026
NE @ CHI
24 - 30
Nov 10, 2024
NE @ CHI
19 - 3
Oct 24, 2022
CHI @ NE
33 - 14
Oct 21, 2018
NE @ CHI
38 - 31
Oct 26, 2014
CHI @ NE
23 - 51
Key Model Drivers
Time of Possession (L5)
+9.0% more
Chicago: 0.6
vs
New England: 0.5
Yards Per Play (L5)
+19.1% more
New England: 6.1
vs
Chicago: 5.0
Net Passing Yards (L5)
+10.6% more
New England: 260.6
vs
Chicago: 233.0
Total Yards (L5)
+9.4% more
New England: 402.3
vs
Chicago: 364.6
Post-Mortem Analysis
Metric
Projected
Actual
Score Game
NE Score
19.5
24
CHI Score
22.0
30
Team Stats Splits (Home / Away)
First Downs
21.9 / 22.8
21.0 / 20.0
Net Passing Yards
233.0 / 260.6
289.0 / 310.0
Rushing Yards
131.7 / 141.7
116.0 / 70.0
Third Down Efficiency
0.4 / 0.5
0.33 / 0.29
Time of Possession
0.6 / 0.5
0.54 / 0.46
Total Yards
364.6 / 402.3
405.0 / 380.0
Turnovers
2.0 / 1.9
0.0 / 1.0
Yards Per Play
5.0 / 6.1
6.1 / 7.6
Public Market Splits
Moneyline
Open: +105 / -125
→
+138 / -154
↑
Spread (ATS)
Open: +1.5 / -1.5
→
+3 / -3
↑
Total (O/U)
Open: 47.5
→
50.5
↑
Situational Trends
📊 Win-Loss
NE
4-3-0
(57.1%)
Margin: 2.4
ATS +/-: +2.5
CHI
Advantage
5-2-0
(71.4%)
Margin: 5.3
ATS +/-: +3.4
🎯 ATS (Spread)
NE
3-3-1
(50.0%)
Margin: 2.4
ATS +/-: +2.5
CHI
Advantage
5-2-0
(71.4%)
Margin: 5.3
ATS +/-: +3.4
⚖️ Over/Under
NE
4-3-0
O: 57.1% / U: 42.9%
Total +/-: -2.9
CHI
3-4-0
O: 42.9% / U: 57.1%
Total +/-: -0.6
Season to Date Model Accuracy
AI Model
SIM Engine
CHI
NE
CHI
NE
ML
86%
6-1
86%
6-1
86%
6-1
86%
6-1
ATS
71%
5-2
33%
2-4-1
86%
6-1
33%
2-4-1
TTL
0%
0-7
14%
1-6
14%
1-6
29%
2-5
Contextual Game News
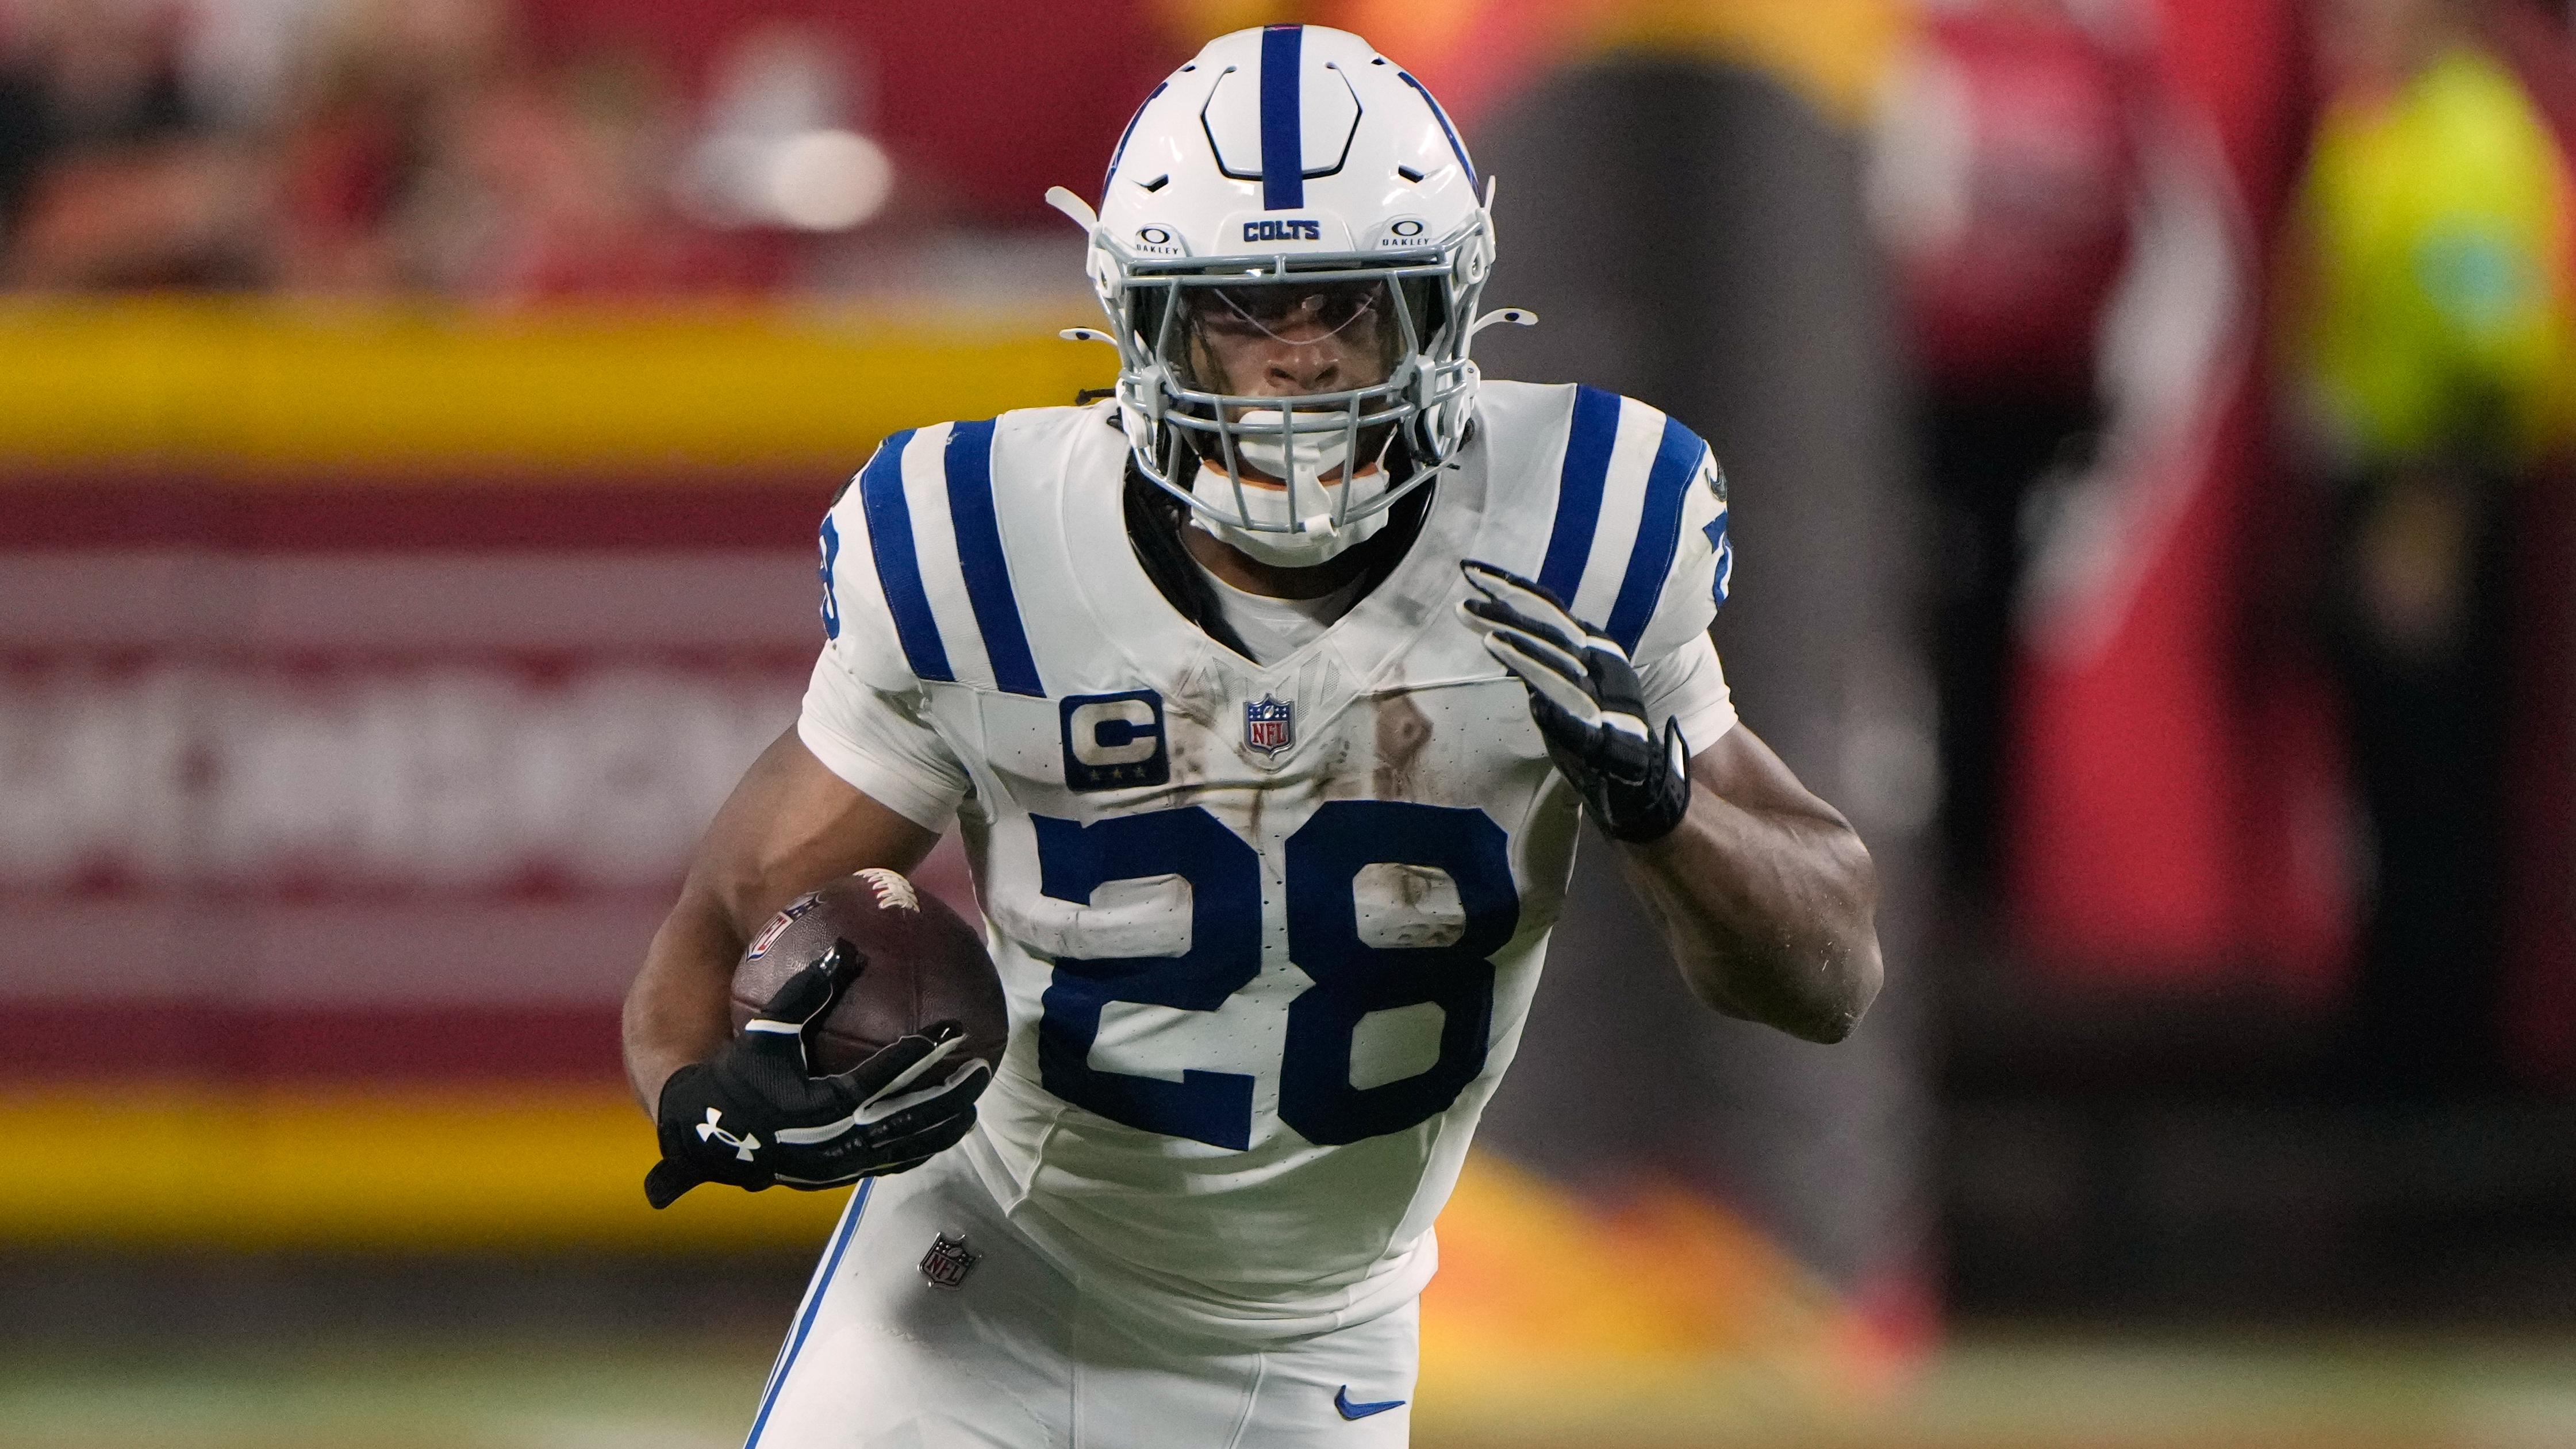
Jonathan Taylor Addresses Trade Request Rumors as Colts Overhaul…

Brewers End 58-Year Wait for First World Series Title, Leaving F…

Garrett Wilson Shuts Down Trade Speculation, Commits to Jets

Washington's QB Dilemma and Run Game Revival: A Nebraska Preview…

Patriots vs. Dolphins: Position-by-Position Breakdown Reveals Cl…