


VANDERBILT
VANDERBILTVAN
3-5 | Road
17

KENTUCKY
KENTUCKYUK
7-1 | Home
34
Key Game

KEY GAME
Tyler Ebel
#37 | Punter@

KEY GAME
Wilson Berry
#93 | Punter| Player | |
|---|---|
| Tyler Ebel | None-None |
| Wilson Berry | None-None |
None-None
W-L
None-None
AI Model Win Probability
VANDERBILT
37%
KENTUCKY
63%
▲ Edge: +14.30% (VAN)
VANDERBILT
23%
Book Odds: +340
KENTUCKY
82%
Book Odds: -441
AI Model Projected Total
AI Projection
54.5
Projected
Book Total
51.5
Over / Under Line
▲
Edge: +3.0 (Over)
Over 51.5
56%
Under 51.5
44%
AI Model Spread Expectation
AI Spread Proj
+5.5
VANDERBILT
Book Spread
+10.5
Book Line
▲ Edge: +5.0 points (Vanderbilt)
Spread Distribution
AI Model
+42+28+140-14-28-42
Distribution centered around VAN +5.5 expected margin.
Margin of Victory (VAN)
VAN By 1-6 points
13.8%
VAN By 7-13 points
10.8%
UK By 1-6 points
16.8%
UK By 7-13 points
18.8%
AI Model Projected Score
Vanderbilt
24.5
VANDERBILT
Book Implied: 20.50
Kentucky
30
KENTUCKY
Book Implied: 31
Simulated Score
Vanderbilt
24
VANDERBILT
Book Implied: 20.50
Kentucky
36
KENTUCKY
Book Implied: 31
Projections Grades
Moneyline (ML)
Agreement
👑 Top Selection
AI
Kentucky
Win
63% Win Prob
B
Sim
Kentucky
Win
88% Win Prob
A
Point Spread (ATS)
Divergence
AI
Vanderbilt (+10.5)
Loss
Proj Spread: +5.5
B
Sim
Kentucky (-10.5)
Win
Proj Spread: -12.0
C
Over/Under (Total)
Agreement
AI
o51.5
Loss
Proj Total: 54.5
C
Sim
o51.5
Loss
Proj Total: 60.0
A
Head-to-Head History
Date
Game
Score
Oct 24, 2026
VAN @ UK
17 - 34
Nov 22, 2025
UK @ VAN
17 - 45
Oct 12, 2024
VAN @ UK
20 - 13
Sep 23, 2023
UK @ VAN
45 - 28
Nov 12, 2022
VAN @ UK
24 - 21
Key Model Drivers
Rushing Yards (L5)
+21.9% more
Kentucky: 139.7
vs
Vanderbilt: 114.6
Turnovers (L5)
+78.5% more
Vanderbilt: 2.1
vs
Kentucky: 0.5
Third Down Efficiency (L5)
+10.0% more
Vanderbilt: 0.4
vs
Kentucky: 0.3
Post-Mortem Analysis
Metric
Projected
Actual
Score Game
VAN Score
24.5
17
UK Score
30.0
34
Team Stats Splits (Home / Away)
First Downs
18.7 / 19.1
24.0 / 15.0
Rushing Yards
139.7 / 114.6
173.0 / 15.0
Third Down Efficiency
0.3 / 0.4
0.62 / 0.58
Time of Possession
0.5 / 0.5
0.52 / 0.48
Total Yards
348.1 / 363.3
376.0 / 262.0
Turnovers
0.5 / 2.1
0.0 / 2.0
Public Market Splits
Moneyline
Open: +310 / -395
→
+340 / -441
↑
Spread (ATS)
Open: +9.5 / -9.5
→
+10.5 / -10.5
↑
Total (O/U)
Open: 52.5
→
51.5
↓
Situational Trends
📊 Win-Loss
VAN
3-5-0
(37.5%)
Margin: -7.5
ATS +/-: -7.9
UK
Advantage
7-1-0
(87.5%)
Margin: 8.1
ATS +/-: +7.1
🎯 ATS (Spread)
VAN
3-5-0
(37.5%)
Margin: -7.5
ATS +/-: -7.9
UK
Advantage
7-1-0
(87.5%)
Margin: 8.1
ATS +/-: +7.1
⚖️ Over/Under
VAN
5-3-0
O: 62.5% / U: 37.5%
Total +/-: +0.3
UK
5-3-0
O: 62.5% / U: 37.5%
Total +/-: +6.3
Season to Date Model Accuracy
AI Model
SIM Engine
UK
VAN
UK
VAN
ML
50%
4-4
75%
6-2
50%
4-4
62%
5-3
ATS
25%
2-6
50%
4-4
38%
3-5
88%
7-1
TTL
50%
4-4
75%
6-2
62%
5-3
75%
6-2
Contextual Game News

Georgia Takes Top Spot in Latest College Football Playoff Projec…
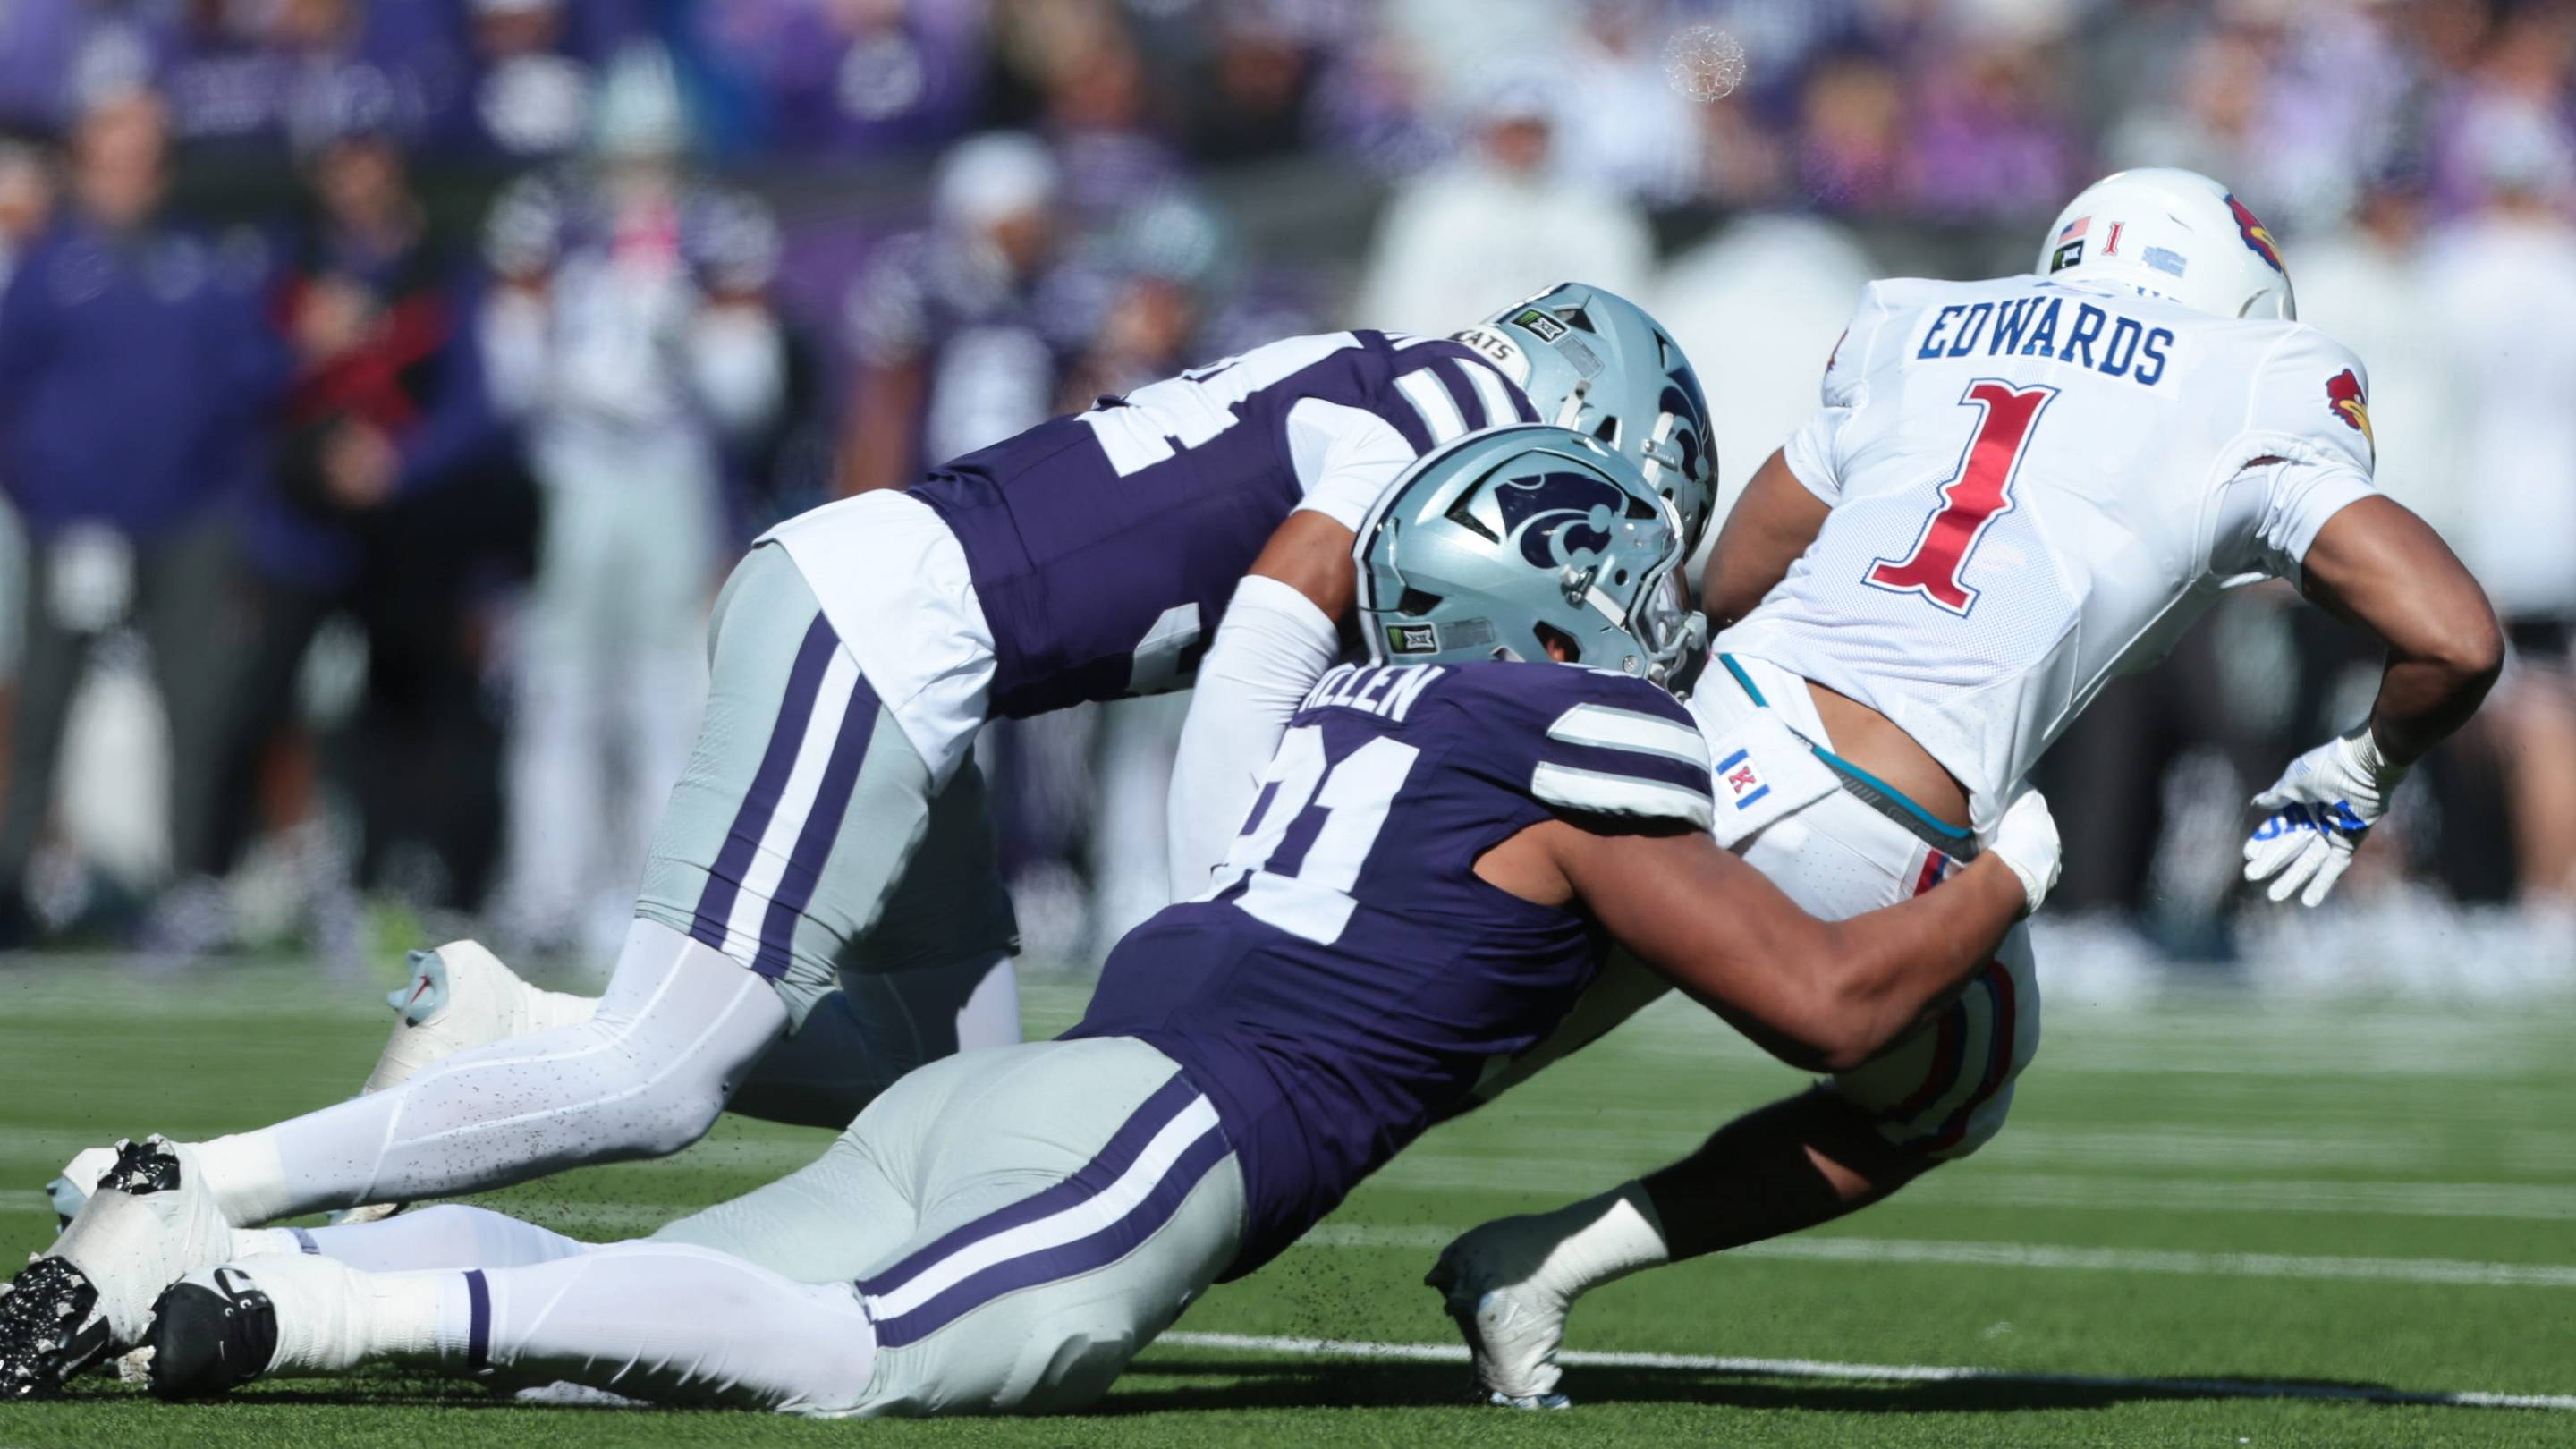
K-State Defense Braces for High-Octane Oklahoma State Attack

Luke Bryan's Emotional Reaction to Son Bo's Georgia Commitment
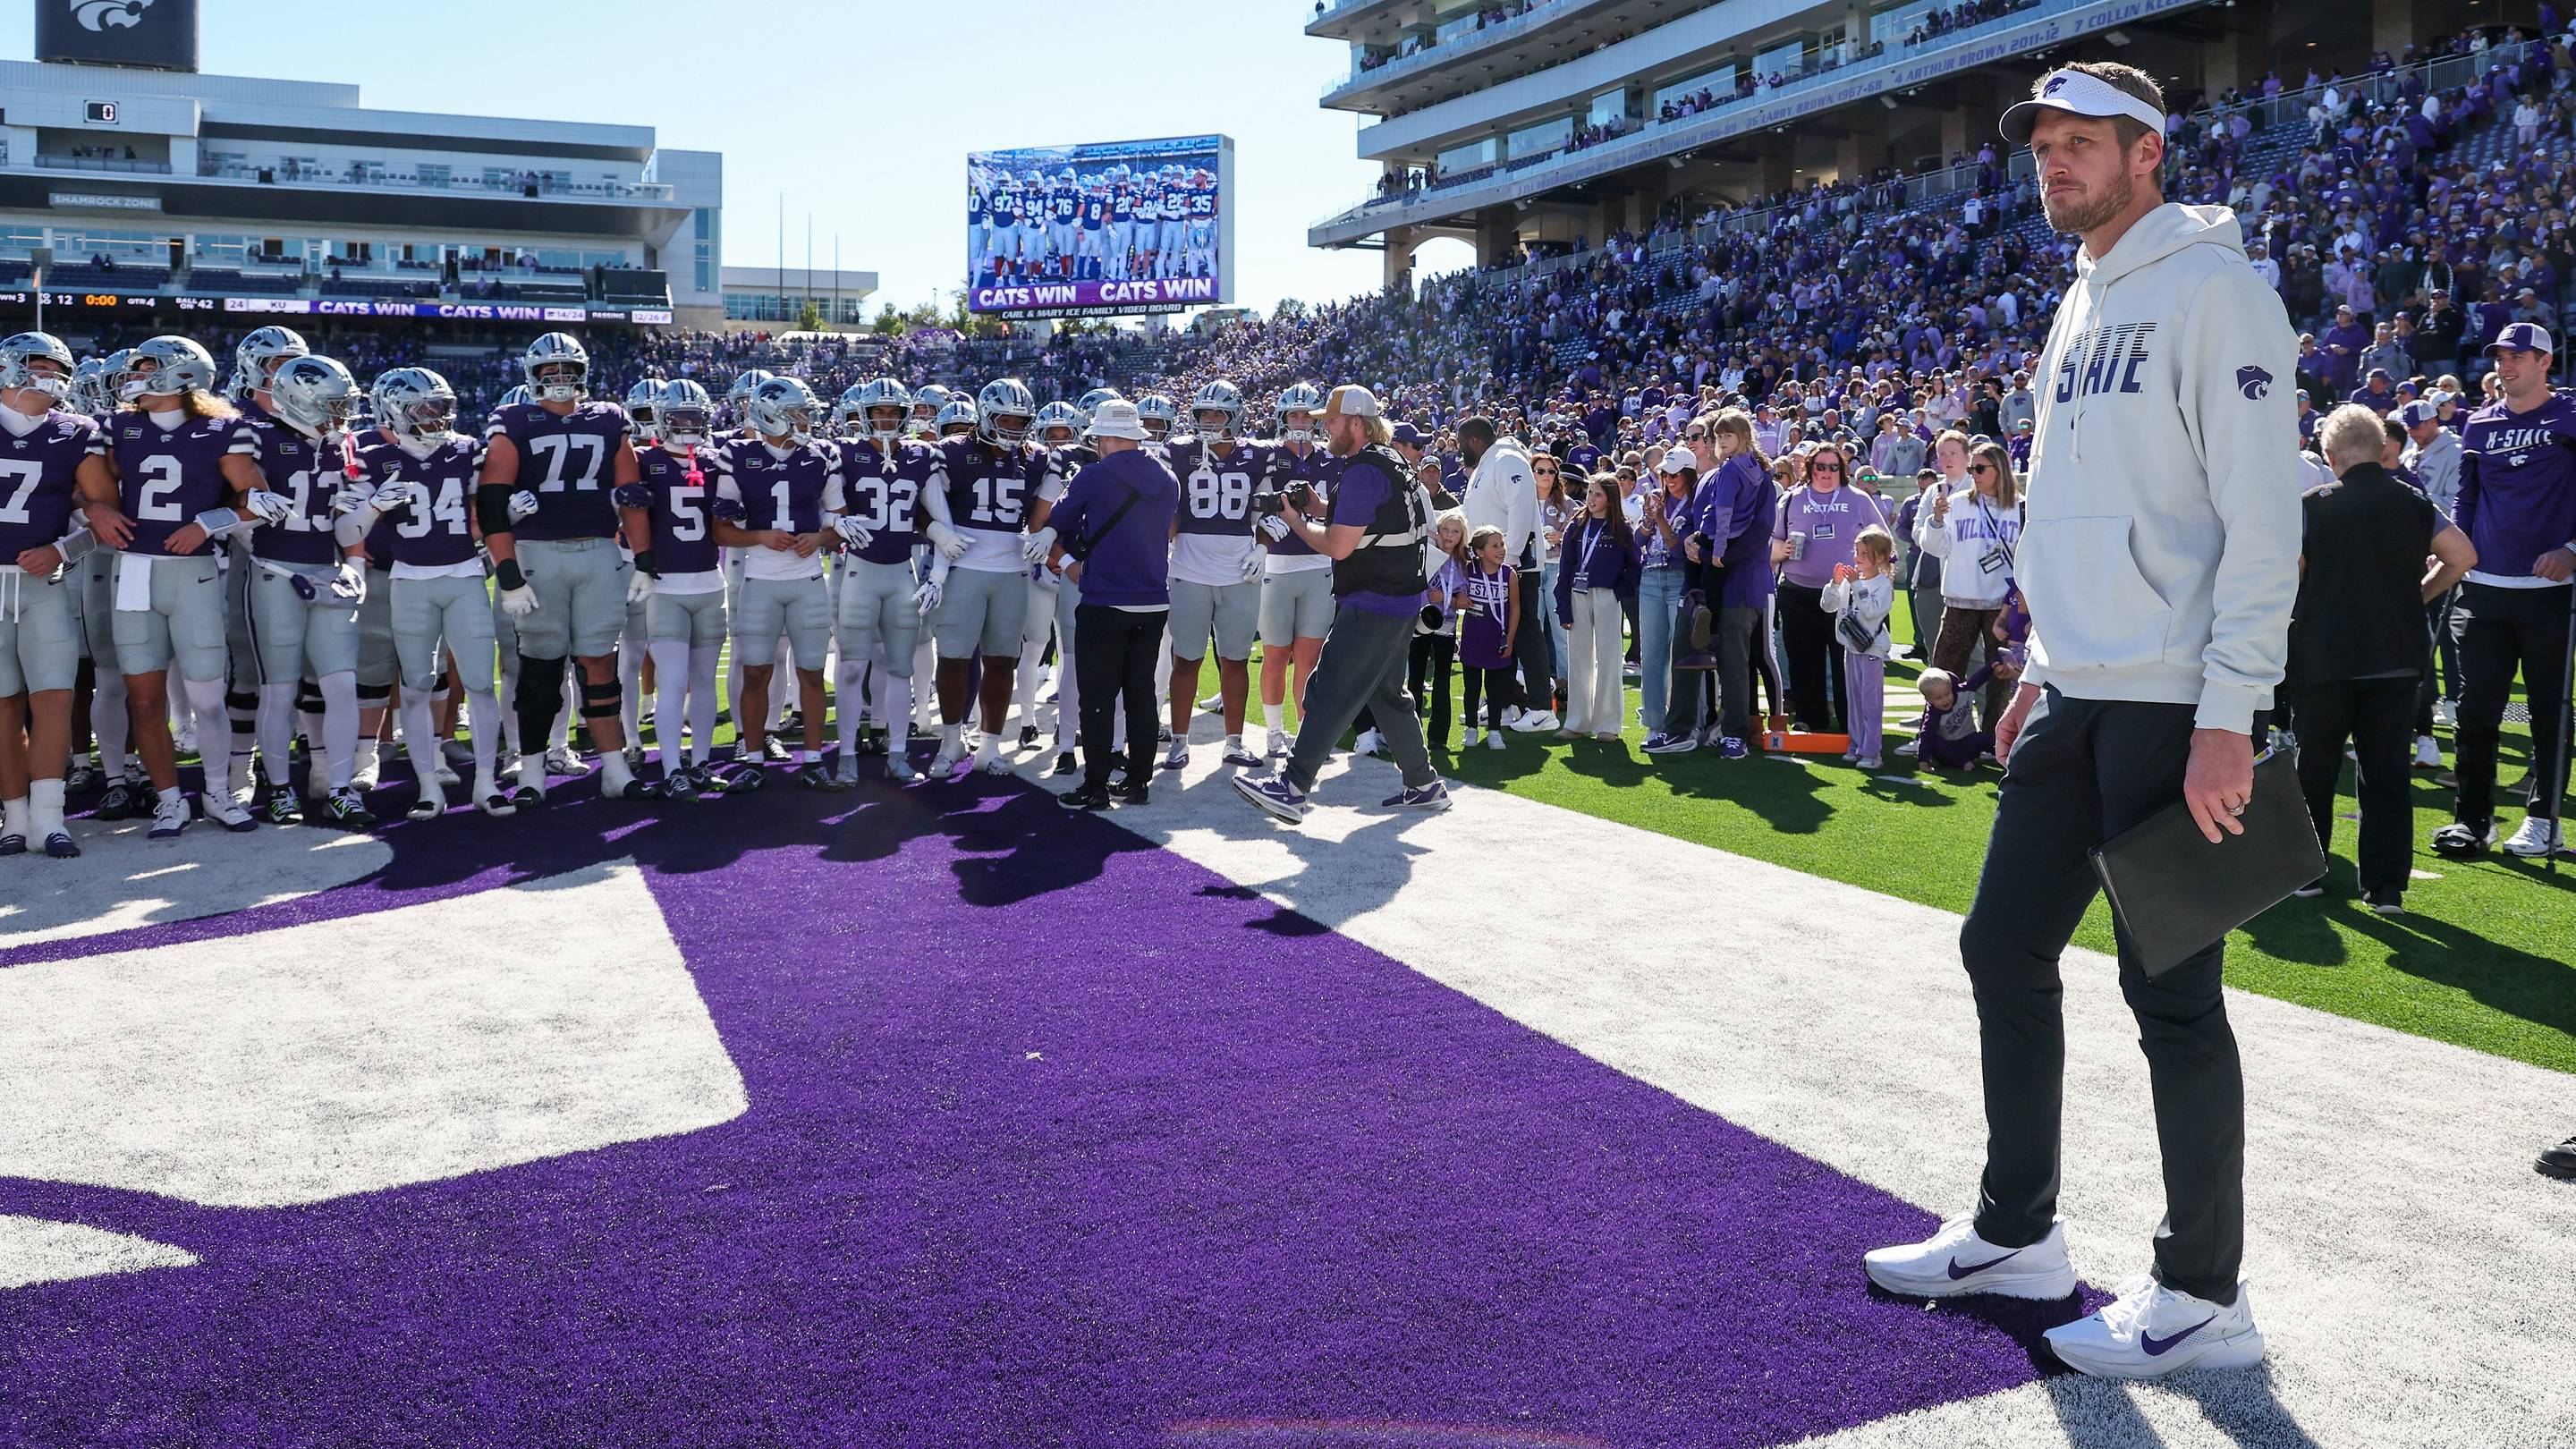
Collin Klein's First Season at K-State: Four Games Left to Flip …
Husker Fallout: Analysts Break Down Washington Loss, Offensive S…