


OREGON
OREGONORE
4-3 | Road
10

ILLINOIS
ILLINOISILL
4-3 | Home
21
Key Game

KEY GAME
Bailey Ettridge
#39 | Punter@
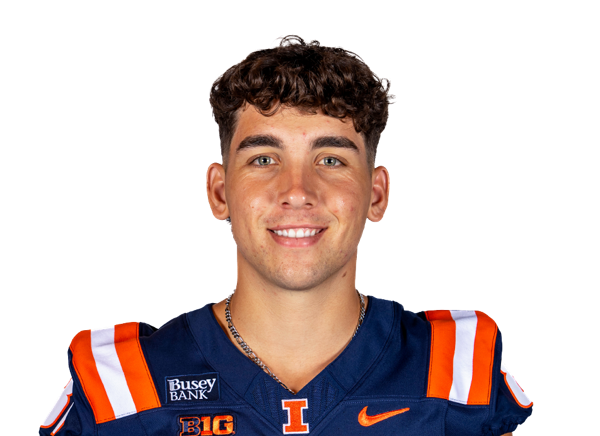
KEY GAME
Lars Rau
#81 | Punter| Player | |
|---|---|
| Bailey Ettridge | None-None |
| Lars Rau | None-None |
None-None
W-L
None-None
AI Model Win Probability
OREGON
78%
ILLINOIS
22%
OREGON
80%
Book Odds: -398
ILLINOIS
23%
Book Odds: +332
AI Model Projected Total
AI Projection
55.4
Projected
Book Total
49.5
Over / Under Line
▲
Edge: +5.9 (Over)
Over 49.5
66%
Under 49.5
34%
AI Model Spread Expectation
AI Spread Proj
-13.0
OREGON
Book Spread
-10
Book Line
▲ Edge: +3.0 points (Oregon)
Spread Distribution
AI Model
-42-28-140+14+28+42
Distribution centered around ORE -13.0 expected margin.
Margin of Victory (ORE)
ORE By 1-6 points
13.5%
ORE By 7-13 points
19.3%
ILL By 1-6 points
8.6%
ILL By 7-13 points
5.3%
AI Model Projected Score
Oregon
34.2
OREGON
Book Implied: 29.80
Illinois
21.2
ILLINOIS
Book Implied: 19.80
Simulated Score
Oregon
34
OREGON
Book Implied: 29.80
Illinois
28
ILLINOIS
Book Implied: 19.80
Projections Grades
Moneyline (ML)
Agreement
👑 Top Selection
AI
Oregon
Loss
78% Win Prob
A
Sim
Oregon
Loss
72% Win Prob
A
Point Spread (ATS)
Divergence
AI
Oregon (-10)
Loss
Proj Spread: -13.0
C
Sim
Illinois (+10)
Win
Proj Spread: +6.0
B
Over/Under (Total)
Agreement
👑 Top Selection
AI
o49.5
Loss
Proj Total: 55.4
A
Sim
o49.5
Loss
Proj Total: 62.0
A
Head-to-Head History
Date
Game
Score
Oct 24, 2026
ORE @ ILL
10 - 21
Oct 26, 2024
ILL @ ORE
9 - 38
Key Model Drivers
Turnovers (L5)
+69.0% more
Oregon: 2.5
vs
Illinois: 0.8
First Downs (L5)
+27.3% more
Illinois: 23.8
vs
Oregon: 18.7
Third Down Efficiency (L5)
+14.0% more
Illinois: 0.5
vs
Oregon: 0.3
Rushing Yards (L5)
+9.1% more
Illinois: 143.4
vs
Oregon: 131.5
Post-Mortem Analysis
Metric
Projected
Actual
Score Game
ORE Score
34.2
10
ILL Score
21.2
21
Team Stats Splits (Home / Away)
First Downs
23.8 / 18.7
15.0 / 21.0
Rushing Yards
143.4 / 131.5
225.0 / 180.0
Third Down Efficiency
0.5 / 0.3
0.5 / 0.27
Time of Possession
0.5 / 0.5
0.51 / 0.49
Total Yards
400.3 / 368.7
314.0 / 426.0
Turnovers
0.8 / 2.5
1.0 / 1.0
Public Market Splits
Moneyline
Open: -425 / +330
→
-398 / +332
Spread (ATS)
Open: -12.5 / +12.5
→
-10 / +10
↑
Total (O/U)
Open: 51.5
→
49.5
↓
Situational Trends
📊 Win-Loss
ORE
5-3-0
(62.5%)
Margin: 11.9
ATS +/-: -7.4
ILL
5-3-0
(62.5%)
Margin: 4.8
ATS +/-: +0.4
🎯 ATS (Spread)
ORE
3-5-0
(37.5%)
Margin: 11.9
ATS +/-: -7.4
ILL
Advantage
4-4-0
(50.0%)
Margin: 4.8
ATS +/-: +0.4
⚖️ Over/Under
ORE
5-3-0
O: 62.5% / U: 37.5%
Total +/-: -1.3
ILL
5-3-0
O: 62.5% / U: 37.5%
Total +/-: -0.4
Season to Date Model Accuracy
AI Model
SIM Engine
ILL
ORE
ILL
ORE
ML
62%
5-3
62%
5-3
62%
5-3
50%
4-4
ATS
29%
2-5-1
25%
2-6
86%
6-1-1
50%
4-4
TTL
75%
6-2
25%
2-6
62%
5-3
50%
4-4
Contextual Game News
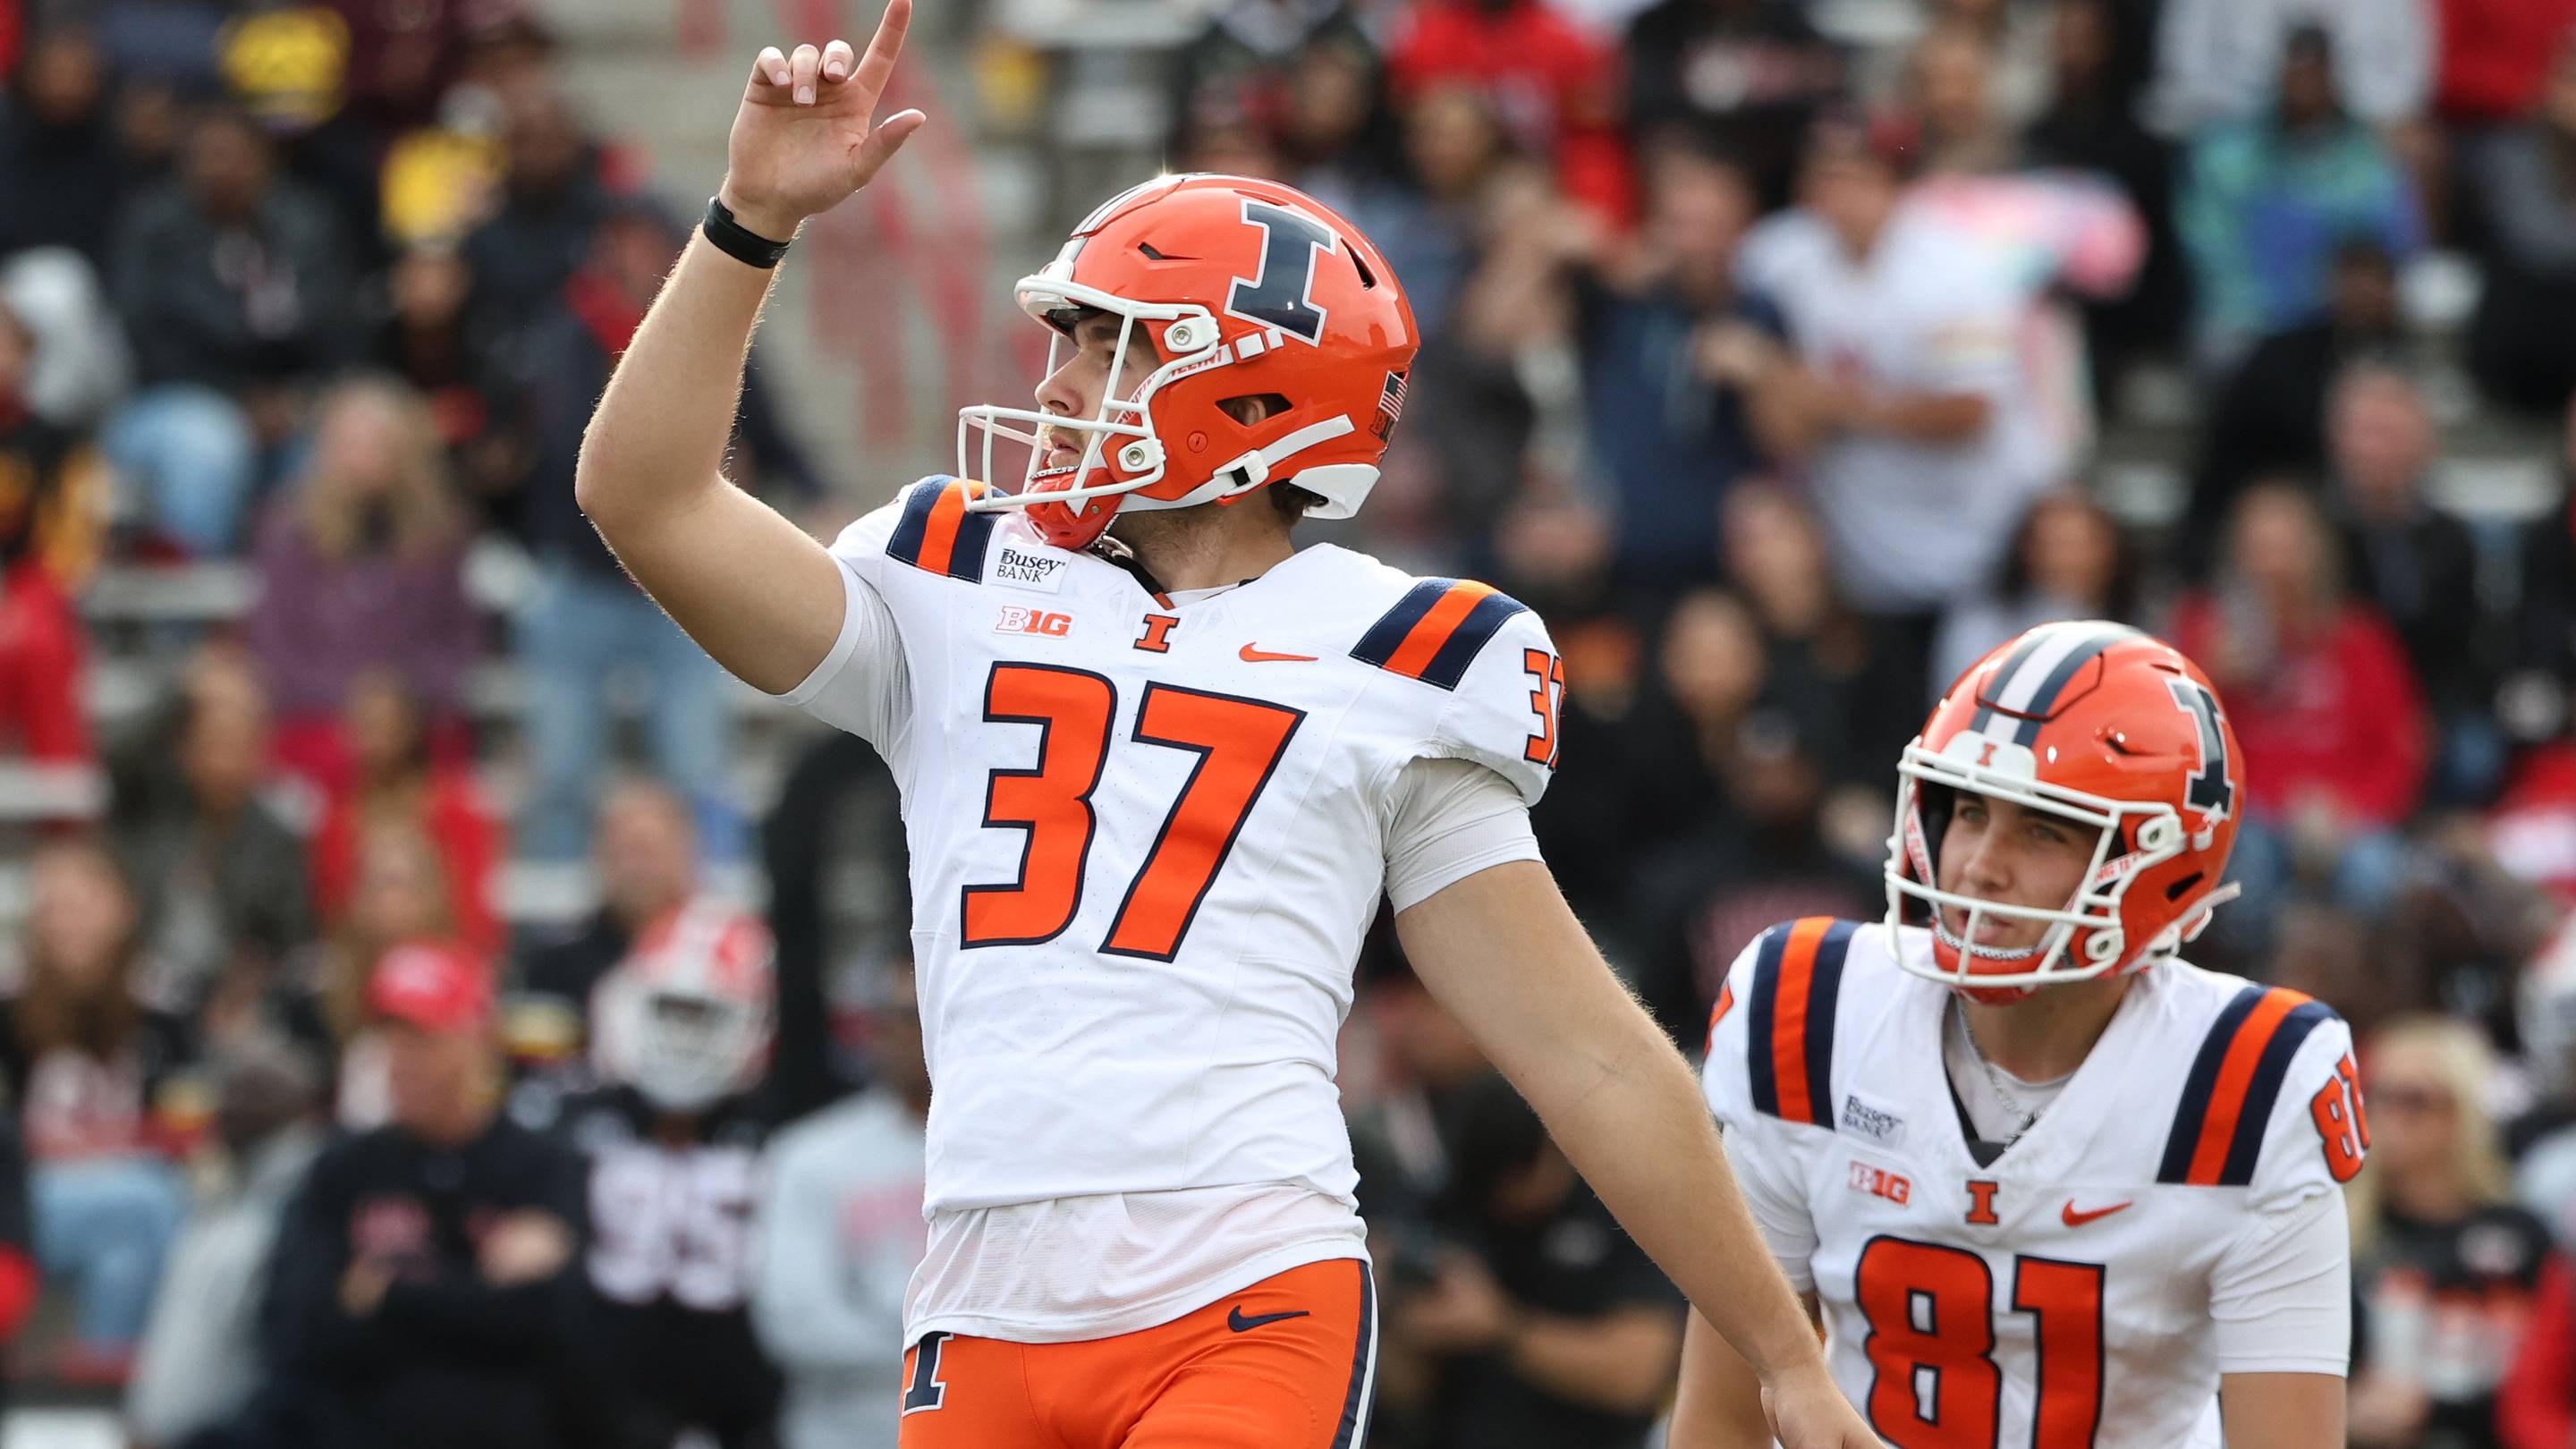
Illinois Escapes Maryland Scare with Last-Second Field Goal, Soc…

Florida State Fires Mike Norvell: Seminoles to Pay Record $50.3 …

Jimbo Fisher Reportedly Lobbying for Florida State Return as FSU…

Mario Cristobal Addresses Miami's Defensive Woes After Narrow Wi…
Boise State Honors Kellen Moore with 11-Foot Bronze Statue Amid …