


TEXAS TECH
TEXAS TECHTTU
6-1 | Road
24

CINCINNATI
CINCINNATICIN
5-2 | Home
37
Key Game

KEY GAME
Will Karoll
#49 | Punter@

KEY GAME
Max Fletcher
#31 | Punter| Player | |
|---|---|
| Will Karoll | None-None |
| Max Fletcher | None-None |
None-None
W-L
None-None
AI Model Win Probability
TEXAS TECH
80%
CINCINNATI
20%
TEXAS TECH
80%
Book Odds: -410
CINCINNATI
23%
Book Odds: +340
AI Model Projected Total
AI Projection
51.0
Projected
Book Total
57.5
Over / Under Line
▼
Edge: +6.5 (Under)
Over 57.5
37%
Under 57.5
63%
AI Model Spread Expectation
AI Spread Proj
-14.6
TEXAS TECH
Book Spread
-11
Book Line
▲ Edge: +3.6 points (Texas Tech)
Spread Distribution
AI Model
-42-28-140+14+28+42
Distribution centered around TTU -14.6 expected margin.
Margin of Victory (TTU)
TTU By 1-6 points
12.5%
TTU By 7-13 points
18.7%
CIN By 1-6 points
7.5%
CIN By 7-13 points
4.4%
AI Model Projected Score
Texas Tech
32.8
TEXAS TECH
Book Implied: 34.20
Cincinnati
18.2
CINCINNATI
Book Implied: 23.20
Simulated Score
Texas Tech
29
TEXAS TECH
Book Implied: 34.20
Cincinnati
34
CINCINNATI
Book Implied: 23.20
Projections Grades
Moneyline (ML)
Divergence
👑 Top Selection
AI
Texas Tech
Loss
80% Win Prob
A
Sim
Cincinnati
Win
68% Win Prob
A
Point Spread (ATS)
Divergence
AI
Texas Tech (-11)
Loss
Proj Spread: -14.6
C
Sim
Cincinnati (+11)
Win
Proj Spread: -5.0
A
Over/Under (Total)
Divergence
👑 Top Selection
AI
u57.5
Loss
Proj Total: 51.0
B
Sim
o57.5
Win
Proj Total: 63.0
A
Head-to-Head History
Date
Game
Score
Oct 24, 2026
TTU @ CIN
24 - 37
Sep 28, 2024
CIN @ TTU
41 - 44
Key Model Drivers
Turnovers (L5)
+72.1% more
Texas Tech: 1.4
vs
Cincinnati: 0.4
Third Down Efficiency (L5)
+9.0% more
Cincinnati: 0.5
vs
Texas Tech: 0.4
Post-Mortem Analysis
Metric
Projected
Actual
Score Game
TTU Score
32.8
24
CIN Score
18.2
37
Team Stats Splits (Home / Away)
First Downs
21.3 / 21.6
21.0 / 22.0
Rushing Yards
200.7 / 209.0
255.0 / 173.0
Third Down Efficiency
0.5 / 0.4
0.31 / 0.2
Time of Possession
0.5 / 0.5
0.49 / 0.51
Total Yards
460.5 / 432.3
427.0 / 400.0
Turnovers
0.4 / 1.4
2.0 / 3.0
Public Market Splits
Moneyline
Open: -426 / +330
→
-410 / +340
↓
Spread (ATS)
Open: -11.5 / +11.5
→
-11 / +11
↑
Total (O/U)
Open: 55.5
→
57.5
↑
Situational Trends
📊 Win-Loss
TTU
Advantage
7-1-0
(87.5%)
Margin: 14.5
ATS +/-: -5.0
CIN
5-3-0
(62.5%)
Margin: 4.9
ATS +/-: +1.6
🎯 ATS (Spread)
TTU
4-4-0
(50.0%)
Margin: 14.5
ATS +/-: -5.0
CIN
4-4-0
(50.0%)
Margin: 4.9
ATS +/-: +1.6
⚖️ Over/Under
TTU
6-2-0
O: 75.0% / U: 25.0%
Total +/-: +2.1
CIN
6-2-0
O: 75.0% / U: 25.0%
Total +/-: +6.8
Season to Date Model Accuracy
AI Model
SIM Engine
CIN
TTU
CIN
TTU
ML
57%
4-3
88%
7-1
75%
6-2
100%
8-0
ATS
43%
3-4
62%
5-3
62%
5-3
38%
3-5
TTL
29%
2-5
62%
5-3
50%
4-4
62%
5-3
Contextual Game News

Georgia Takes Top Spot in Latest College Football Playoff Projec…
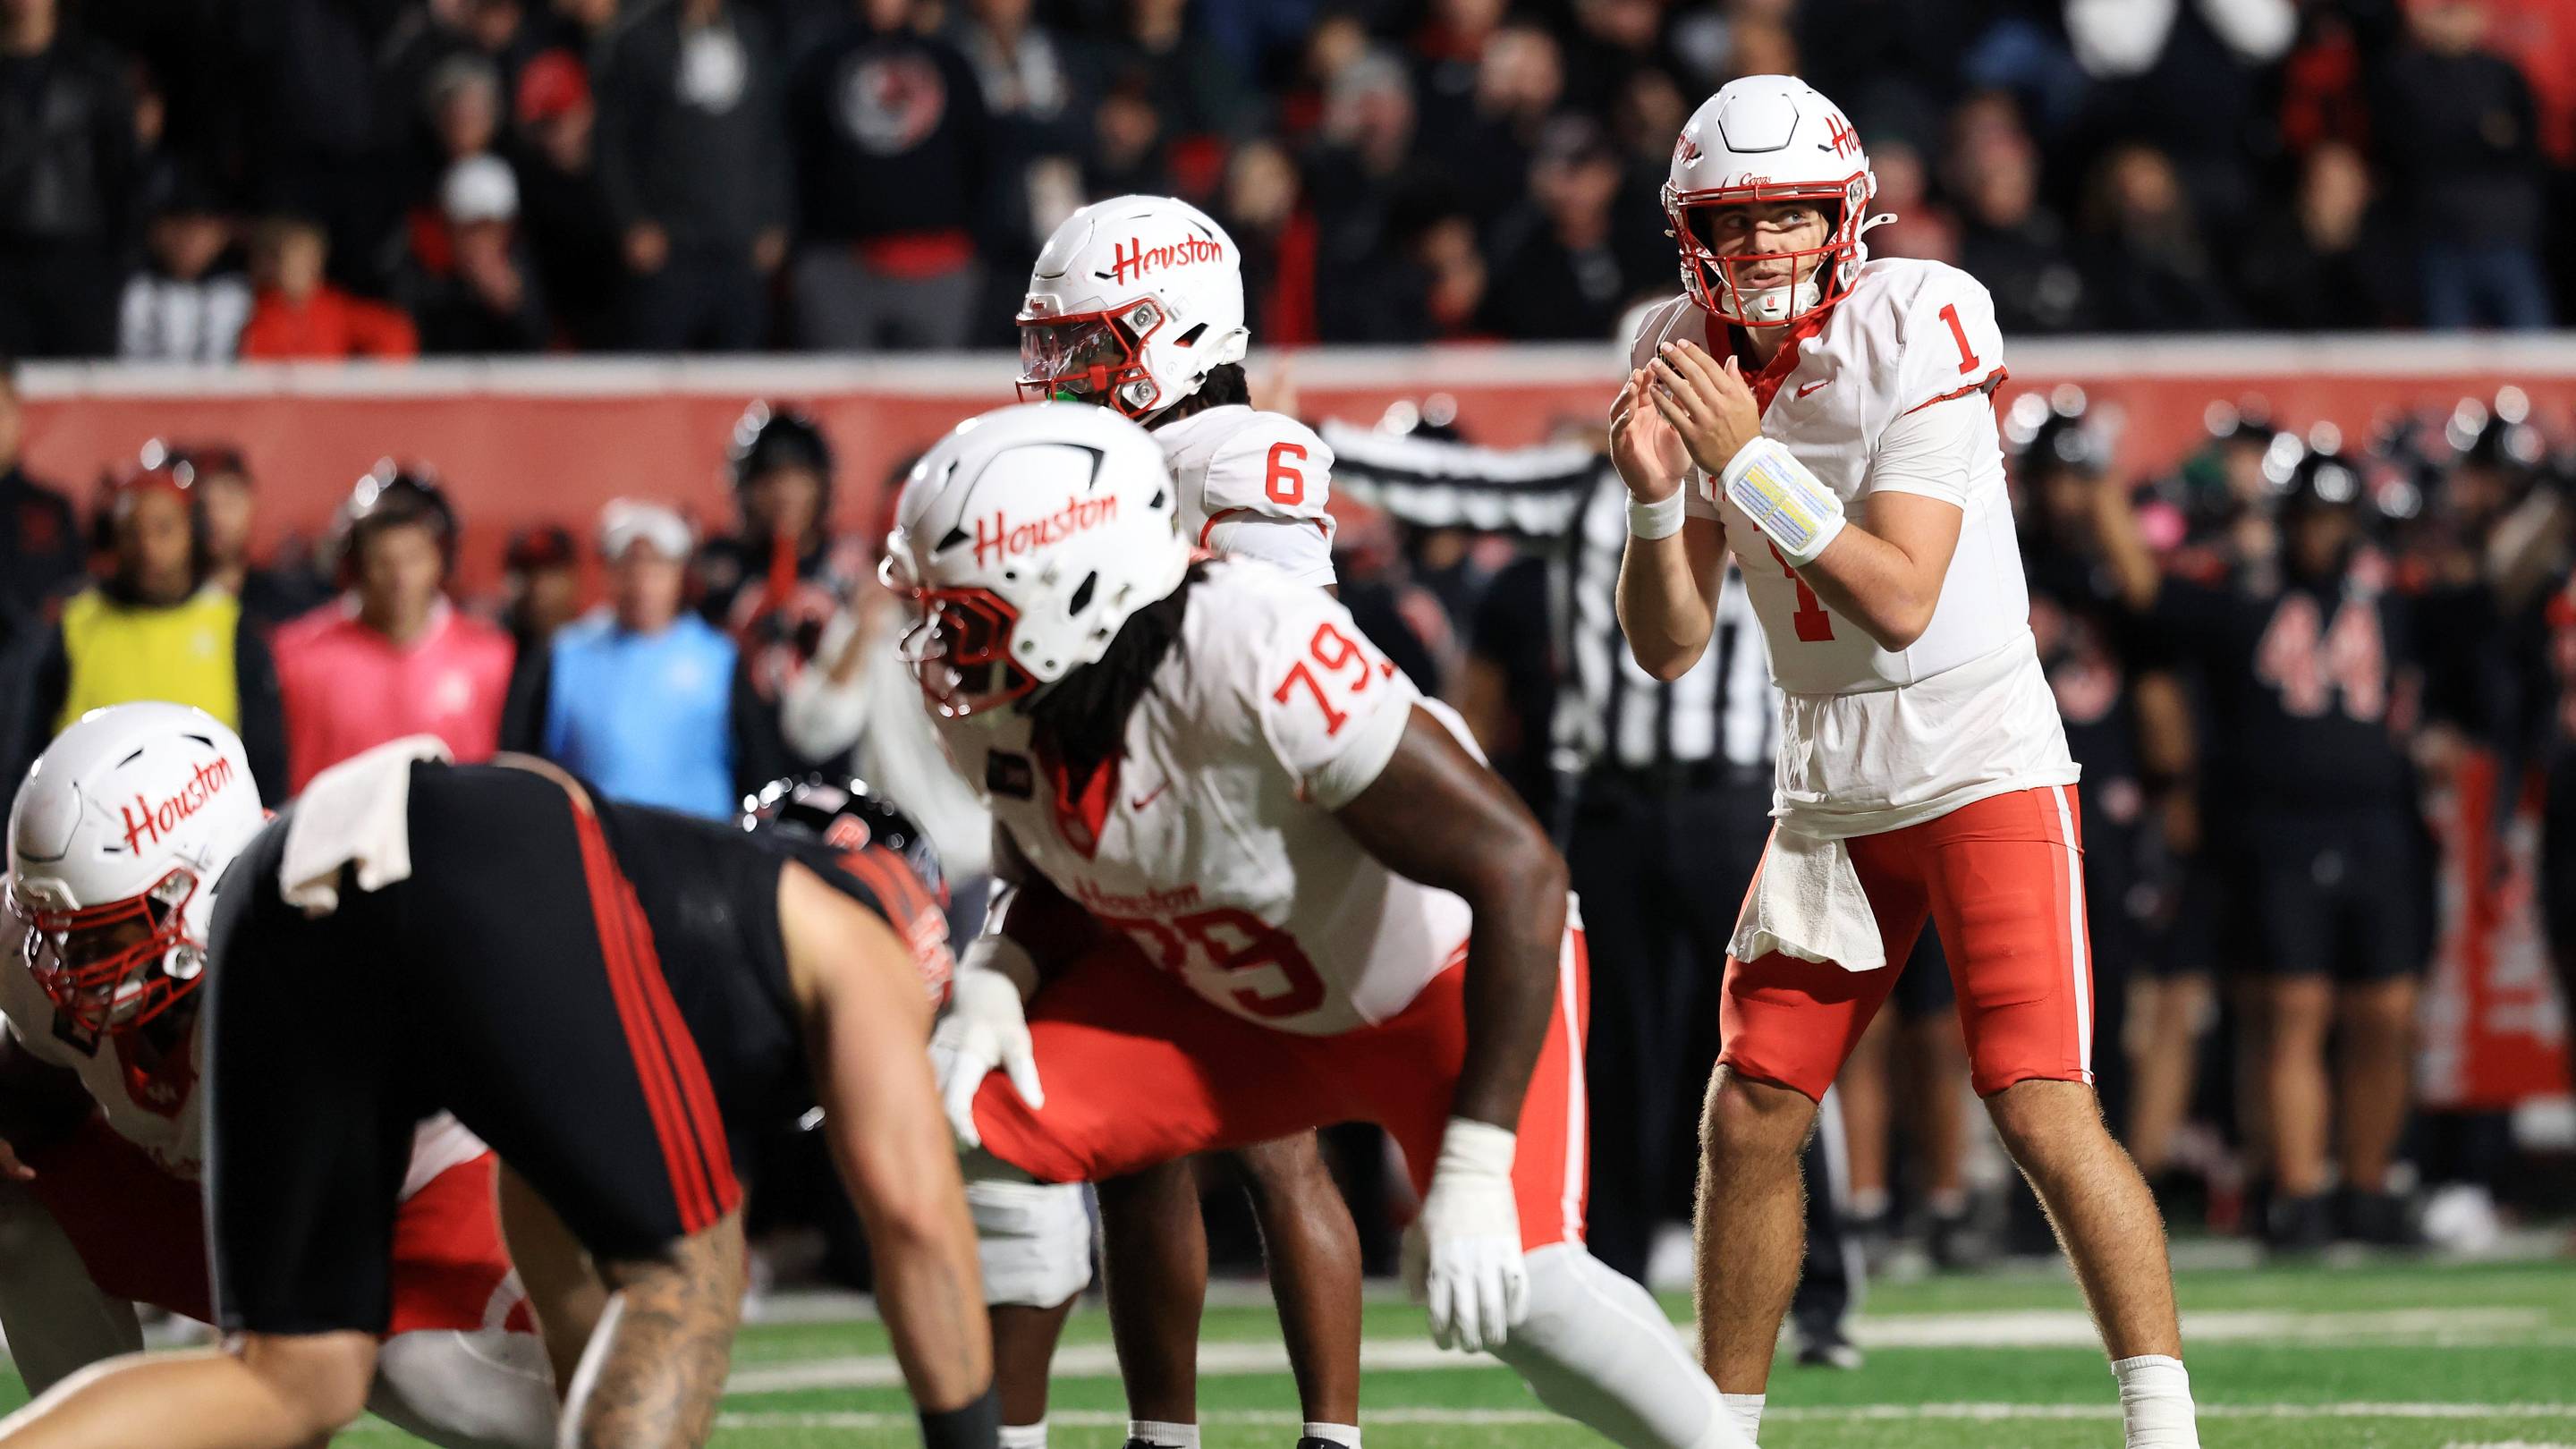
Houston Cougars Face Cincinnati Bearcats: Four Pressing Question…

Colin Hitschler's Defensive Overhaul Powers UCLA's Unprecedented…

Big 12 Bowl Shakeup: Utah and BYU Lead CFP Charge, Texas Tech an…
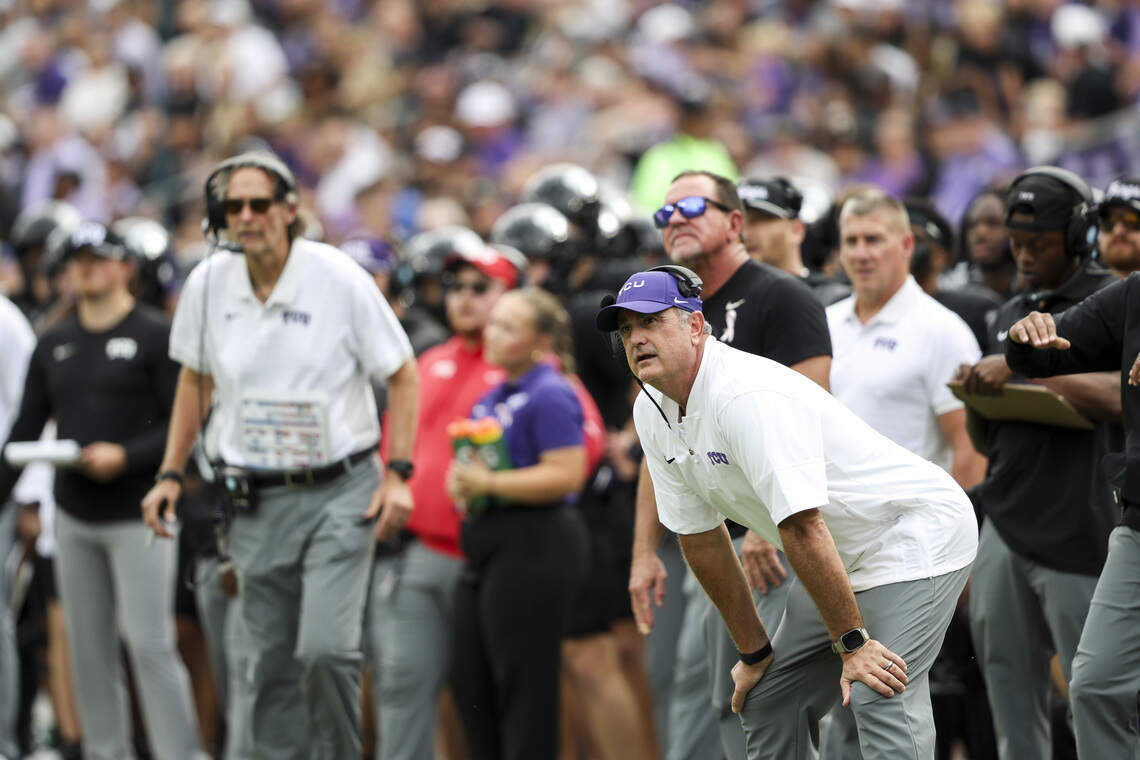
Sonny Dykes Demands Transparency While Facing Matt Rhule-Style S…