


OLE MISS
OLE MISSMISS
5-2 | Road
27

TEXAS
TEXASTEX
5-2 | Home
34
Key Game

KEY GAME
Lucas Carneiro
#17 | Place kicker@

KEY GAME
Mac Chiumento
#43 | Punter| Player | |
|---|---|
| Lucas Carneiro | None-None |
| Mac Chiumento | None-None |
None-None
W-L
None-None
AI Model Win Probability
OLE MISS
52%
TEXAS
48%
▲ Edge: +8.10% (MISS)
OLE MISS
44%
Book Odds: +130
TEXAS
61%
Book Odds: -155
AI Model Projected Total
AI Projection
54.0
Projected
Book Total
55.5
Over / Under Line
▼
Edge: +1.5 (Under)
Over 55.5
49%
Under 55.5
51%
AI Model Spread Expectation
AI Spread Proj
-0.4
OLE MISS
Book Spread
+3
Book Line
▲ Edge: +3.4 points (Ole Miss)
Spread Distribution
AI Model
-42-28-140+14+28+42
Distribution centered around MISS -0.4 expected margin.
Margin of Victory (MISS)
MISS By 1-6 points
16.6%
MISS By 7-13 points
15.7%
TEX By 1-6 points
16.3%
TEX By 7-13 points
15.1%
AI Model Projected Score
Ole Miss
27.2
OLE MISS
Book Implied: 26.20
Texas
26.8
TEXAS
Book Implied: 29.20
Simulated Score
Ole Miss
29
OLE MISS
Book Implied: 26.20
Texas
31
TEXAS
Book Implied: 29.20
Projections Grades
Moneyline (ML)
Divergence
AI
Ole Miss
Loss
52% Win Prob
D
Sim
Texas
Win
57% Win Prob
D
Point Spread (ATS)
Agreement
AI
Ole Miss (+3)
Loss
Proj Spread: -0.4
C
Sim
Ole Miss (+3)
Loss
Proj Spread: +2.0
C
Over/Under (Total)
Divergence
AI
u55.5
Loss
Proj Total: 54.0
D
Sim
o55.5
Win
Proj Total: 60.0
A
Head-to-Head History
Date
Game
Score
Oct 24, 2026
MISS @ TEX
27 - 34
Sep 14, 2013
MISS @ TEX
44 - 23
Key Model Drivers
Rushing Yards (L5)
+35.3% more
Ole Miss: 184.4
vs
Texas: 119.3
First Downs (L5)
+31.6% more
Ole Miss: 25.1
vs
Texas: 17.2
Total Yards (L5)
+26.5% more
Ole Miss: 455.4
vs
Texas: 334.7
Third Down Efficiency (L5)
+19.0% more
Ole Miss: 0.5
vs
Texas: 0.3
Post-Mortem Analysis
Metric
Projected
Actual
Score Game
MISS Score
27.2
27
TEX Score
26.8
34
Team Stats Splits (Home / Away)
First Downs
17.2 / 25.1
23.0 / 23.0
Rushing Yards
119.3 / 184.4
207.0 / 113.0
Third Down Efficiency
0.3 / 0.5
0.23 / 0.33
Time of Possession
0.5 / 0.5
0.58 / 0.42
Total Yards
334.7 / 455.4
419.0 / 363.0
Turnovers
1.3 / 1.2
3.0 / 3.0
Public Market Splits
Moneyline
Open: +190 / -230
→
+130 / -155
↓
Spread (ATS)
Open: +6.5 / -6.5
→
+3 / -3
↓
Total (O/U)
Open: 53.5
→
55.5
↑
Situational Trends
📊 Win-Loss
MISS
Advantage
5-1-0
(83.3%)
Margin: 13.7
ATS +/-: +4.2
TEX
6-2-0
(75.0%)
Margin: 13.6
ATS +/-: -0.3
🎯 ATS (Spread)
MISS
Advantage
3-3-0
(50.0%)
Margin: 13.7
ATS +/-: +4.2
TEX
3-5-0
(37.5%)
Margin: 13.6
ATS +/-: -0.3
⚖️ Over/Under
MISS
3-3-0
O: 50.0% / U: 50.0%
Total +/-: +4.0
TEX
3-5-0
O: 37.5% / U: 62.5%
Total +/-: -5.0
Season to Date Model Accuracy
AI Model
SIM Engine
TEX
MISS
TEX
MISS
ML
62%
5-3
75%
6-2
38%
3-5
88%
7-1
ATS
38%
3-5
50%
4-4
50%
4-4
50%
4-4
TTL
38%
3-5
25%
2-6
38%
3-5
62%
5-3
Contextual Game News

ESPN College GameDay Panel Unanimously Backs South Carolina Over…
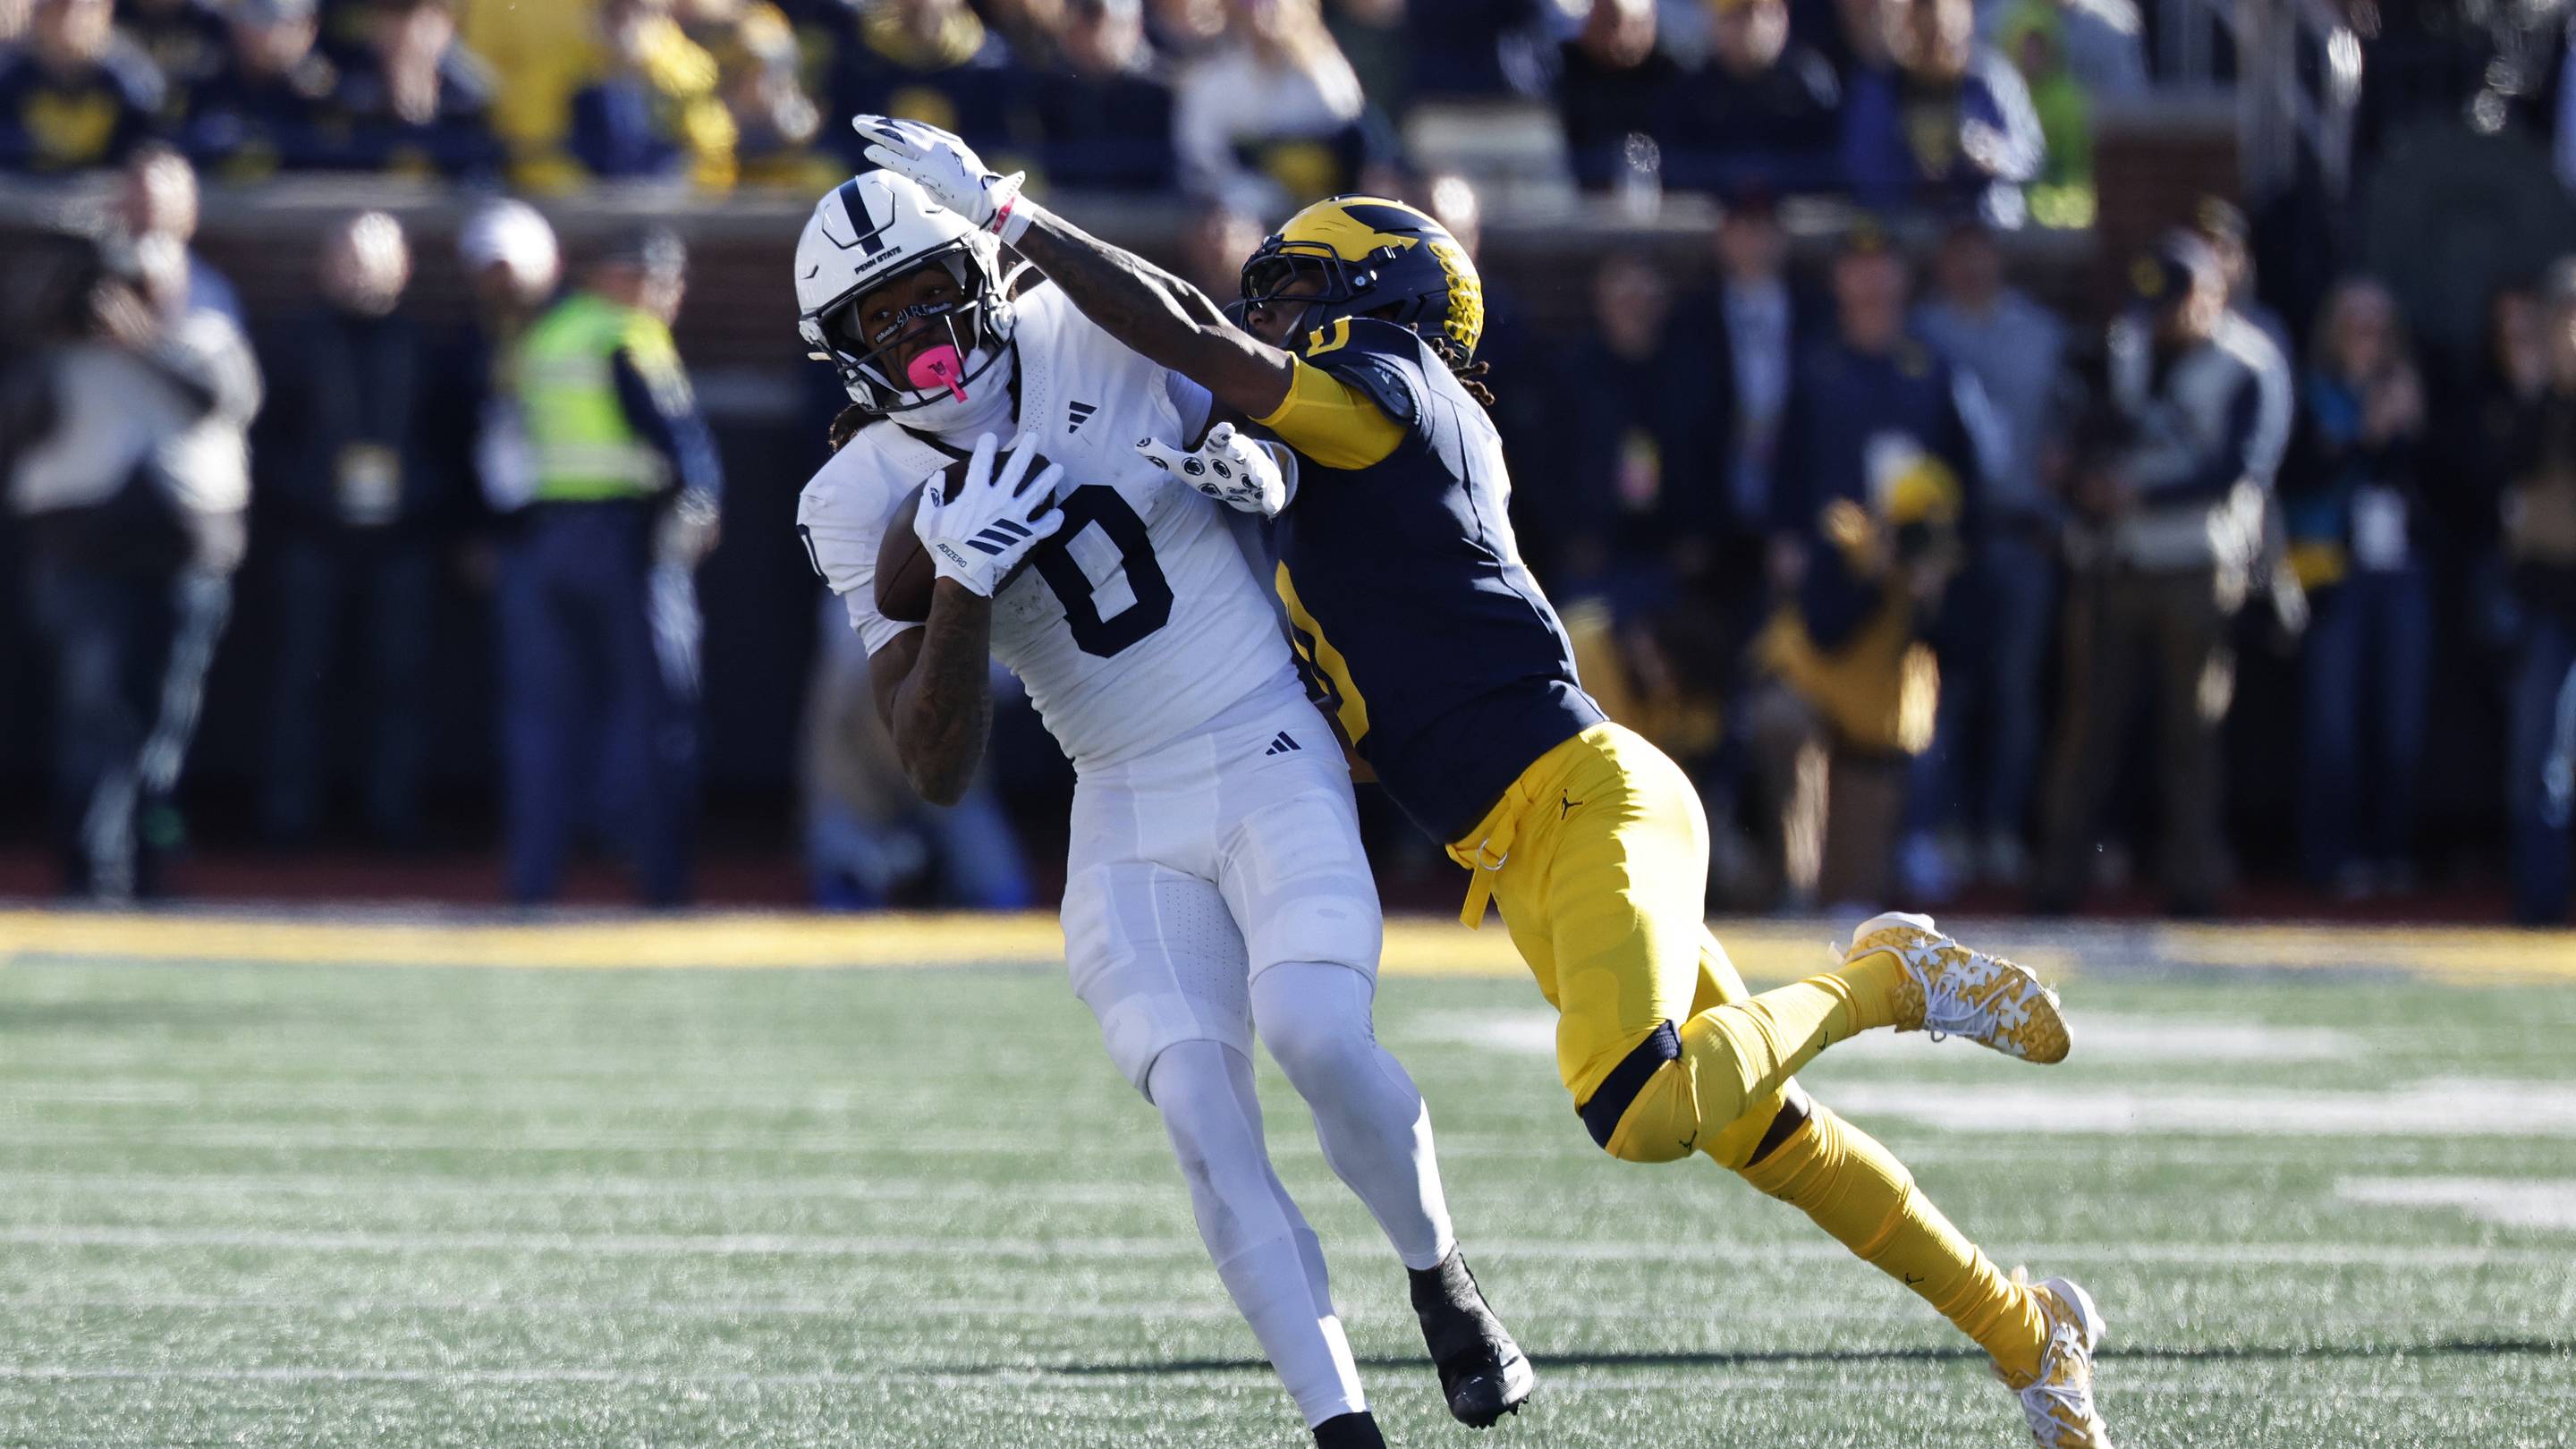
Penn State's Thin Receiver Corps Faces Tough Test at Washington

Georgia Takes Top Spot in Latest College Football Playoff Projec…

Cam Skattebo's Hamstring Woes Could Hand Devin Singletary a Work…
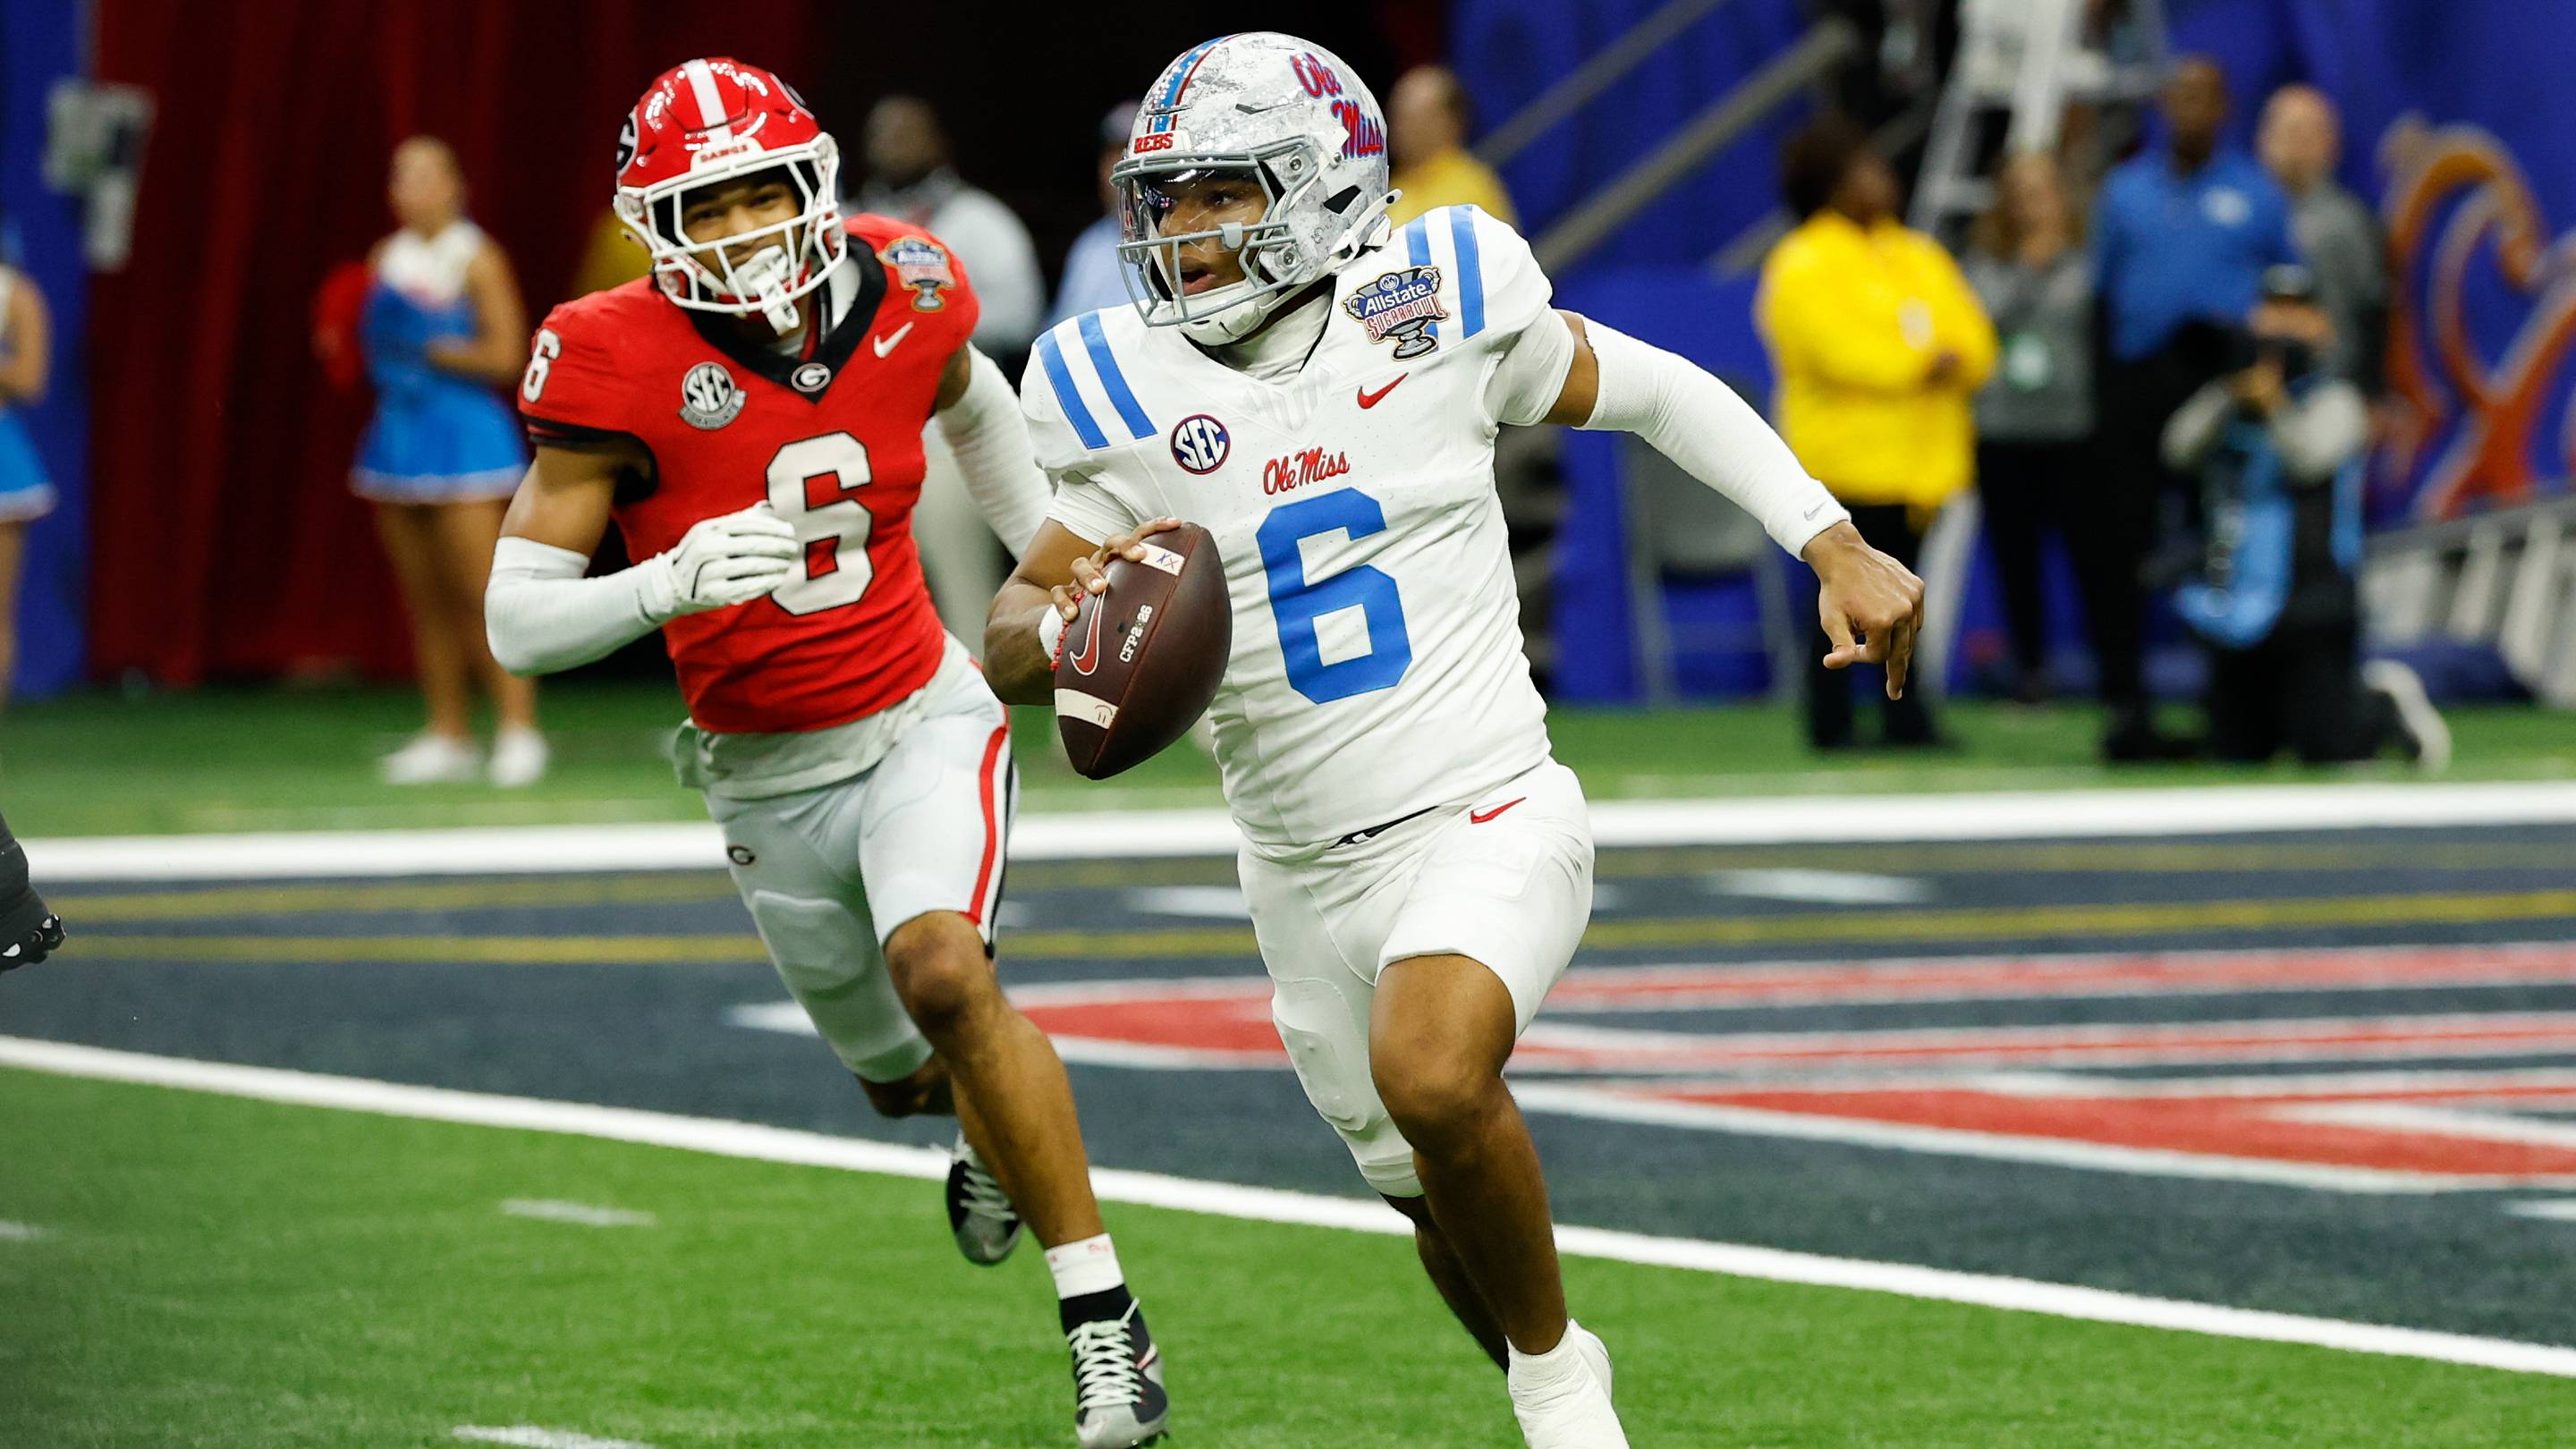
Ole Miss vs. Georgia: Staff Predictions and Score Projections fo…