



BUFFALO
BILLSBUF
5-1 | Road
33


LAS VEGAS
RAIDERSLV
3-3 | Home
30
Key Game

KEY GAME
Tommy Doman Jr.
#39 | Punter@

KEY GAME
AJ Cole
#6 | Punter| Player | |
|---|---|
| Tommy Doman Jr. | None-None |
| AJ Cole | None-None |
None-None
W-L
None-None
AI Model Win Probability
BILLS
71%
RAIDERS
29%
▲ Edge: +1.10% (BUF)
BILLS
70%
Book Odds: -228
RAIDERS
33%
Book Odds: +200
AI Model Projected Total
AI Projection
54.0
Projected
Book Total
53.5
Over / Under Line
▲
Edge: +0.5 (Over)
Over 53.5
51%
Under 53.5
49%
AI Model Spread Expectation
AI Spread Proj
-8.4
BUFFALO
Book Spread
-4.5
Book Line
▲ Edge: +3.9 points (Buffalo)
Spread Distribution
AI Model
-42-28-140+14+28+42
Distribution centered around BUF -8.4 expected margin.
Margin of Victory (BUF)
BUF By 1-6 points
16.0%
BUF By 7-13 points
19.6%
LV By 1-6 points
11.9%
LV By 7-13 points
8.5%
AI Model Projected Score
Buffalo
31.2
BUFFALO
Book Implied: 29
Las Vegas
22.8
LAS VEGAS
Book Implied: 24.50
Simulated Score
Buffalo
28
BUFFALO
Book Implied: 29
Las Vegas
21
LAS VEGAS
Book Implied: 24.50
Projections Grades
Moneyline (ML)
Agreement
👑 Top Selection
AI
Bills
Win
71% Win Prob
A
Sim
Bills
Win
75% Win Prob
A
Point Spread (ATS)
Agreement
👑 Top Selection
AI
Bills (-4.5)
Loss
Proj Spread: -8.4
B
Sim
Bills (-4.5)
Loss
Proj Spread: -7.0
B
Over/Under (Total)
Divergence
AI
o53.5
Win
Proj Total: 54.0
D
Sim
u53.5
Loss
Proj Total: 49.0
A
Head-to-Head History
Date
Game
Score
Oct 18, 2026
BUF @ LV
33 - 30
Sep 17, 2023
LV @ BUF
10 - 38
Oct 4, 2020
BUF @ LV
30 - 23
Oct 29, 2017
LV @ BUF
14 - 34
Dec 4, 2016
BUF @ LV
24 - 38
Key Model Drivers
Rushing Yards (L5)
+58.2% more
Buffalo: 170.4
vs
Las Vegas: 71.2
Turnovers (L5)
+36.6% more
Buffalo: 2.1
vs
Las Vegas: 1.4
Yards Per Play (L5)
+22.8% more
Buffalo: 6.7
vs
Las Vegas: 5.2
First Downs (L5)
+17.4% more
Buffalo: 23.7
vs
Las Vegas: 19.5
Post-Mortem Analysis
Metric
Projected
Actual
Score Game
BUF Score
31.2
33
LV Score
22.8
30
Team Stats Splits (Home / Away)
First Downs
19.5 / 23.7
25.0 / 23.0
Net Passing Yards
256.0 / 225.1
313.0 / 242.0
Rushing Yards
71.2 / 170.4
65.0 / 103.0
Third Down Efficiency
0.4 / 0.5
0.58 / 0.36
Time of Possession
0.5 / 0.5
0.47 / 0.53
Total Yards
327.3 / 395.6
378.0 / 345.0
Turnovers
1.4 / 2.1
1.0 / 0.0
Yards Per Play
5.2 / 6.7
6.2 / 5.4
Public Market Splits
Moneyline
Open: -270 / +220
→
-228 / +200
↑
Spread (ATS)
Open: -6.5 / +6.5
→
-4.5 / +4.5
↑
Total (O/U)
Open: 47.5
→
53.5
↑
Situational Trends
📊 Win-Loss
BUF
Advantage
8-1-0
(88.9%)
Margin: 9.8
ATS +/-: +5.6
LV
4-6-0
(40.0%)
Margin: -3.8
ATS +/-: +0.3
🎯 ATS (Spread)
BUF
Advantage
7-2-0
(77.8%)
Margin: 9.8
ATS +/-: +5.6
LV
6-4-0
(60.0%)
Margin: -3.8
ATS +/-: +0.3
⚖️ Over/Under
BUF
5-4-0
O: 55.6% / U: 44.4%
Total +/-: +2.8
LV
7-3-0
O: 70.0% / U: 30.0%
Total +/-: +7.3
Season to Date Model Accuracy
AI Model
SIM Engine
LV
BUF
LV
BUF
ML
70%
7-3
67%
6-3
70%
7-3
67%
6-3
ATS
50%
5-5
33%
3-6
50%
5-5
11%
1-8
TTL
20%
2-8
44%
4-5
20%
2-8
33%
3-6
Contextual Game News
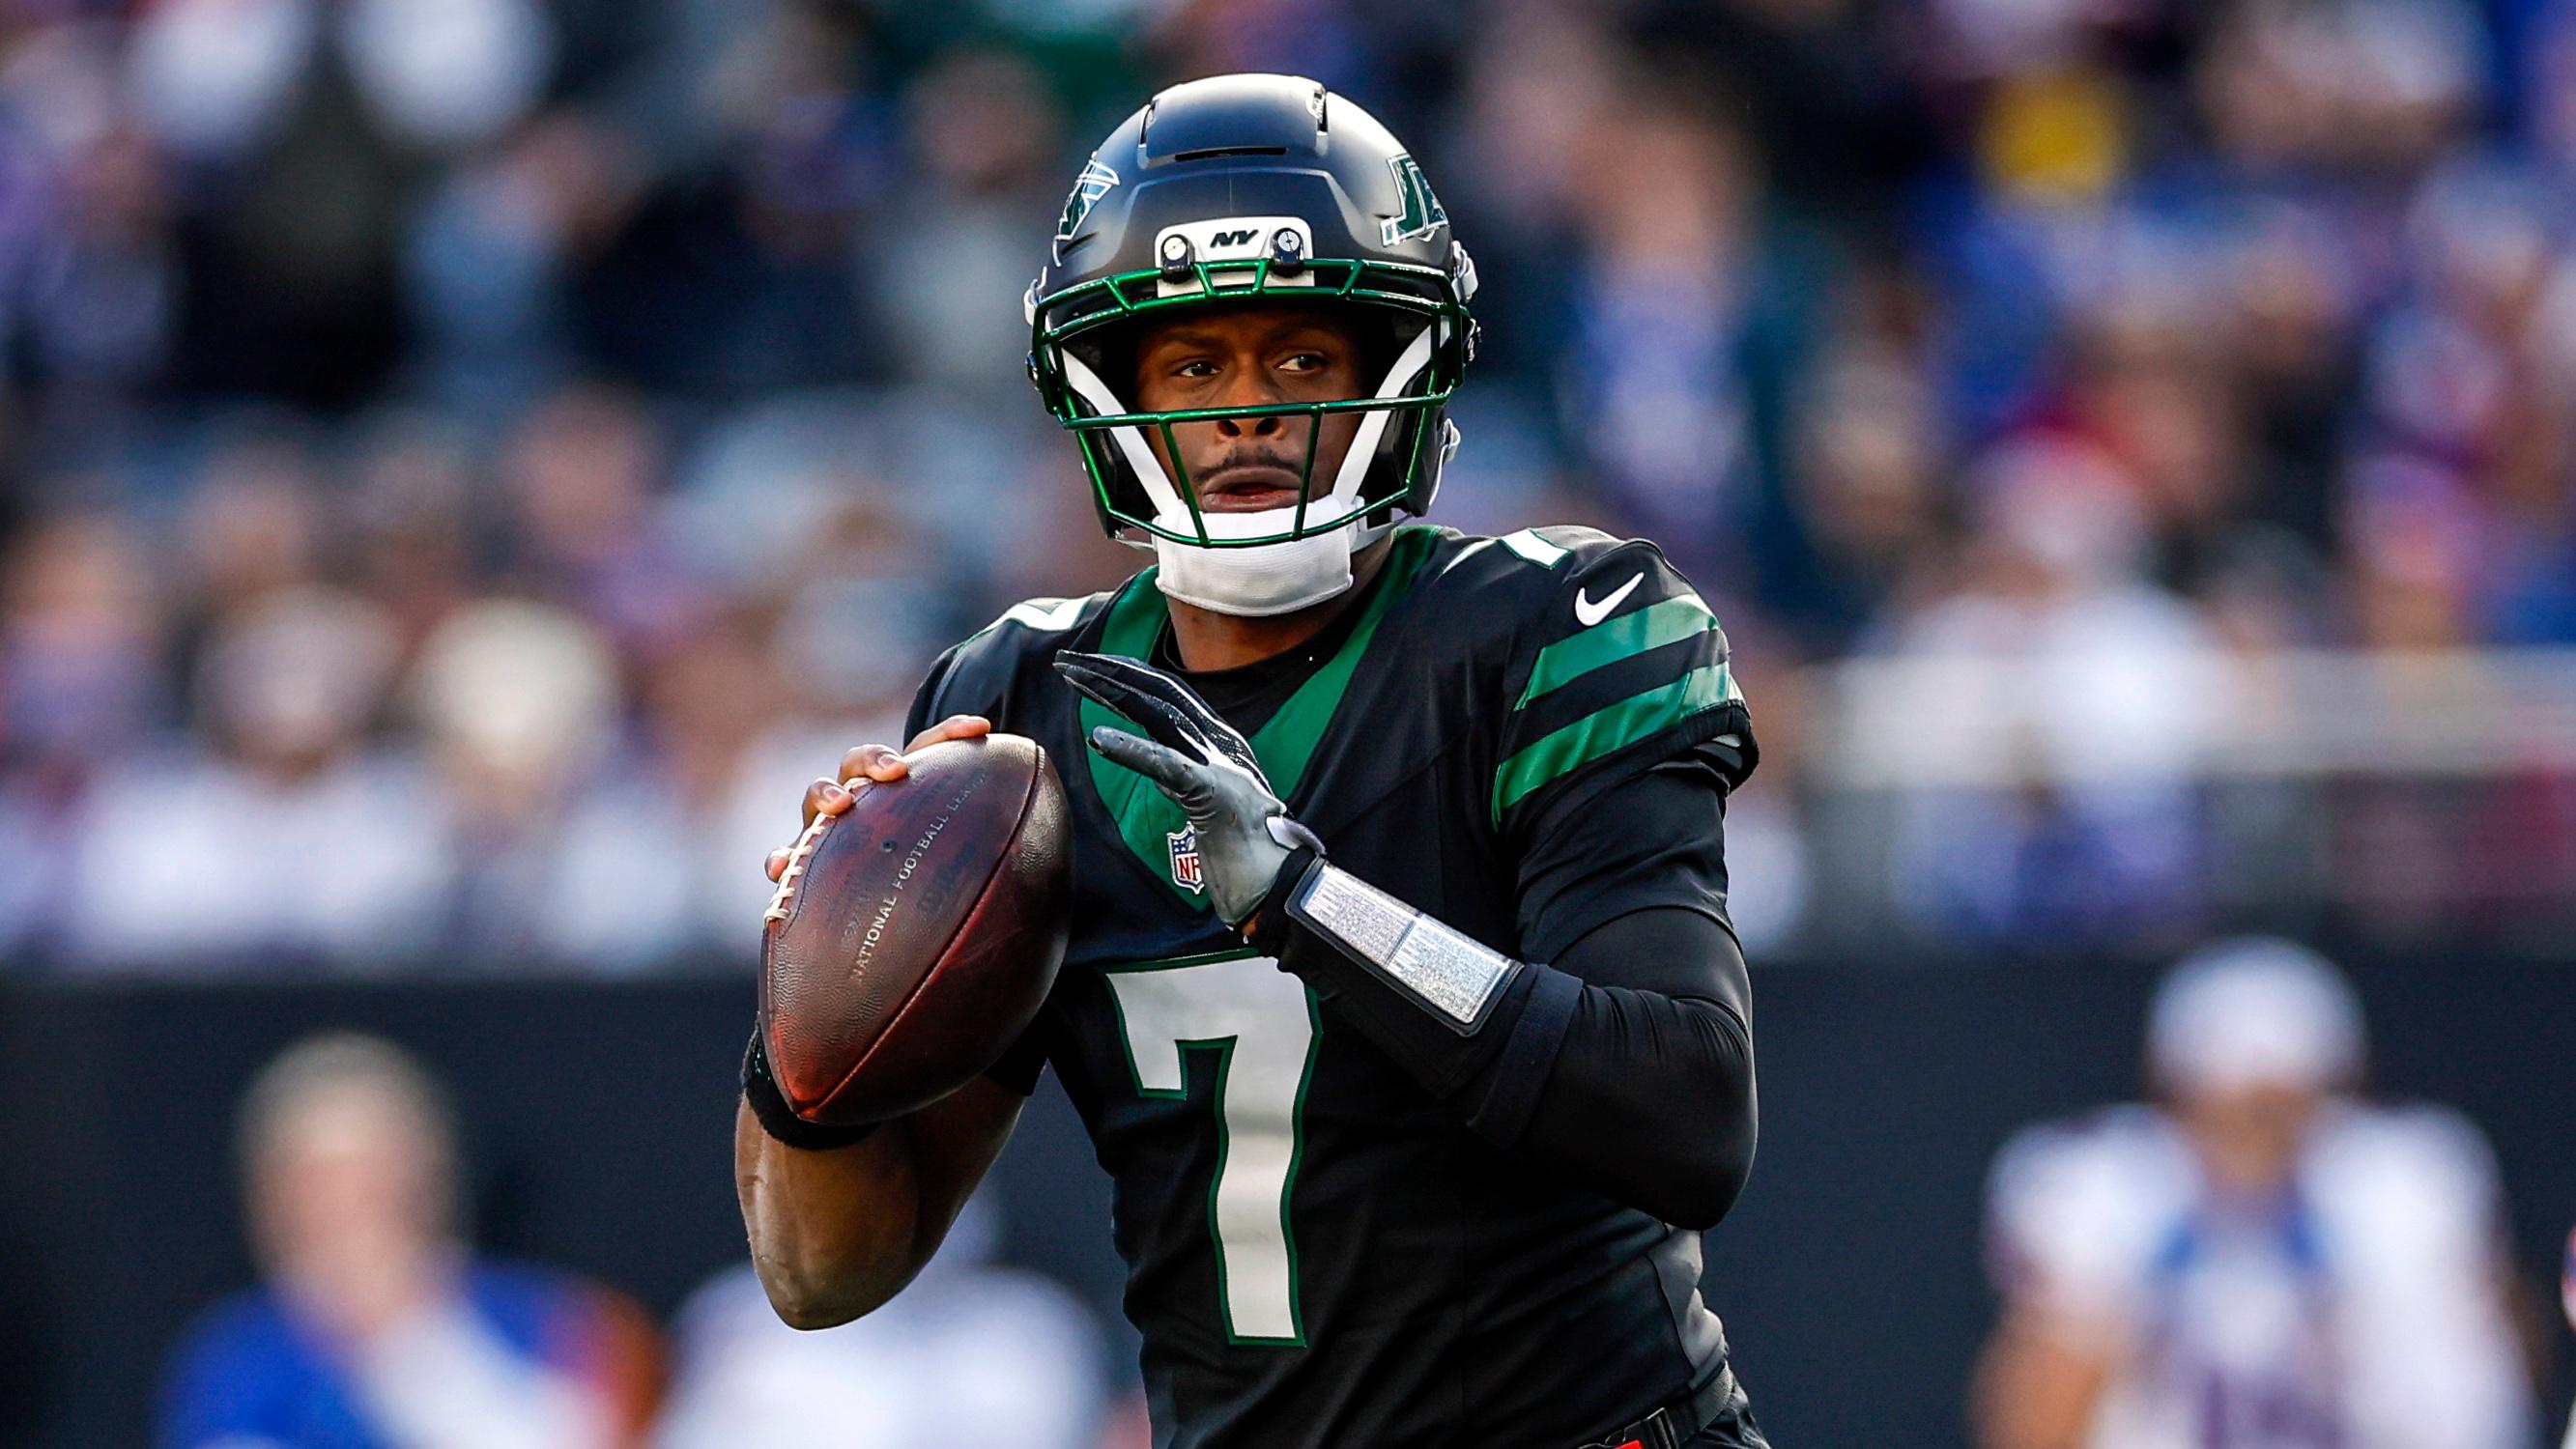
Jets' Geno Smith Limited in Practice, Ankle Injury Not Major

Dolphins' Injury Woes Deepen: Aaron Brewer Still in Concussion P…

Seahawks' Tory Horton Wins NFC Special Teams Honor for Heads-Up …
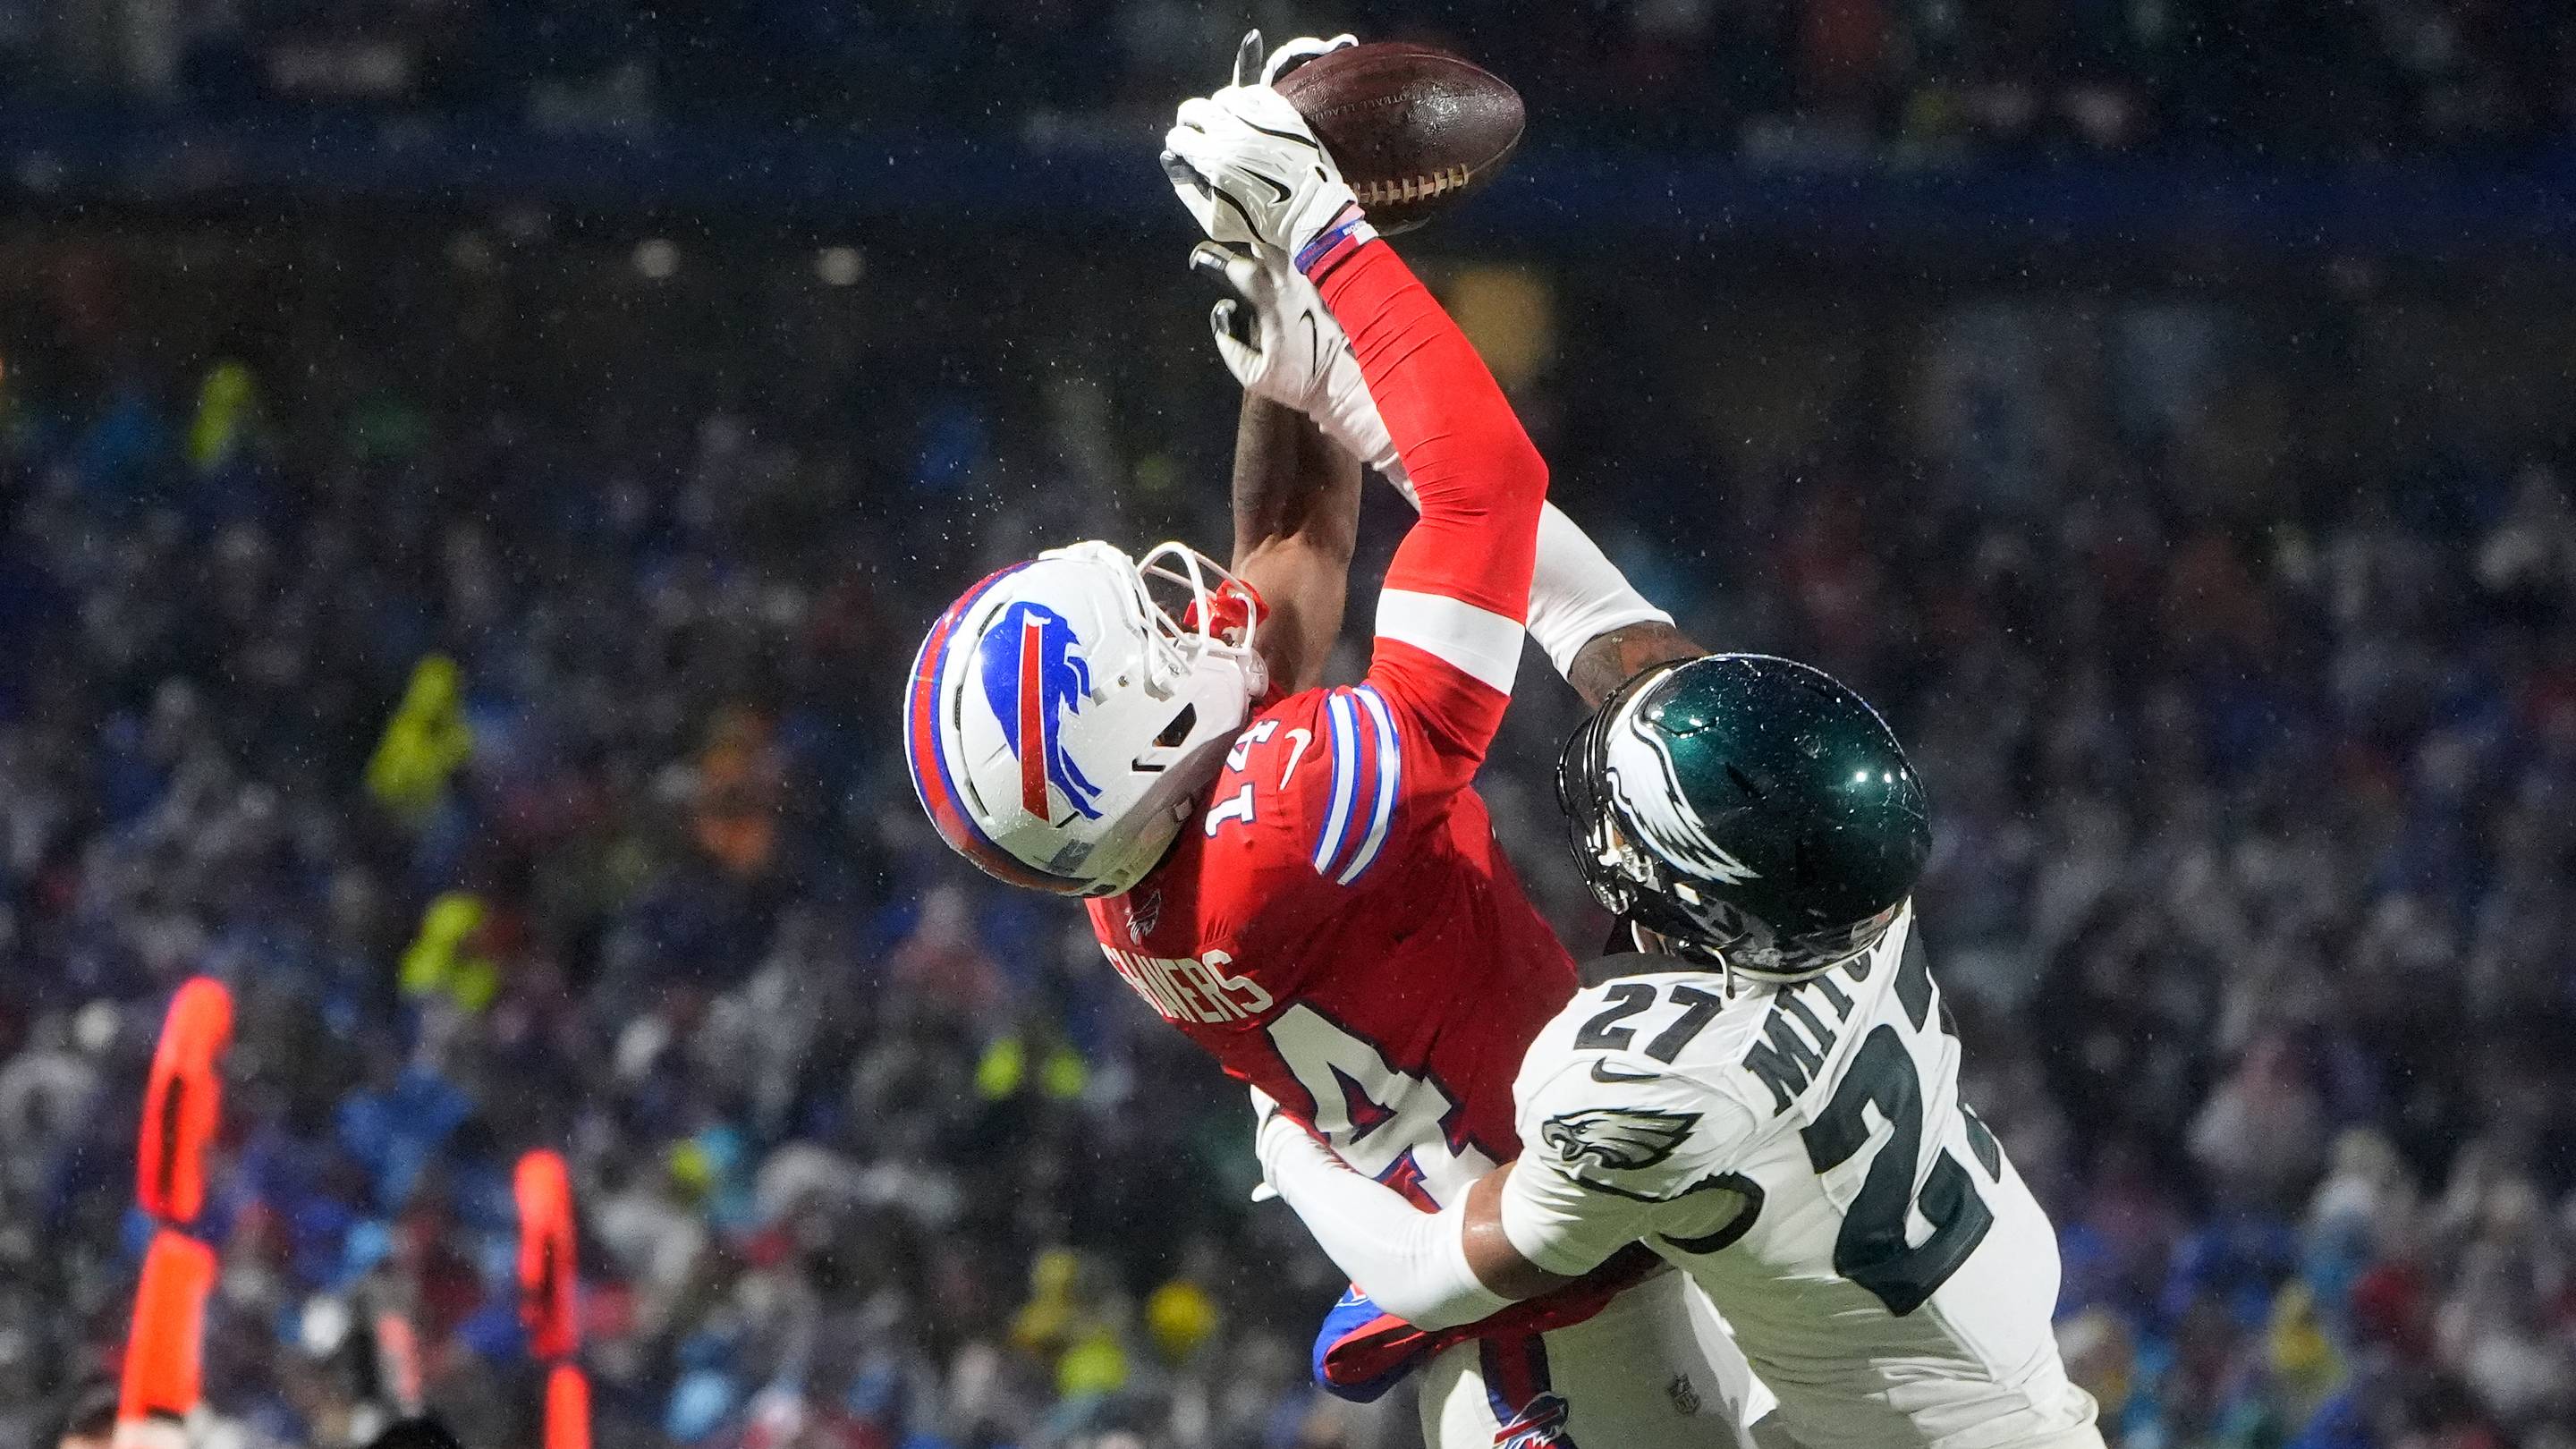
Buffalo Bills Clear Roster Space for Tyrell Shavers by Placing R…

AFC Playoff Race Shifts: Bengals Surge, Maye Injury Clouds Patri…