



PITTSBURGH
STEELERSPIT
4-2 | Road
26


TAMPA BAY
BUCCANEERSTB
1-5 | Home
19
Key Game
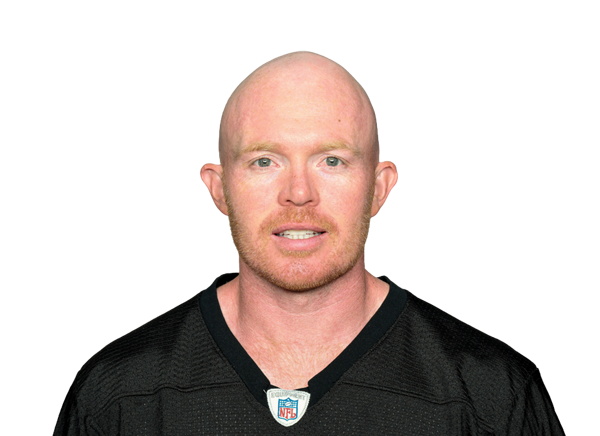
KEY GAME
Cameron Johnston
#19 | Punter@
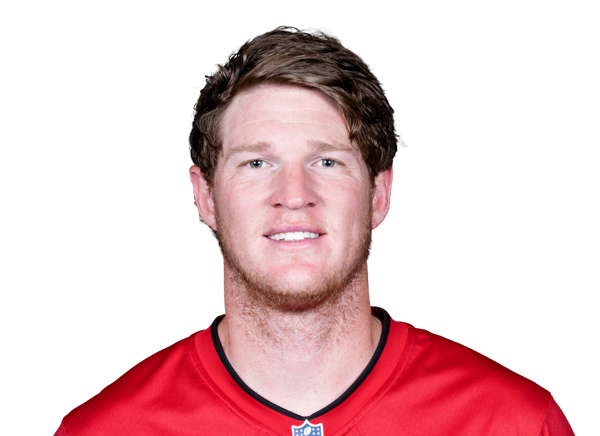
KEY GAME
Riley Dixon
#9 | Punter| Player | |
|---|---|
| Cameron Johnston | None-None |
| Riley Dixon | None-None |
None-None
W-L
None-None
AI Model Win Probability
STEELERS
48%
BUCCANEERS
52%
▲ Edge: +6.70% (TB)
STEELERS
59%
Book Odds: -142
BUCCANEERS
46%
Book Odds: +120
AI Model Projected Total
AI Projection
41.0
Projected
Book Total
38.5
Over / Under Line
▲
Edge: +2.5 (Over)
Over 38.5
57%
Under 38.5
43%
AI Model Spread Expectation
AI Spread Proj
-0.6
TAMPA BAY
Book Spread
+2.5
Book Line
▲ Edge: +3.1 points (Tampa Bay)
Spread Distribution
AI Model
+42+28+140-14-28-42
Distribution centered around TB -0.6 expected margin.
Margin of Victory (TB)
PIT By 1-6 points
16.3%
PIT By 7-13 points
14.9%
TB By 1-6 points
16.6%
TB By 7-13 points
15.8%
AI Model Projected Score
Pittsburgh
20.2
PITTSBURGH
Book Implied: 20.50
Tampa Bay
20.8
TAMPA BAY
Book Implied: 18
Simulated Score
Pittsburgh
24
PITTSBURGH
Book Implied: 20.50
Tampa Bay
22
TAMPA BAY
Book Implied: 18
Projections Grades
Moneyline (ML)
Divergence
AI
Buccaneers
Loss
52% Win Prob
D
Sim
Steelers
Win
59% Win Prob
C
Point Spread (ATS)
Agreement
AI
Buccaneers (+2.5)
Loss
Proj Spread: -0.6
C
Sim
Buccaneers (+2.5)
Loss
Proj Spread: +2.0
D
Over/Under (Total)
Agreement
AI
o38.5
Win
Proj Total: 41.0
C
Sim
o38.5
Win
Proj Total: 46.0
A
Head-to-Head History
Date
Game
Score
Oct 18, 2026
PIT @ TB
26 - 19
Oct 16, 2022
TB @ PIT
18 - 20
Sep 24, 2018
PIT @ TB
30 - 27
Sep 28, 2014
TB @ PIT
27 - 24
Sep 26, 2010
PIT @ TB
38 - 13
Key Model Drivers
Rushing Yards (L5)
+41.4% more
Tampa Bay: 155.2
vs
Pittsburgh: 109.8
Turnovers (L5)
+31.0% more
Tampa Bay: 1.3
vs
Pittsburgh: 1.0
Third Down Efficiency (L5)
+8.0% more
Tampa Bay: 0.4
vs
Pittsburgh: 0.4
Net Passing Yards (L5)
+23.4% more
Pittsburgh: 228.0
vs
Tampa Bay: 174.7
Post-Mortem Analysis
Metric
Projected
Actual
Score Game
PIT Score
20.2
26
TB Score
20.8
19
Team Stats Splits (Home / Away)
First Downs
19.5 / 18.8
17.0 / 22.0
Net Passing Yards
174.7 / 228.0
122.0 / 211.0
Rushing Yards
155.2 / 109.8
102.0 / 89.0
Third Down Efficiency
0.4 / 0.4
0.32 / 0.33
Time of Possession
0.6 / 0.5
0.45 / 0.55
Total Yards
329.9 / 337.8
224.0 / 300.0
Turnovers
1.3 / 1.0
2.0 / 1.0
Yards Per Play
5.2 / 5.7
3.1 / 3.9
Public Market Splits
Moneyline
Open: +105 / -125
→
-142 / +120
↓
Spread (ATS)
Open: +1.5 / -1.5
→
-2.5 / +2.5
↓
Total (O/U)
Open: 45.5
→
38.5
↓
Situational Trends
📊 Win-Loss
PIT
Advantage
6-3-0
(66.7%)
Margin: 1.8
ATS +/-: +0.8
TB
3-6-0
(33.3%)
Margin: 2.7
ATS +/-: +4.4
🎯 ATS (Spread)
PIT
Advantage
6-3-0
(66.7%)
Margin: 1.8
ATS +/-: +0.8
TB
4-5-0
(44.4%)
Margin: 2.7
ATS +/-: +4.4
⚖️ Over/Under
PIT
5-4-0
O: 55.6% / U: 44.4%
Total +/-: +0.8
TB
5-4-0
O: 55.6% / U: 44.4%
Total +/-: -1.7
Season to Date Model Accuracy
AI Model
SIM Engine
TB
PIT
TB
PIT
ML
44%
4-5
78%
7-2
89%
8-1
56%
5-4
ATS
25%
2-6-1
33%
3-6
62%
5-3-1
33%
3-6
TTL
33%
3-6
33%
3-6
22%
2-7
44%
4-5
Contextual Game News

Rookie Riser: Emmett Johnson Shines as Kenneth Walker III Sits
Joe Milton's Week 11 Start for Eagles: Fantasy Football Fallout …
Giants' Path to Upsetting Jaguars: Exposing Trevor Lawrence's Hi…
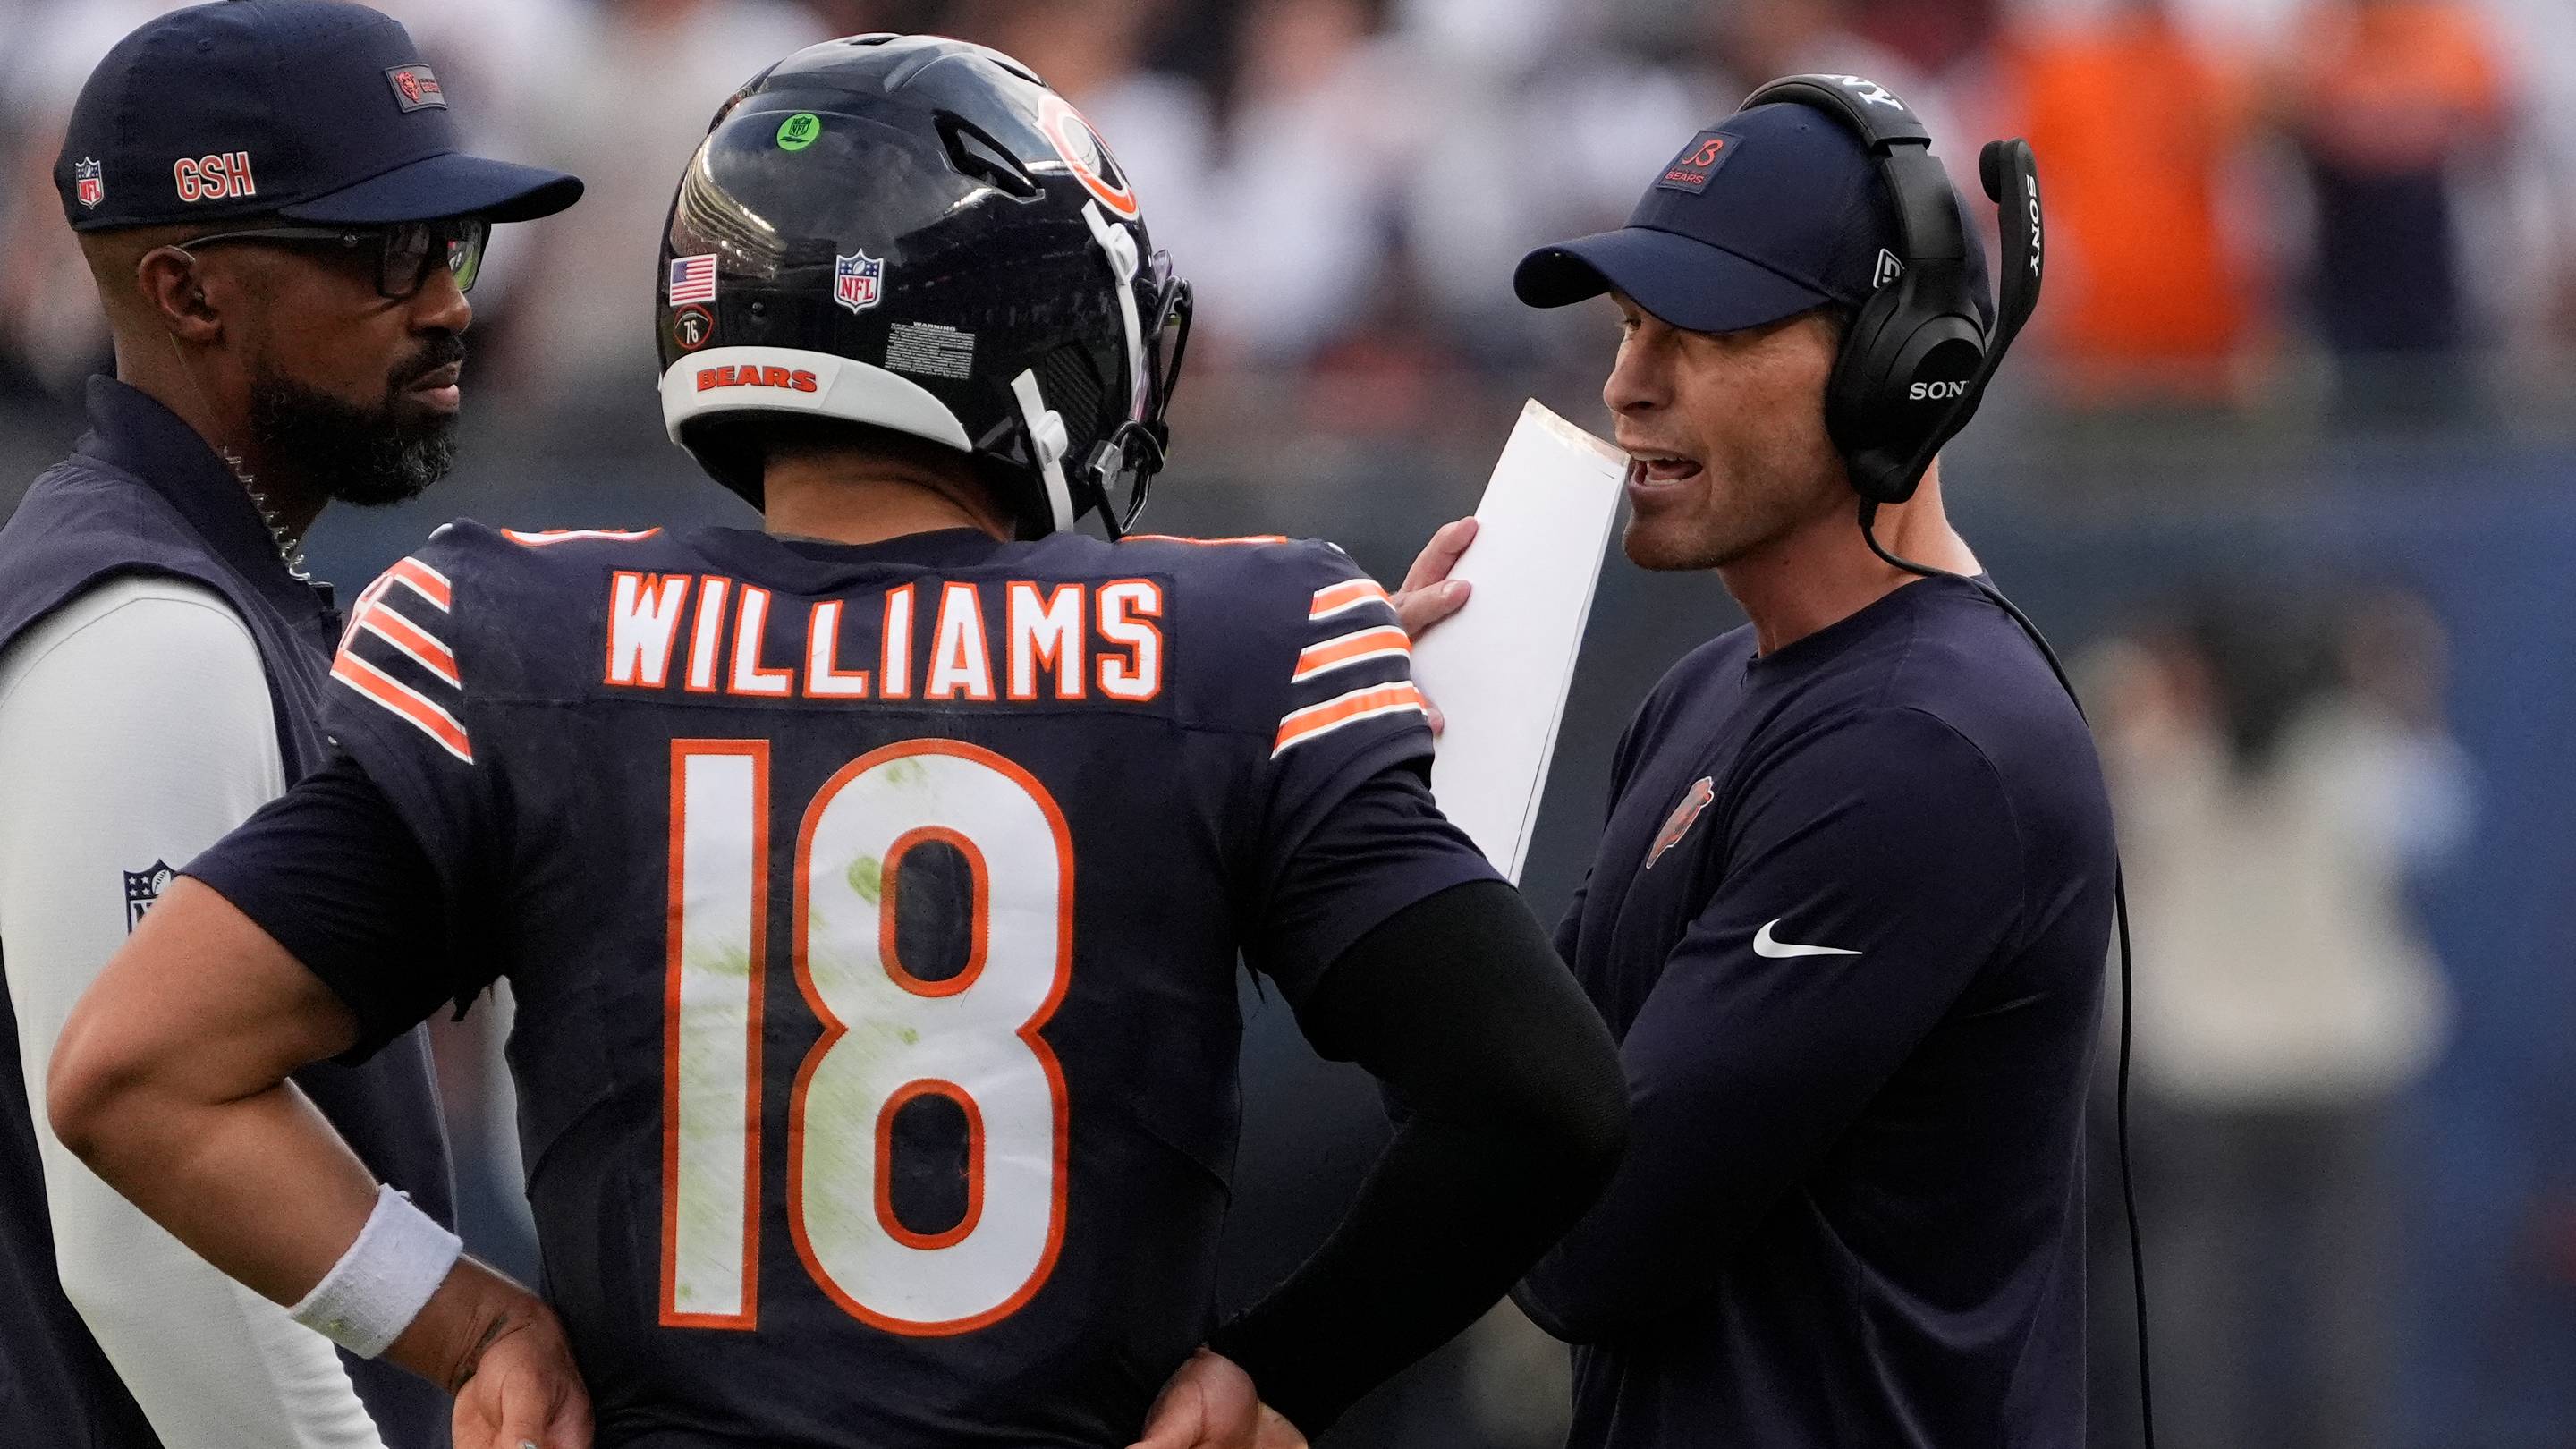
NFC Playoff Race: Bears Face Toughest Schedule, Buccaneers Have …
Athletes Set to Go Wild for GTA VI, But Insist Game Won't Interf…