



TENNESSEE
TITANSTEN
1-5 | Road
26


INDIANAPOLIS
COLTSIND
2-4 | Home
20
Key Game

KEY GAME
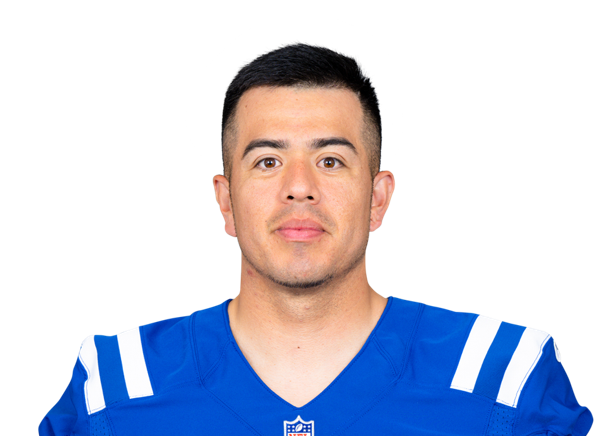
Tommy Townsend
#3 | Punter@
KEY GAME
Rigoberto Sanchez
#8 | Punter| Player | |
|---|---|
| Tommy Townsend | None-None |
| Rigoberto Sanchez | None-None |
None-None
W-L
None-None
AI Model Win Probability
TITANS
34%
COLTS
66%
▲ Edge: +5.40% (TEN)
TITANS
29%
Book Odds: +248
COLTS
74%
Book Odds: -287
AI Model Projected Total
AI Projection
42.0
Projected
Book Total
44.0
Over / Under Line
▼
Edge: +2.0 (Under)
Over 44.0
44%
Under 44.0
56%
AI Model Spread Expectation
AI Spread Proj
-9.6
INDIANAPOLIS
Book Spread
-6.5
Book Line
▲ Edge: +3.1 points (Indianapolis)
Spread Distribution
AI Model
+42+28+140-14-28-42
Distribution centered around IND -9.6 expected margin.
Margin of Victory (IND)
TEN By 1-6 points
11.0%
TEN By 7-13 points
7.6%
IND By 1-6 points
15.5%
IND By 7-13 points
19.7%
AI Model Projected Score
Tennessee
16.2
TENNESSEE
Book Implied: 18.80
Indianapolis
25.8
INDIANAPOLIS
Book Implied: 25.20
Simulated Score
Tennessee
21
TENNESSEE
Book Implied: 18.80
Indianapolis
27
INDIANAPOLIS
Book Implied: 25.20
Projections Grades
Moneyline (ML)
Agreement
👑 Top Selection
AI
Colts
Loss
66% Win Prob
B
Sim
Colts
Loss
72% Win Prob
A
Point Spread (ATS)
Divergence
AI
Colts (-6.5)
Loss
Proj Spread: -9.6
B
Sim
Titans (+6.5)
Win
Proj Spread: +6.0
D
Over/Under (Total)
Divergence
AI
u44.0
Loss
Proj Total: 42.0
C
Sim
o44.0
Win
Proj Total: 48.0
A
Head-to-Head History
Date
Game
Score
Oct 18, 2026
TEN @ IND
26 - 20
Oct 26, 2025
TEN @ IND
14 - 38
Sep 21, 2025
IND @ TEN
41 - 20
Dec 22, 2024
TEN @ IND
30 - 38
Oct 13, 2024
IND @ TEN
20 - 17
Key Model Drivers
Net Passing Yards (L5)
+26.1% more
Indianapolis: 207.2
vs
Tennessee: 164.3
Total Yards (L5)
+22.4% more
Indianapolis: 300.1
vs
Tennessee: 245.1
First Downs (L5)
+15.3% more
Indianapolis: 18.8
vs
Tennessee: 16.3
Rushing Yards (L5)
+15.0% more
Indianapolis: 92.9
vs
Tennessee: 80.7
Post-Mortem Analysis
Metric
Projected
Actual
Score Game
TEN Score
16.2
26
IND Score
25.8
20
Team Stats Splits (Home / Away)
First Downs
18.8 / 16.3
24.0 / 11.0
Net Passing Yards
207.2 / 164.3
234.0 / 102.0
Rushing Yards
92.9 / 80.7
165.0 / 84.0
Third Down Efficiency
0.4 / 0.3
0.47 / 0.3
Time of Possession
0.5 / 0.4
0.64 / 0.36
Total Yards
300.1 / 245.1
399.0 / 186.0
Turnovers
1.4 / 1.6
3.0 / 1.0
Yards Per Play
4.6 / 4.3
5.1 / 4.1
Public Market Splits
Moneyline
Open: +164 / -198
→
+248 / -287
↑
Spread (ATS)
Open: +3.5 / -3.5
→
+6.5 / -6.5
↑
Total (O/U)
Open: 47.5
→
44
↓
Situational Trends
📊 Win-Loss
TEN
1-8-0
(11.1%)
Margin: -8.0
ATS +/-: -1.4
IND
Advantage
3-7-0
(30.0%)
Margin: -6.3
ATS +/-: -4.4
🎯 ATS (Spread)
TEN
4-5-0
(44.4%)
Margin: -8.0
ATS +/-: -1.4
IND
Advantage
5-5-0
(50.0%)
Margin: -6.3
ATS +/-: -4.4
⚖️ Over/Under
TEN
5-4-0
O: 55.6% / U: 44.4%
Total +/-: +4.1
IND
6-4-0
O: 60.0% / U: 40.0%
Total +/-: +3.4
Season to Date Model Accuracy
AI Model
SIM Engine
IND
TEN
IND
TEN
ML
80%
8-2
67%
6-3
70%
7-3
56%
5-4
ATS
40%
4-6
56%
5-4
30%
3-7
56%
5-4
TTL
60%
6-4
22%
2-7
50%
5-5
56%
5-4
Contextual Game News

Colts vs. Texans: Thursday Night Football Showdown with Second P…

Oklahoma State Star QB Drew Mestemaker Listed as Questionable fo…

Giants' Defense Powers NFC East Lead, But Jaguars Present Unprec…
Patriots 2027 Free Agent Forecast: Who Stays, Who Goes in New En…

Philip Rivers Taps NFL Veteran Jason Michael as NC State Offensi…