


UNLV
UNLVUNLV
4-3 | Road
31

AIR FORCE
AIR FORCEAFA
5-1 | Home
41
Key Game

KEY GAME
Matt Choules
#26 | Punter@
KEY GAME
Will Duncan
#94 | Punter| Player | |
|---|---|
| Matt Choules | None-None |
| Will Duncan | None-None |
None-None
W-L
None-None
AI Model Win Probability
UNLV
69%
AIR FORCE
31%
▲ Edge: +14.30% (UNLV)
UNLV
55%
Book Odds: -122
AIR FORCE
50%
Book Odds: +102
AI Model Projected Total
AI Projection
49.0
Projected
Book Total
49.5
Over / Under Line
▼
Edge: +0.5 (Under)
Over 49.5
49%
Under 49.5
51%
AI Model Spread Expectation
AI Spread Proj
-8.6
UNLV
Book Spread
-1.5
Book Line
▲ Edge: +7.1 points (UNLV)
Spread Distribution
AI Model
-42-28-140+14+28+42
Distribution centered around UNLV -8.6 expected margin.
Margin of Victory (UNLV)
UNLV By 1-6 points
15.9%
UNLV By 7-13 points
19.6%
AFA By 1-6 points
11.7%
AFA By 7-13 points
8.3%
AI Model Projected Score
UNLV
28.8
UNLV
Book Implied: 25.50
Air Force
20.2
AIR FORCE
Book Implied: 24
Simulated Score
UNLV
26
UNLV
Book Implied: 25.50
Air Force
34
AIR FORCE
Book Implied: 24
Projections Grades
Moneyline (ML)
Divergence
👑 Top Selection
AI
UNLV
Loss
69% Win Prob
A
Sim
Air Force
Win
79% Win Prob
A
Point Spread (ATS)
Divergence
👑 Top Selection
AI
UNLV (-1.5)
Loss
Proj Spread: -8.6
A
Sim
Air Force (+1.5)
Win
Proj Spread: -8.0
A
Over/Under (Total)
Divergence
AI
u49.5
Loss
Proj Total: 49.0
D
Sim
o49.5
Win
Proj Total: 60.0
A
Head-to-Head History
Date
Game
Score
Oct 17, 2026
UNLV @ AFA
31 - 41
Oct 11, 2025
AFA @ UNLV
48 - 51
Nov 18, 2023
UNLV @ AFA
31 - 27
Oct 15, 2022
AFA @ UNLV
42 - 7
Nov 26, 2021
UNLV @ AFA
14 - 48
Key Model Drivers
Turnovers (L5)
+42.3% more
UNLV: 1.4
vs
Air Force: 0.8
Rushing Yards (L5)
+84.1% more
Air Force: 323.8
vs
UNLV: 175.9
First Downs (L5)
+22.3% more
Air Force: 22.6
vs
UNLV: 18.5
Third Down Efficiency (L5)
+20.0% more
Air Force: 0.6
vs
UNLV: 0.4
Post-Mortem Analysis
Metric
Projected
Actual
Score Game
UNLV Score
28.8
31
AFA Score
20.2
41
Team Stats Splits (Home / Away)
First Downs
22.6 / 18.5
25.0 / 22.0
Rushing Yards
323.8 / 175.9
430.0 / 130.0
Third Down Efficiency
0.6 / 0.4
0.44 / 0.69
Time of Possession
0.6 / 0.5
0.59 / 0.41
Total Yards
384.4 / 341.9
448.0 / 376.0
Turnovers
0.8 / 1.4
0.0 / 2.0
Public Market Splits
Moneyline
Open: -144 / +123
→
-122 / +102
↑
Spread (ATS)
Open: -3 / +3
→
-1.5 / +1.5
↑
Total (O/U)
Open: 47.5
→
49.5
↑
Situational Trends
📊 Win-Loss
UNLV
4-3-0
(57.1%)
Margin: 0.4
ATS +/-: -2.4
AFA
Advantage
6-2-0
(75.0%)
Margin: 7.8
ATS +/-: +0.8
🎯 ATS (Spread)
UNLV
4-3-0
(57.1%)
Margin: 0.4
ATS +/-: -2.4
AFA
Advantage
5-3-0
(62.5%)
Margin: 7.8
ATS +/-: +0.8
⚖️ Over/Under
UNLV
2-5-0
O: 28.6% / U: 71.4%
Total +/-: -5.2
AFA
3-4-0
O: 42.9% / U: 57.1%
Total +/-: +0.1
Season to Date Model Accuracy
AI Model
SIM Engine
AFA
UNLV
AFA
UNLV
ML
29%
2-5
43%
3-4
88%
7-1
57%
4-3
ATS
43%
3-4
29%
2-5
88%
7-1
71%
5-2
TTL
29%
2-5
43%
3-4
50%
4-4
29%
2-5
Contextual Game News

Air Force Ground Game Overpowers UConn in 35-26 Victory
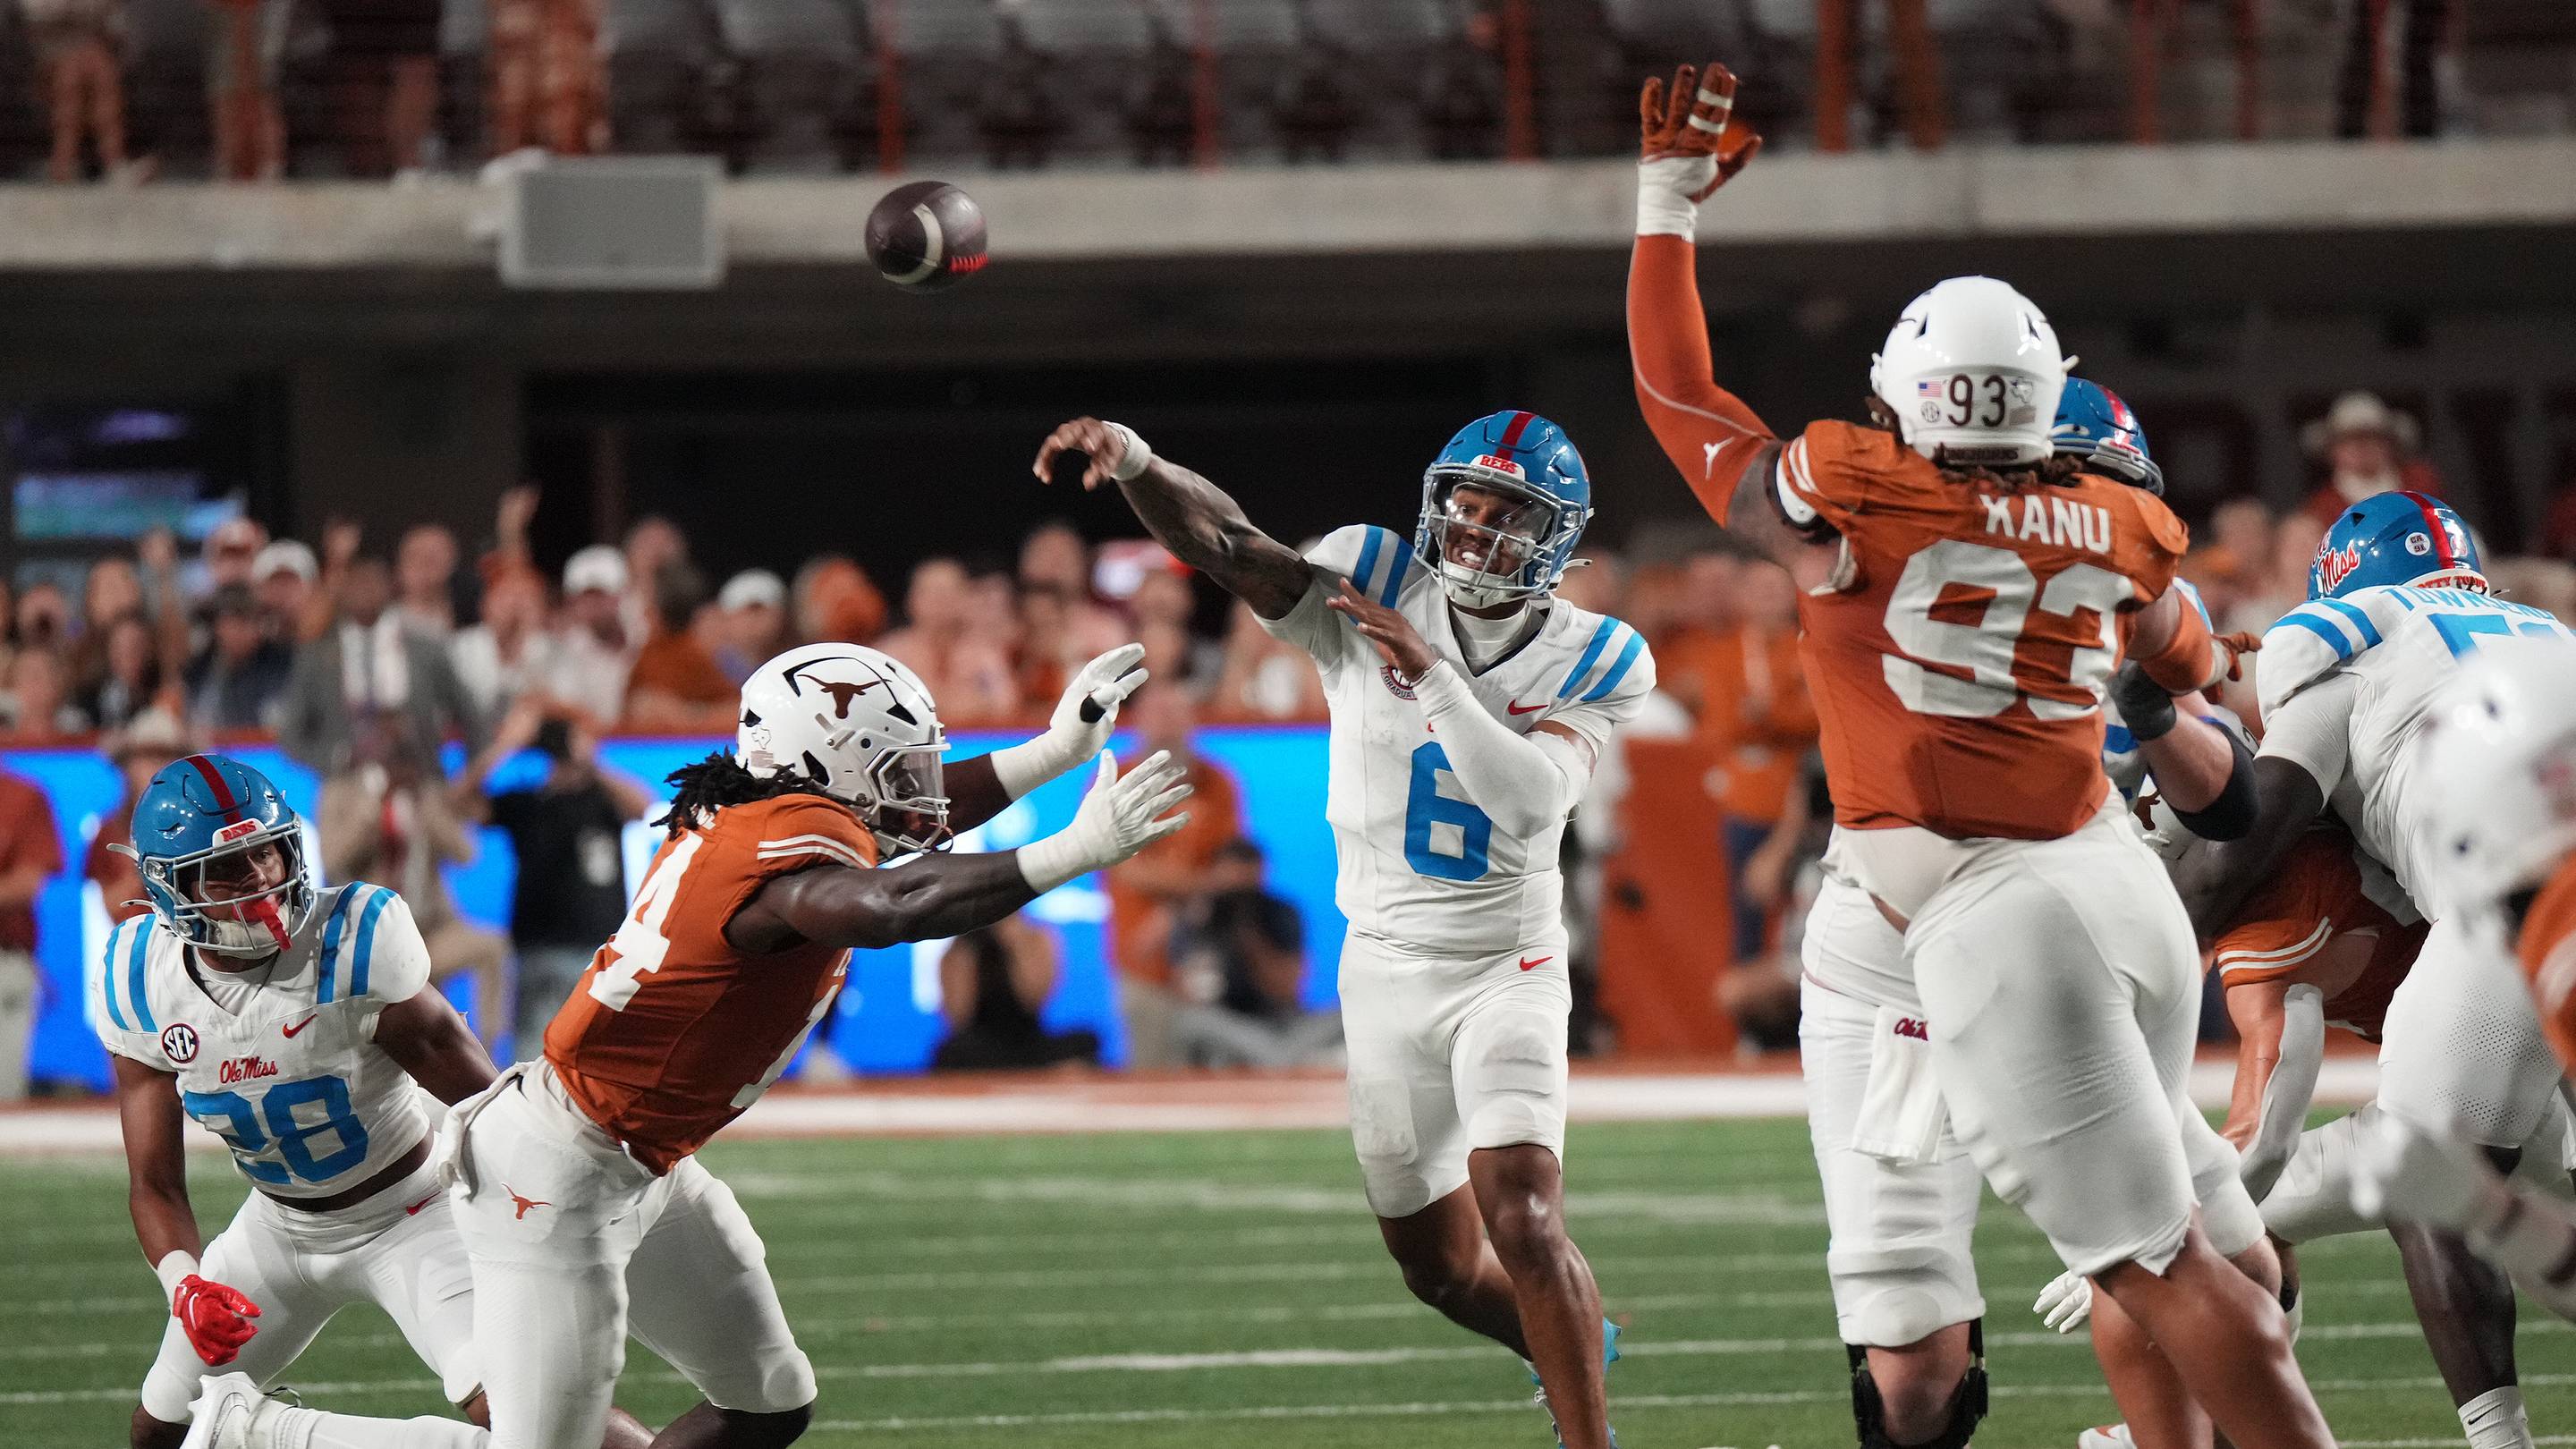
Ole Miss vs. Auburn: Beyond the Scoreboard, Rebels Seek Redempti…

Auburn's Ground Game Could Exploit Ole Miss's Rushing Defense in…
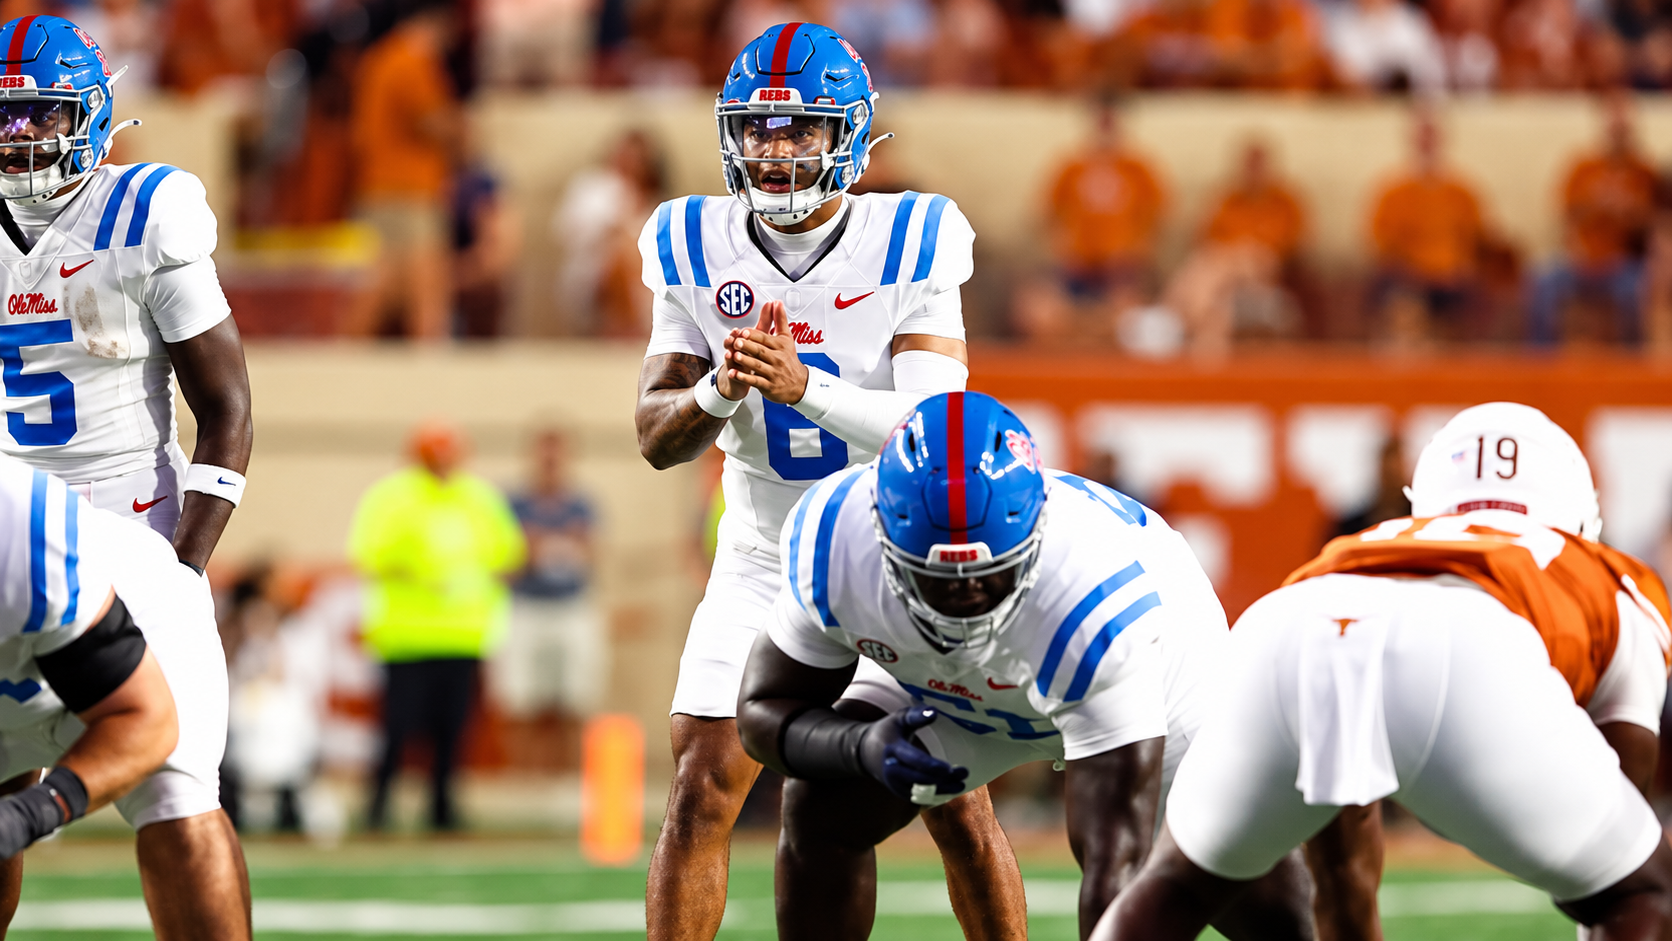
Ole Miss QB Trinidad Chambliss Rushing Less, But Is It By Design?
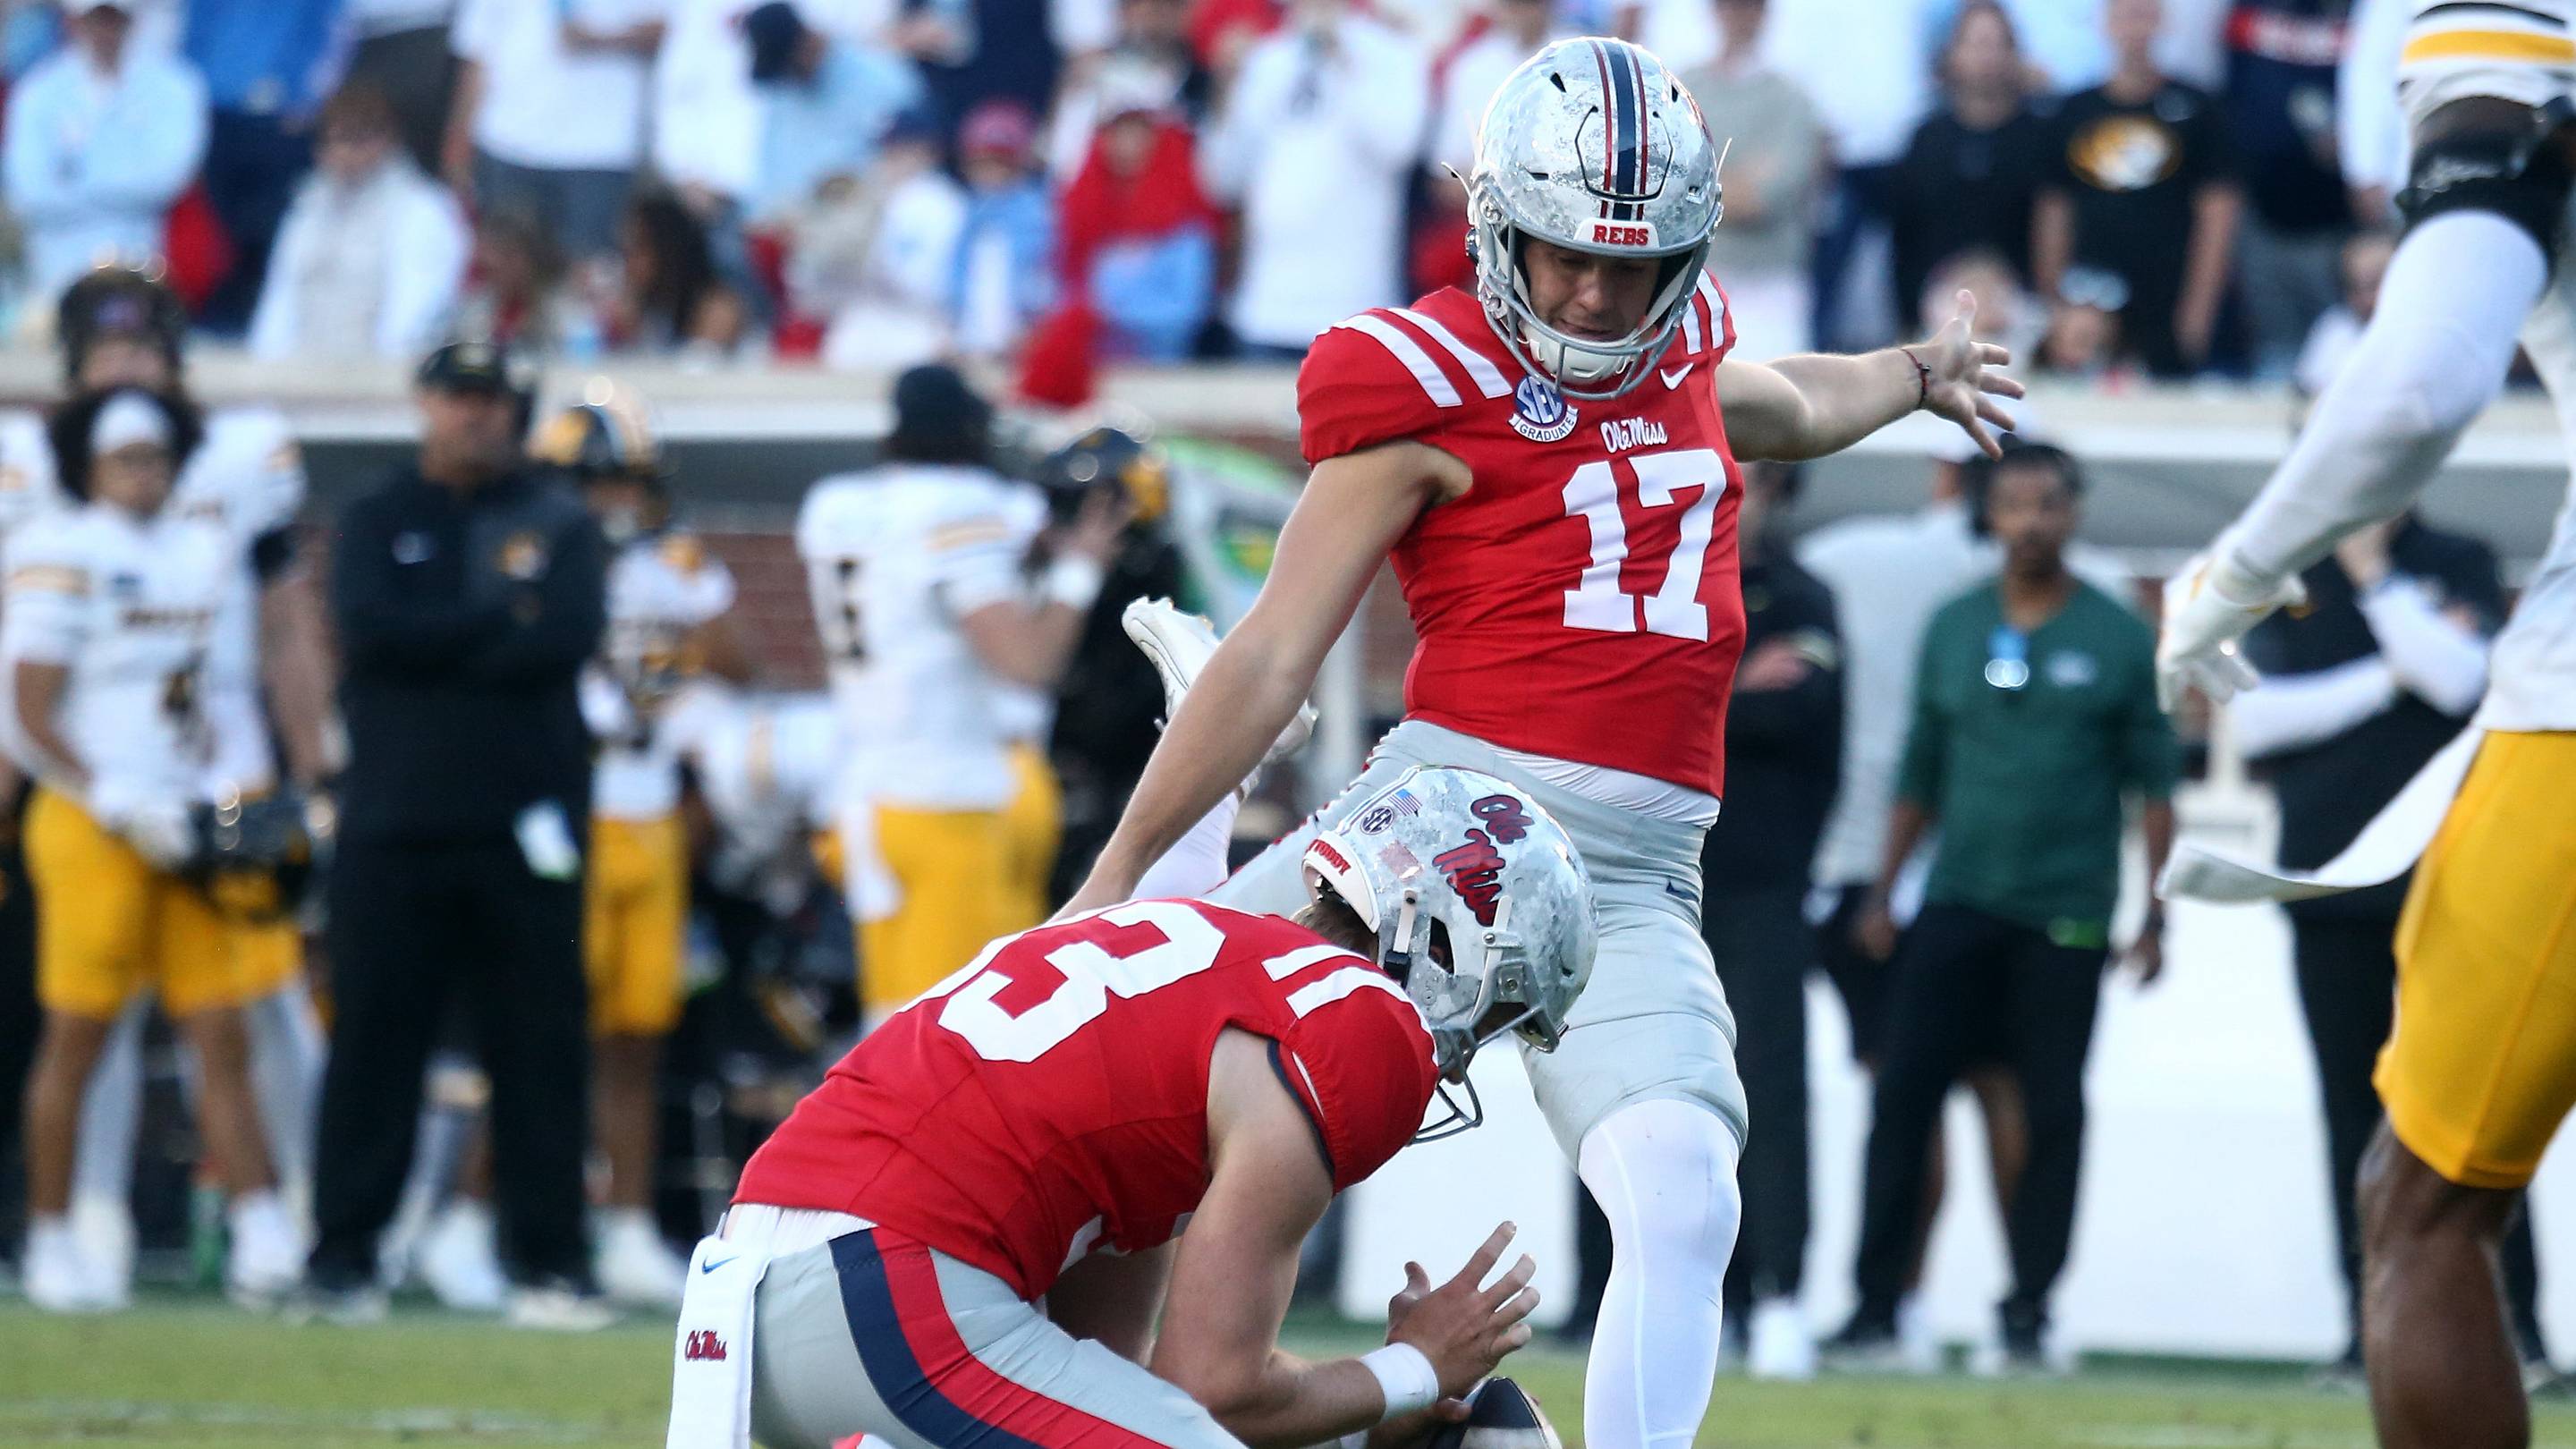
Ole Miss Falls Short Against Texas: Standout Performers and Key …