



CLEVELAND
BROWNSCLE
3-2 | Road
12


NEW YORK
JETSNYJ
2-3 | Home
17
Key Game

KEY GAME
Andre Szmyt
#25 | Place kicker@

KEY GAME
Austin McNamara
#14 | Punter| Player | |
|---|---|
| Andre Szmyt | None-None |
| Austin McNamara | None-None |
None-None
W-L
None-None
AI Model Win Probability
BROWNS
48%
JETS
52%
▲ Edge: +2.80% (CLE)
BROWNS
46%
Book Odds: +120
JETS
59%
Book Odds: -142
AI Model Projected Total
AI Projection
43.0
Projected
Book Total
38.5
Over / Under Line
▲
Edge: +4.5 (Over)
Over 38.5
64%
Under 38.5
36%
AI Model Spread Expectation
AI Spread Proj
-3.0
NEW YORK
Book Spread
-2.5
Book Line
▲ Edge: +0.5 points (New York)
Spread Distribution
AI Model
+42+28+140-14-28-42
Distribution centered around NYJ -3.0 expected margin.
Margin of Victory (NYJ)
CLE By 1-6 points
15.3%
CLE By 7-13 points
12.9%
NYJ By 1-6 points
17.0%
NYJ By 7-13 points
17.5%
AI Model Projected Score
Cleveland
20
CLEVELAND
Book Implied: 18
New York
23
NEW YORK
Book Implied: 20.50
Simulated Score
Cleveland
18
CLEVELAND
Book Implied: 18
New York
21
NEW YORK
Book Implied: 20.50
Projections Grades
Moneyline (ML)
Agreement
AI
Jets
Win
52% Win Prob
D
Sim
Jets
Win
61% Win Prob
C
Point Spread (ATS)
Agreement
AI
Jets (-2.5)
Win
Proj Spread: -3.0
D
Sim
Jets (-2.5)
Win
Proj Spread: -3.0
D
Over/Under (Total)
Agreement
AI
o38.5
Loss
Proj Total: 43.0
B
Sim
o38.5
Loss
Proj Total: 39.0
D
Head-to-Head History
Date
Game
Score
Oct 11, 2026
CLE @ NYJ
12 - 17
Nov 9, 2025
CLE @ NYJ
20 - 27
Dec 28, 2023
NYJ @ CLE
20 - 37
Sep 18, 2022
NYJ @ CLE
31 - 30
Dec 27, 2020
CLE @ NYJ
16 - 23
Key Model Drivers
Turnovers (L5)
+69.0% more
Cleveland: 1.4
vs
New York: 0.4
Rushing Yards (L5)
+24.1% more
Cleveland: 102.3
vs
New York: 77.6
Total Yards (L5)
+16.5% more
Cleveland: 296.8
vs
New York: 247.7
First Downs (L5)
+15.5% more
Cleveland: 17.4
vs
New York: 14.7
Post-Mortem Analysis
Metric
Projected
Actual
Score Game
CLE Score
20.0
12
NYJ Score
23.0
17
Team Stats Splits (Home / Away)
First Downs
14.7 / 17.4
14.0 / 13.0
Net Passing Yards
170.2 / 194.5
142.0 / 102.0
Rushing Yards
77.6 / 102.3
134.0 / 96.0
Third Down Efficiency
0.3 / 0.4
0.47 / 0.25
Time of Possession
0.4 / 0.5
0.52 / 0.48
Total Yards
247.7 / 296.8
276.0 / 198.0
Turnovers
0.4 / 1.4
2.0 / 2.0
Yards Per Play
4.8 / 5.1
4.2 / 3.0
Public Market Splits
Moneyline
Open: +110 / -130
→
+120 / -142
↑
Spread (ATS)
Open: +1.5 / -1.5
→
+2.5 / -2.5
↑
Total (O/U)
Open: 39.5
→
38.5
↓
Situational Trends
📊 Win-Loss
CLE
Advantage
6-4-0
(60.0%)
Margin: -3.2
ATS +/-: +0.5
NYJ
2-8-0
(20.0%)
Margin: -6.0
ATS +/-: -2.7
🎯 ATS (Spread)
CLE
Advantage
7-3-0
(70.0%)
Margin: -3.2
ATS +/-: +0.5
NYJ
4-5-1
(44.4%)
Margin: -6.0
ATS +/-: -2.7
⚖️ Over/Under
CLE
6-4-0
O: 60.0% / U: 40.0%
Total +/-: +0.8
NYJ
4-6-0
O: 40.0% / U: 60.0%
Total +/-: +0.6
Season to Date Model Accuracy
AI Model
SIM Engine
NYJ
CLE
NYJ
CLE
ML
70%
7-3
40%
4-6
70%
7-3
60%
6-4
ATS
56%
5-4-1
40%
4-6
44%
4-5-1
60%
6-4
TTL
40%
4-6
60%
6-4
40%
4-6
40%
4-6
Contextual Game News
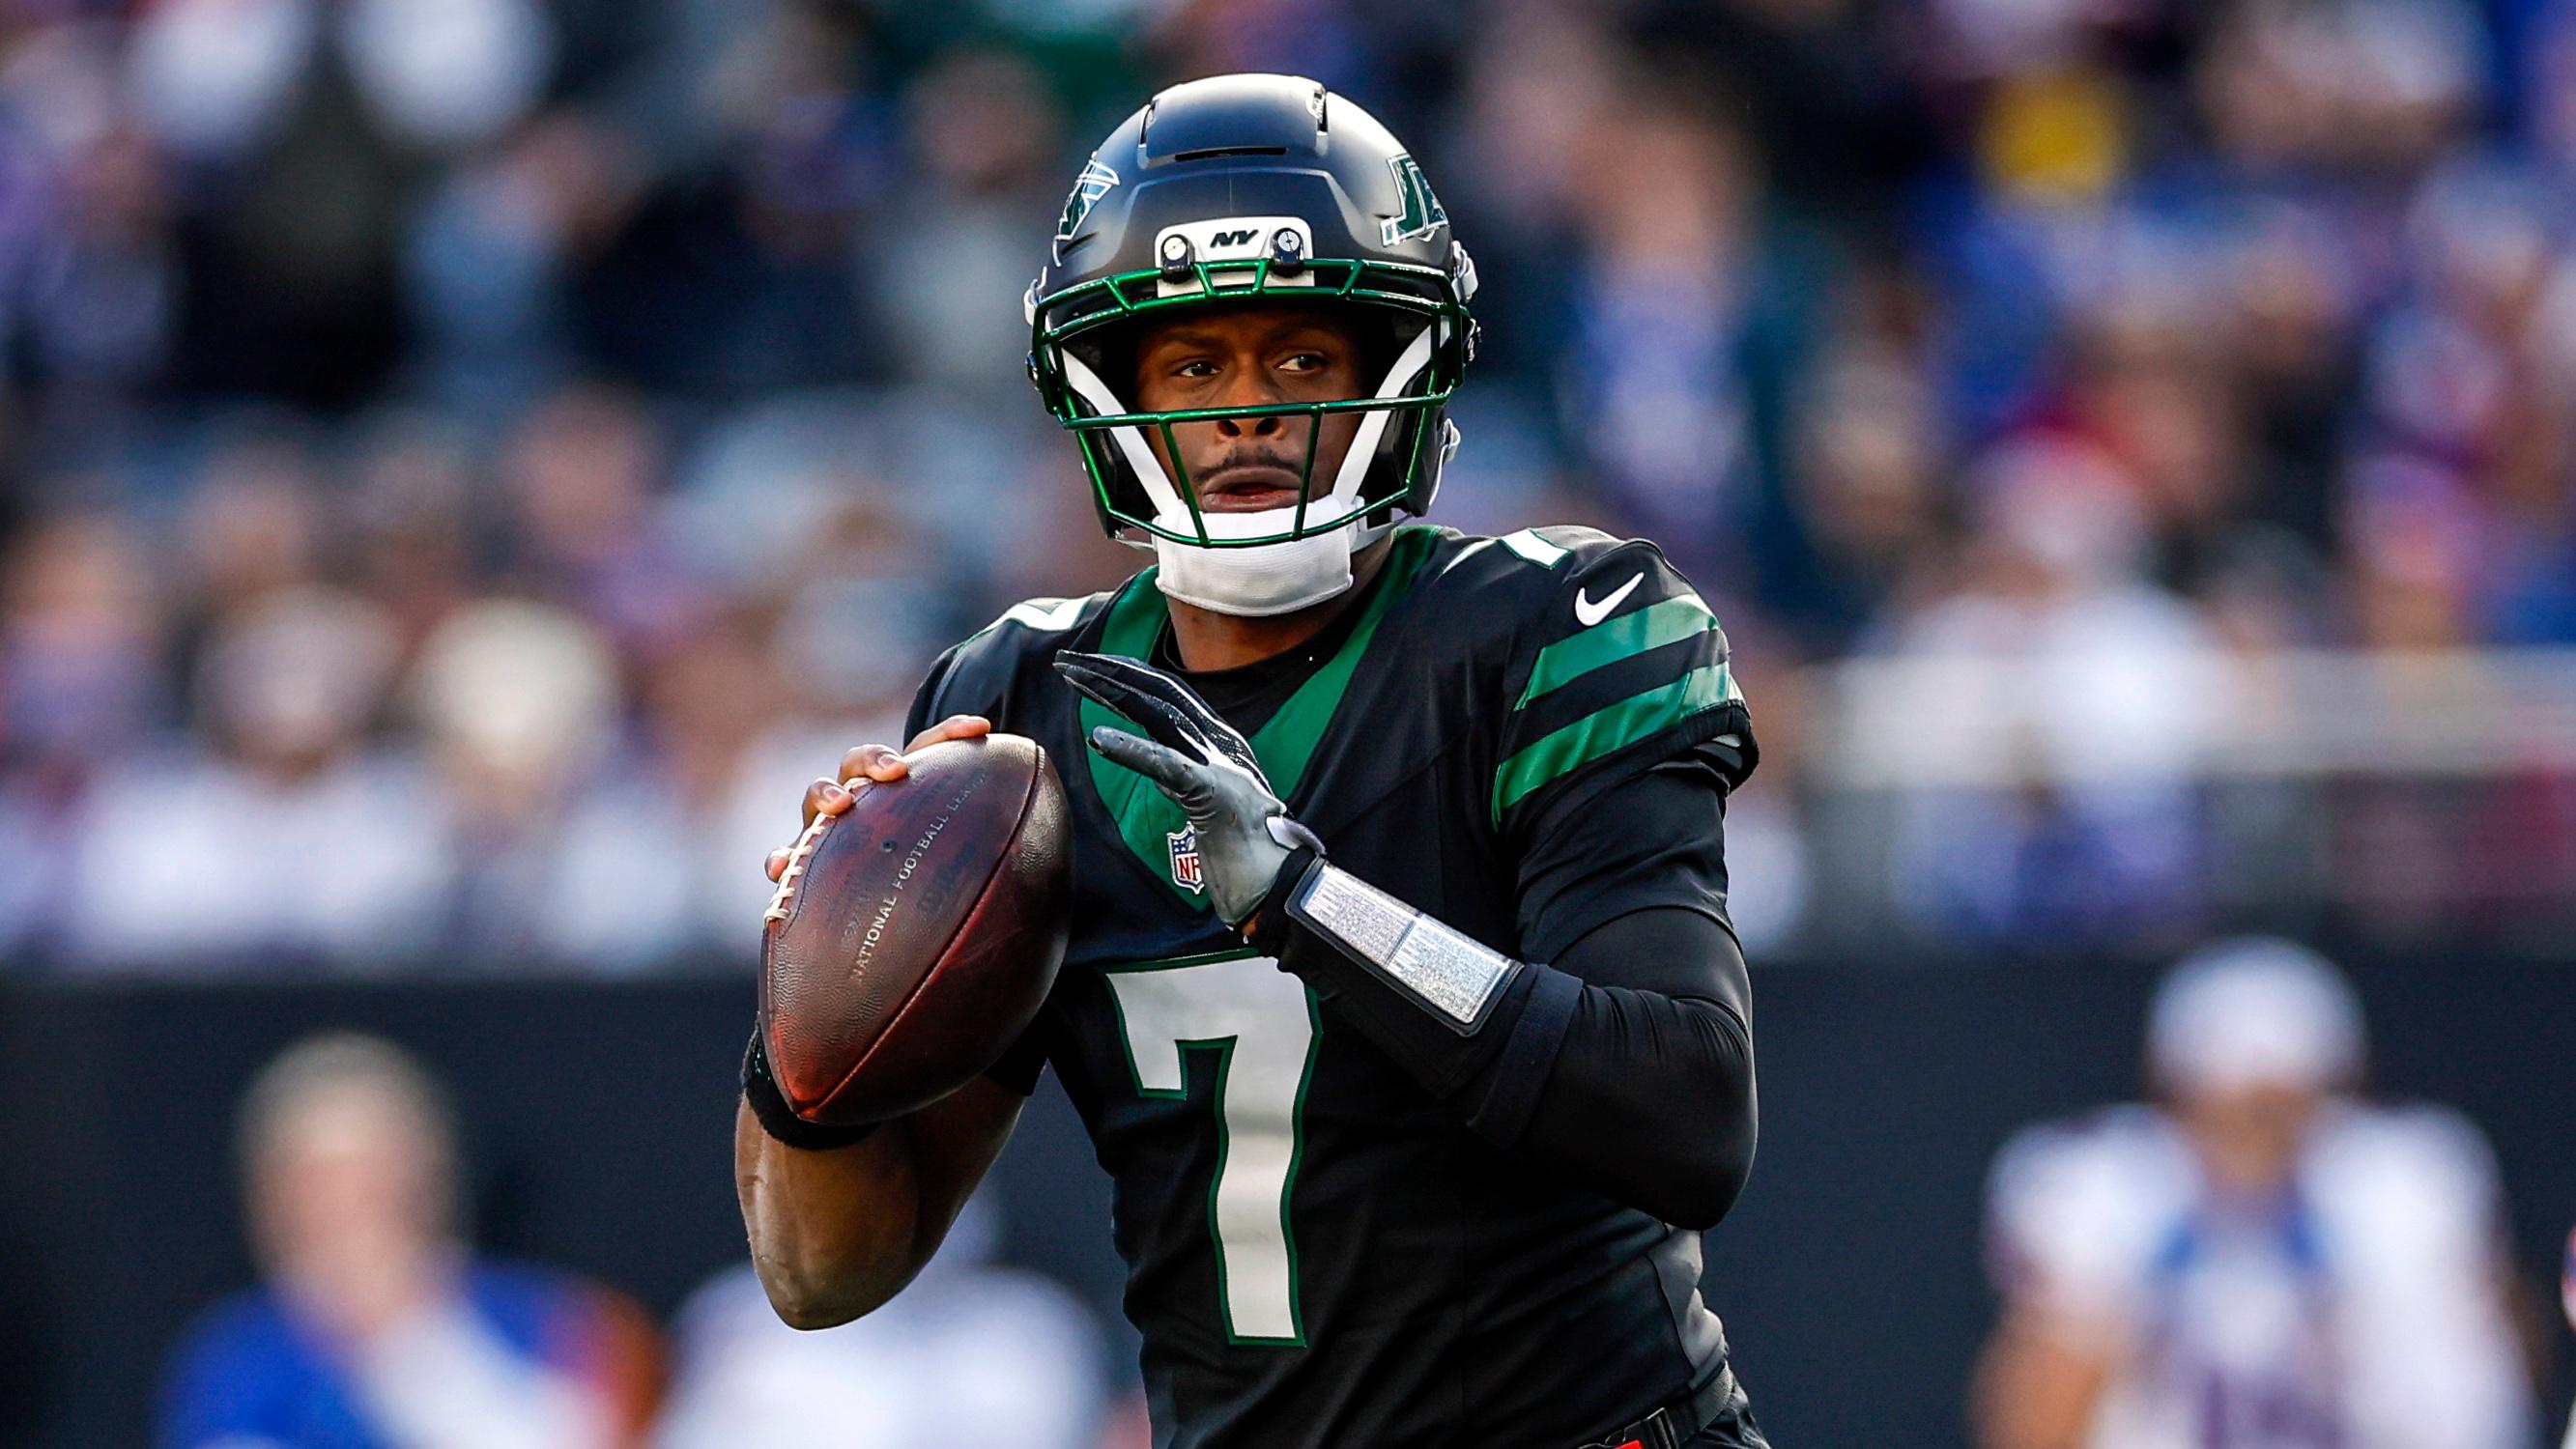
Jets' Geno Smith Limited in Practice, Ankle Injury Not Major
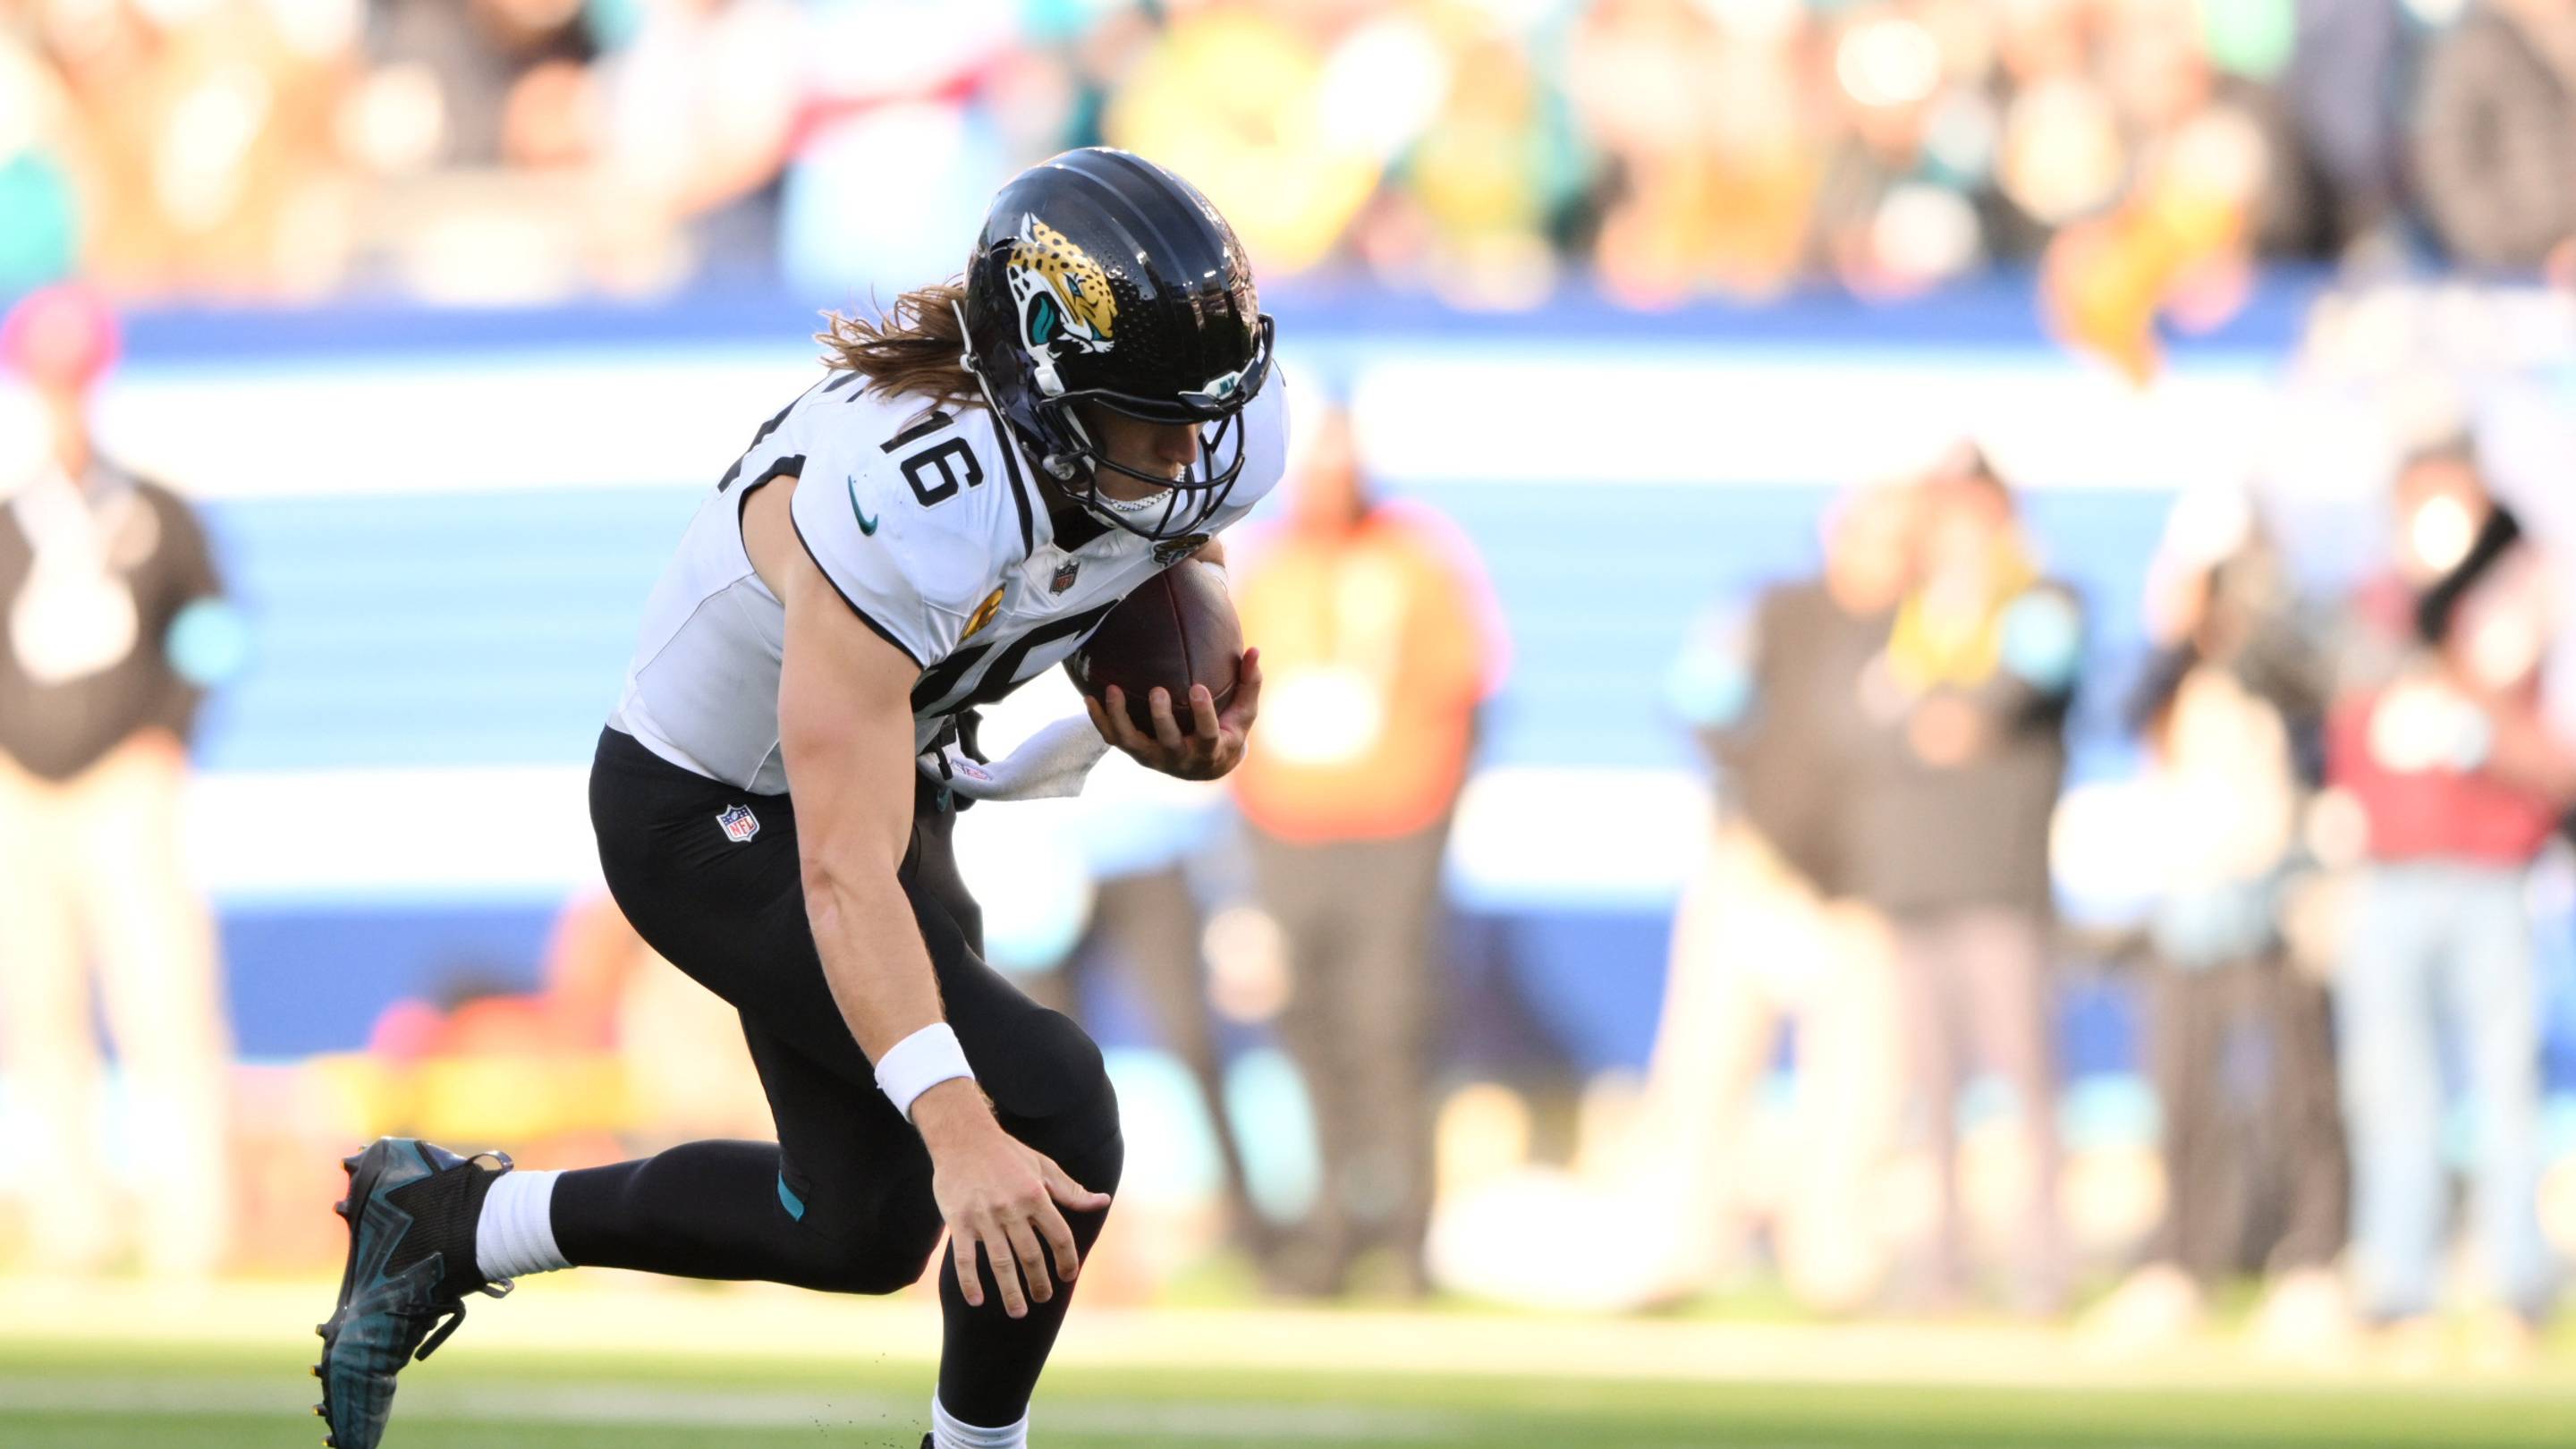
Giants' Path to Upsetting Jaguars: Exposing Trevor Lawrence's Hi…
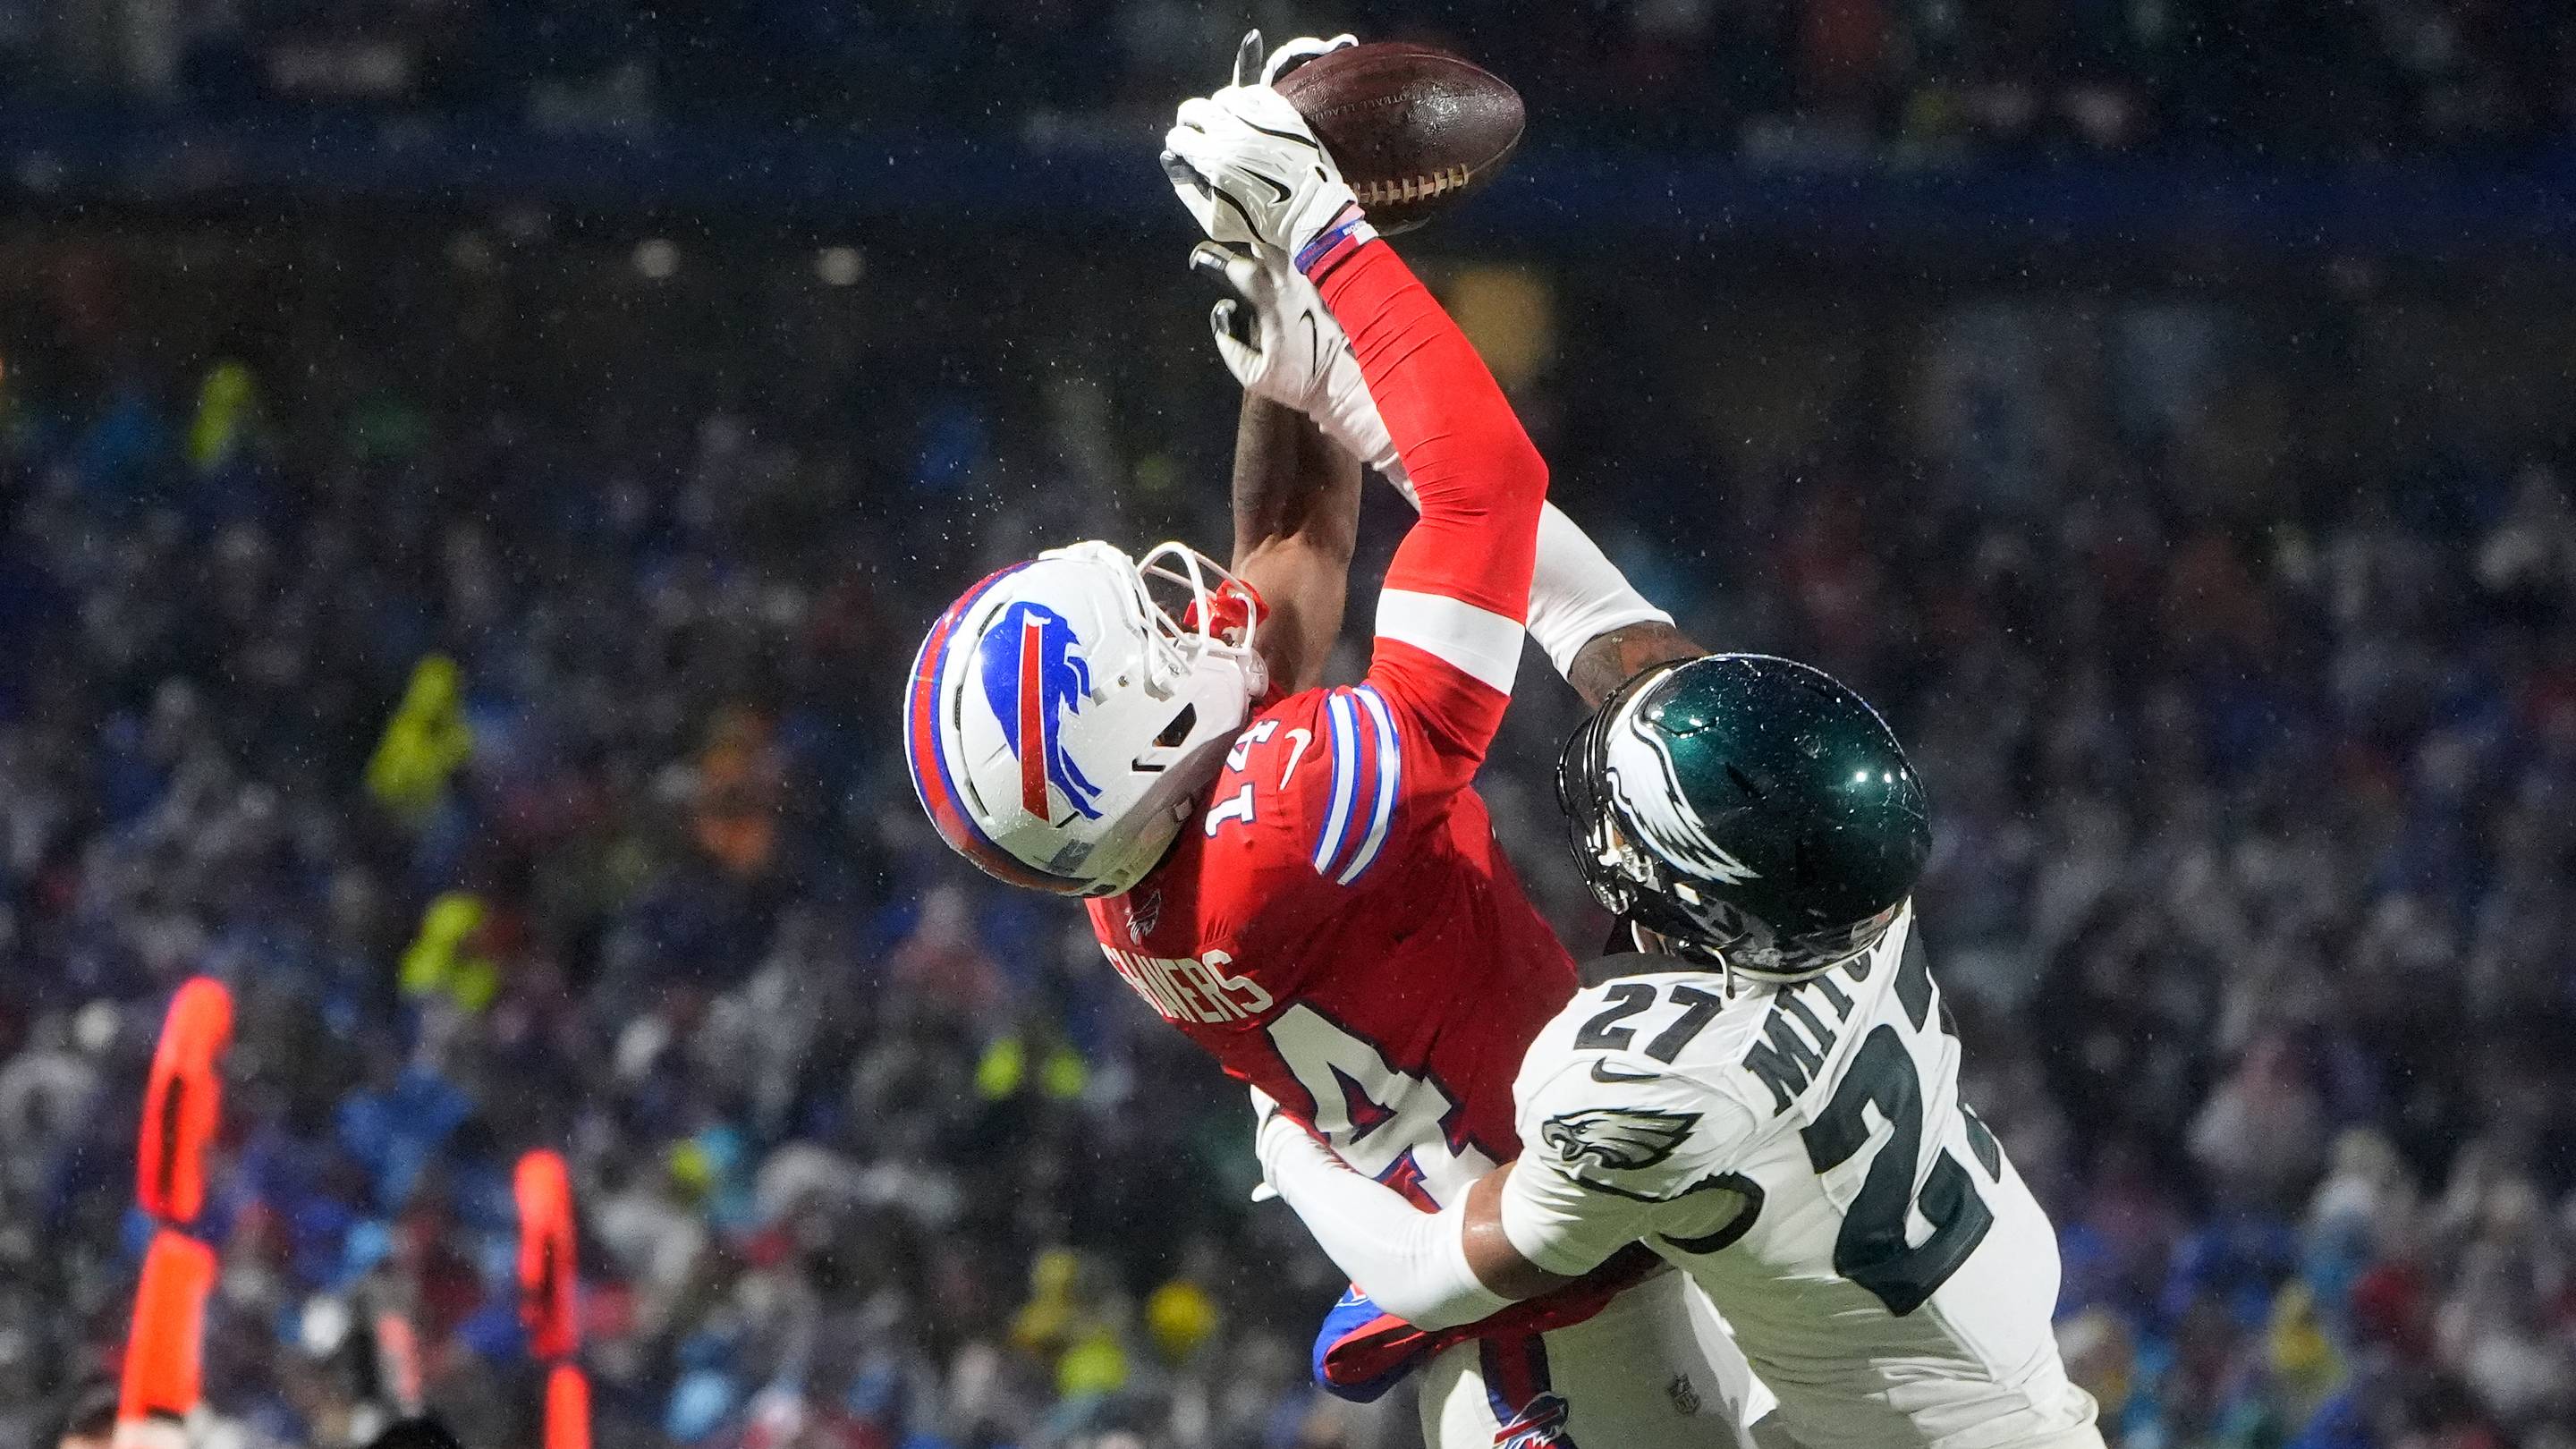
Buffalo Bills Clear Roster Space for Tyrell Shavers by Placing R…

Browns Eye SEC Defensive Duo in Early 2027 NFL Mock Draft

Giants Host Former Commanders Lead Back Antonio Gibson for Worko…