


USC
USCUSC
6-1 | Road
31

PENN STATE
PENN STATEPSU
3-3 | Home
23
Key Game

KEY GAME
Lachlan Carrigan
#35 | Punter@

KEY GAME
Ryan Barker
#94 | Place kicker| Player | |
|---|---|
| Lachlan Carrigan | None-None |
| Ryan Barker | None-None |
None-None
W-L
None-None
AI Model Win Probability
USC
59%
PENN STATE
41%
▲ Edge: +5.80% (USC)
USC
54%
Book Odds: -115
PENN STATE
51%
Book Odds: -105
AI Model Projected Total
AI Projection
54.0
Projected
Book Total
54.5
Over / Under Line
▼
Edge: +0.5 (Under)
Over 54.5
49%
Under 54.5
51%
AI Model Spread Expectation
AI Spread Proj
-4.0
USC
Book Spread
-1.5
Book Line
▲ Edge: +2.5 points (USC)
Spread Distribution
AI Model
-42-28-140+14+28+42
Distribution centered around USC -4.0 expected margin.
Margin of Victory (USC)
USC By 1-6 points
17.0%
USC By 7-13 points
18.0%
PSU By 1-6 points
14.7%
PSU By 7-13 points
12.1%
AI Model Projected Score
USC
29
USC
Book Implied: 28
Penn State
25
PENN STATE
Book Implied: 26.50
Simulated Score
USC
32
USC
Book Implied: 28
Penn State
31
PENN STATE
Book Implied: 26.50
Projections Grades
Moneyline (ML)
Agreement
AI
USC
Win
59% Win Prob
C
Sim
USC
Win
55% Win Prob
D
Point Spread (ATS)
Divergence
AI
USC (-1.5)
Win
Proj Spread: -4.0
C
Sim
Penn State (+1.5)
Loss
Proj Spread: +1.0
D
Over/Under (Total)
Divergence
AI
u54.5
Win
Proj Total: 54.0
D
Sim
o54.5
Loss
Proj Total: 63.0
A
Head-to-Head History
Date
Game
Score
Oct 10, 2026
USC @ PSU
31 - 23
Oct 12, 2024
PSU @ USC
33 - 30
Jan 2, 2017
USC @ PSU
52 - 49
Key Model Drivers
First Downs (L5)
+17.0% more
USC: 23.6
vs
Penn State: 19.6
Total Yards (L5)
+15.8% more
USC: 426.9
vs
Penn State: 359.7
Post-Mortem Analysis
Metric
Projected
Actual
Score Game
USC Score
29.0
31
PSU Score
25.0
23
Team Stats Splits (Home / Away)
First Downs
19.6 / 23.6
18.0 / 25.0
Rushing Yards
138.4 / 139.1
68.0 / 129.0
Third Down Efficiency
0.4 / 0.4
0.17 / 0.45
Time of Possession
0.5 / 0.5
0.5 / 0.5
Total Yards
359.7 / 426.9
357.0 / 430.0
Turnovers
0.9 / 1.0
1.0 / 0.0
Public Market Splits
Moneyline
Open: -108 / -108
→
-115 / -105
↓
Spread (ATS)
Open: +1 / -1
→
-1.5 / +1.5
↓
Total (O/U)
Open: 56
→
54.5
↓
Situational Trends
📊 Win-Loss
USC
Advantage
6-2-0
(75.0%)
Margin: 7.8
ATS +/-: -7.0
PSU
3-4-0
(42.9%)
Margin: 9.9
ATS +/-: -3.3
🎯 ATS (Spread)
USC
2-6-0
(25.0%)
Margin: 7.8
ATS +/-: -7.0
PSU
Advantage
3-4-0
(42.9%)
Margin: 9.9
ATS +/-: -3.3
⚖️ Over/Under
USC
4-4-0
O: 50.0% / U: 50.0%
Total +/-: +1.0
PSU
3-4-0
O: 42.9% / U: 57.1%
Total +/-: -0.9
Season to Date Model Accuracy
AI Model
SIM Engine
PSU
USC
PSU
USC
ML
71%
5-2
88%
7-1
57%
4-3
75%
6-2
ATS
43%
3-4
62%
5-3
29%
2-5
50%
4-4
TTL
71%
5-2
50%
4-4
43%
3-4
38%
3-5
Contextual Game News

Lincoln Riley Shuts Down USC Exit Talk: 'This Is Where I Want to…

Lincoln Riley Shuts Down Doubts, Declares He's the Right Man for…

Dante Moore's Season-Ending Injury Shakes Up 2027 NFL Draft Outl…

LaVar Arrington Launches Penn State Alumni Podcast While Expandi…
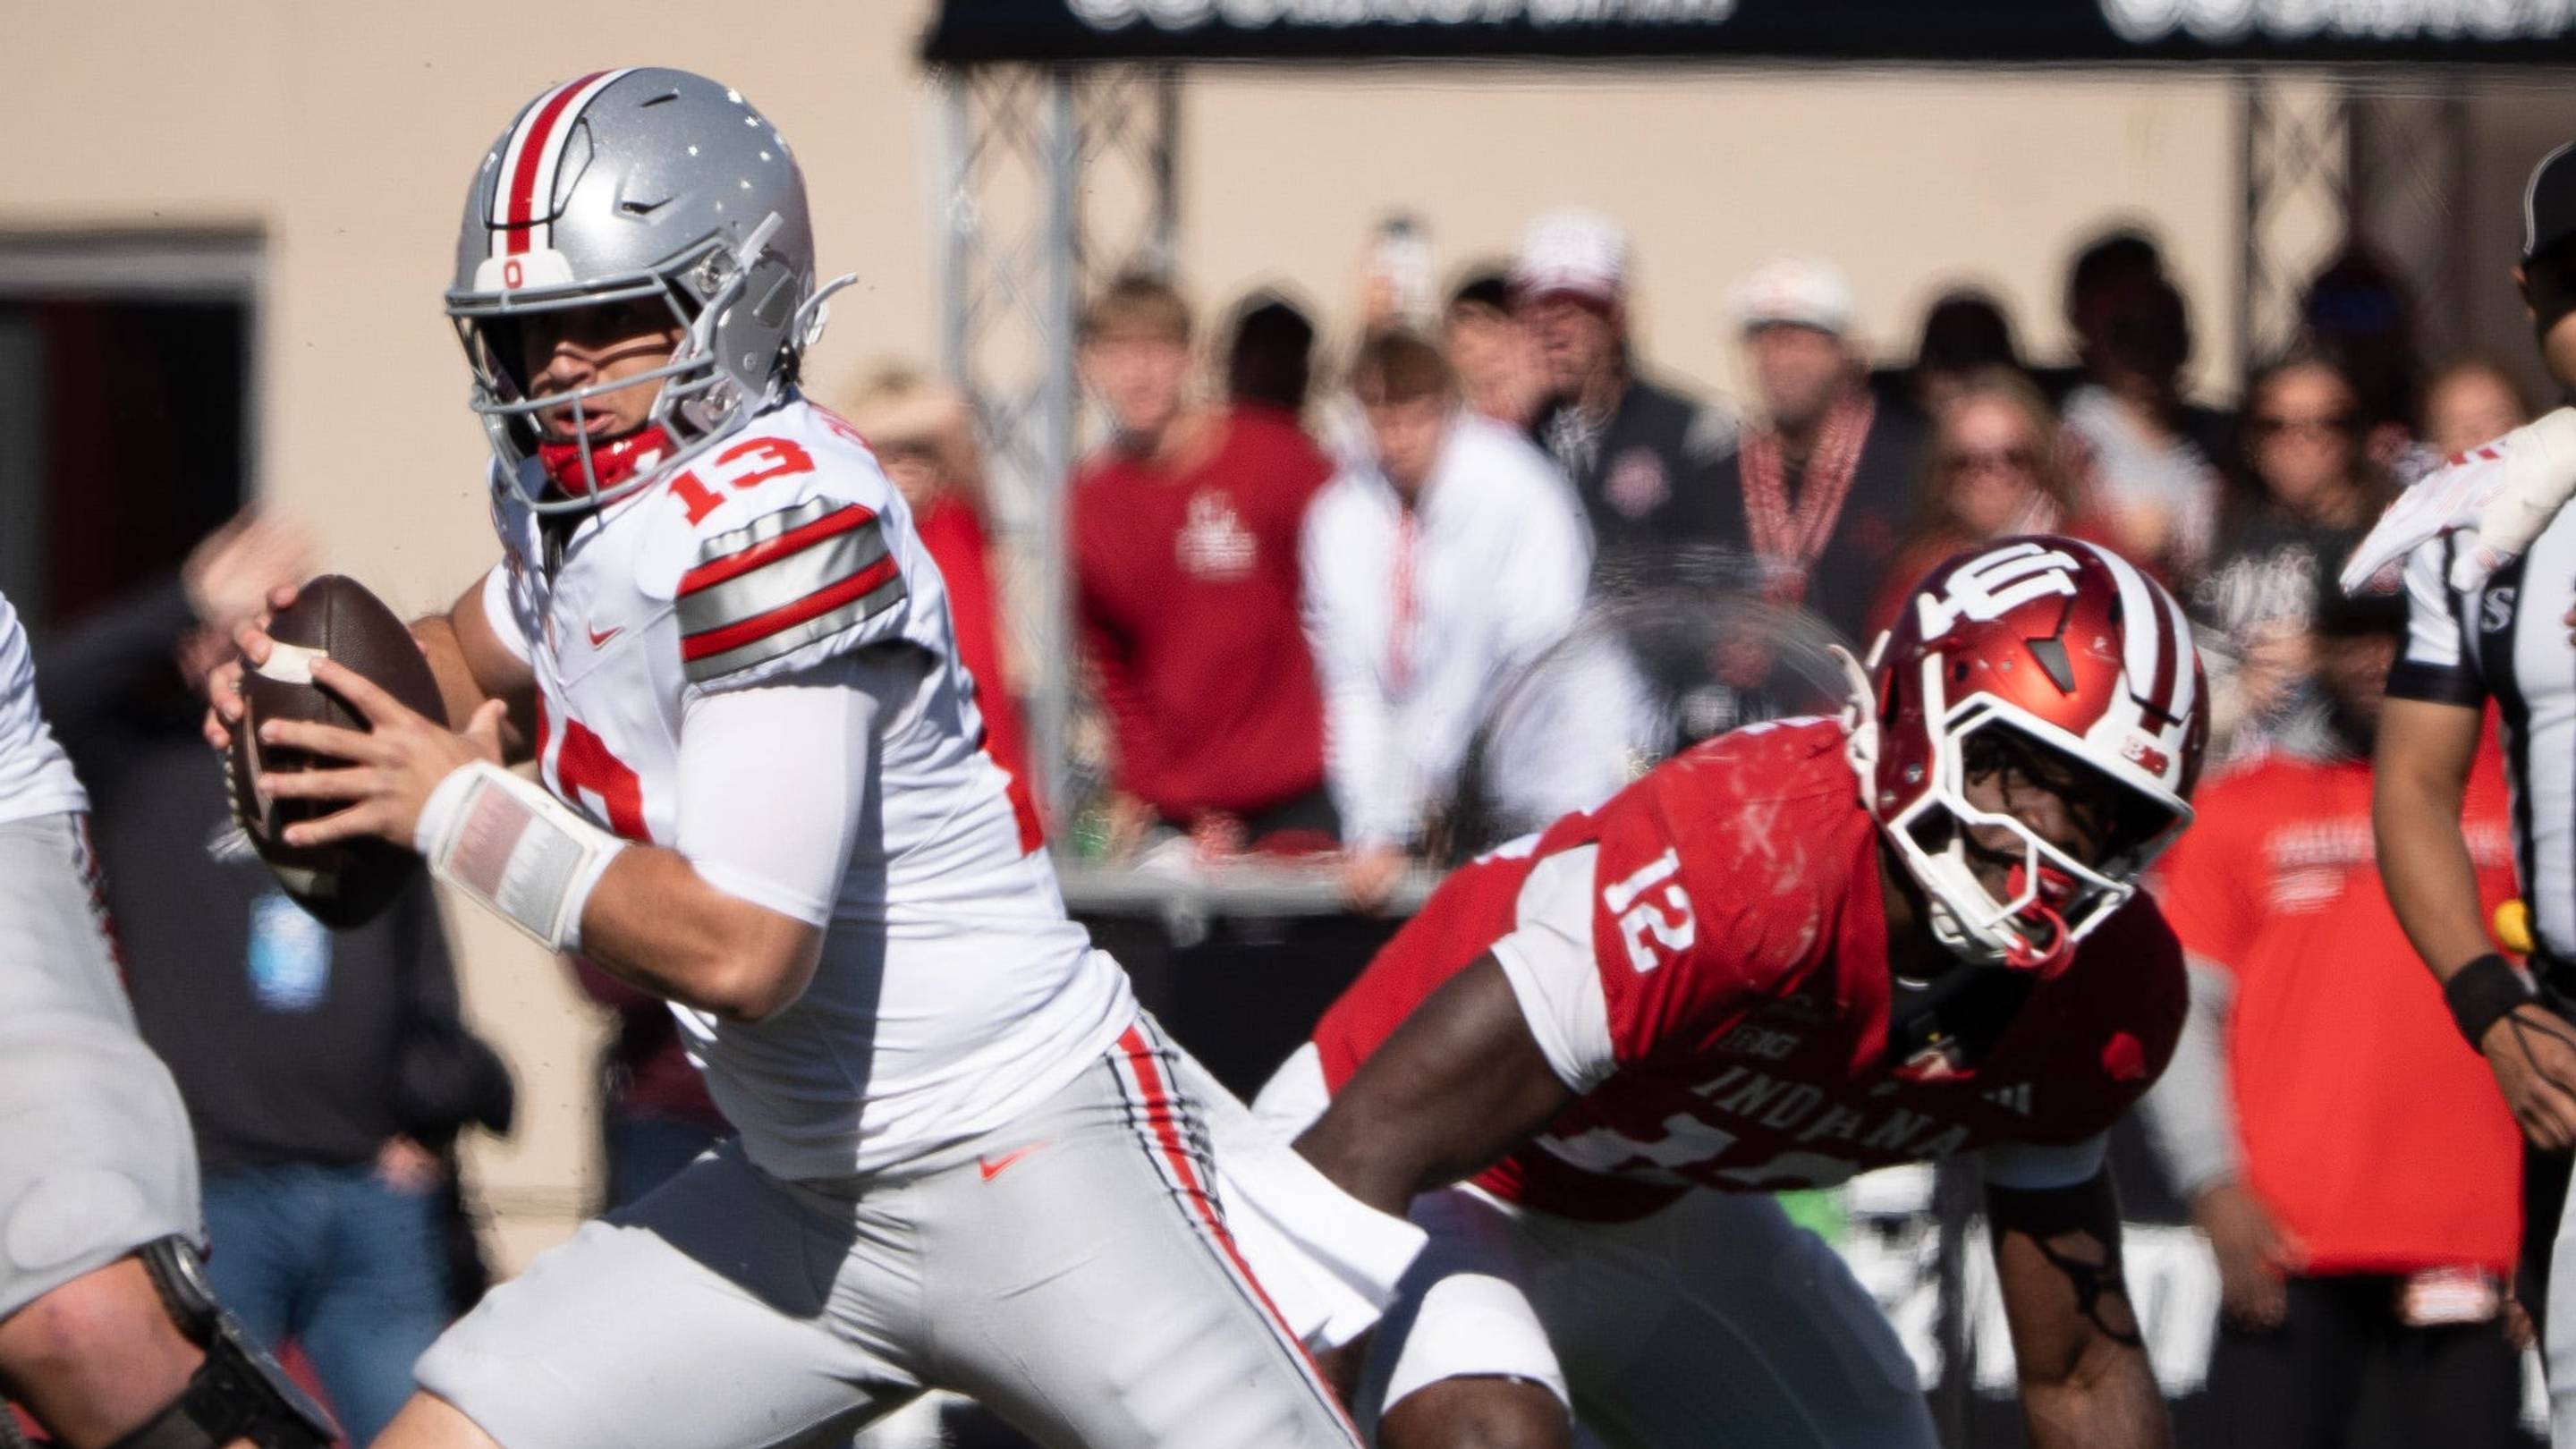
Halloween Showdown: Luke Fahey's Potential First Start As Ohio S…