Sports betting shouldn’t be guesswork. As a professional analyst who leans on AI every day, I’m obsessed with measurable edges, not hype. In this piece, I’ll show you how I vet models, track ROI and calibration, and turn data into disciplined wagers—step by step, with practical tools and clear, repeatable workflows.
Table Of Contents
- What “best” actually means when there’s no obvious winner
- Definition and criteria for the best sports betting AI app in 2025
- Evaluation and testing workflow
- Features that separate leaders
- Where ATSwins fits in this landscape
- Responsible testing and play
- A practical, repeatable workflow you can adopt
- How to test calibration, fast
- Finding the right markets for your edge
- Practical templates you can copy
- Common pitfalls and how to avoid them
- What good explainability looks like in betting models
- Injury and news pipelines that actually help
- Data drift and retraining cadence
- Scaling beyond the first league
- Using splits and public action wisely
- How to judge latency and alert quality
- The security and privacy basics you should expect
- A final operational snapshot you can copy today
- Conclusion
- Frequently Asked Questions (FAQs)
Key Takeaways
- Judge any betting app by numbers first: ROI after vig, CLV vs the close, and probability calibration; hype doesn’t pay
- Test safer: paper bet 100–300 plays, log your odds and the closing line, compute EV; start flat stakes then small Kelly only if the edge holds
- Speed and data win edges—fast odds updates, props depth, injury news and alerts; slow latency turns value into noise
- Protect the bankroll: clear unit size, daily loss caps, avoid chasing; watch correlation and pause after big swings
- At ATSwins.ai, we run an AI-powered sports prediction platform offering data-driven picks, player props, betting splits, and profit tracking across NFL, NBA, MLB, NHL & NCAA; free and paid plans give bettors insights and guides to make smarter, more informed decisions
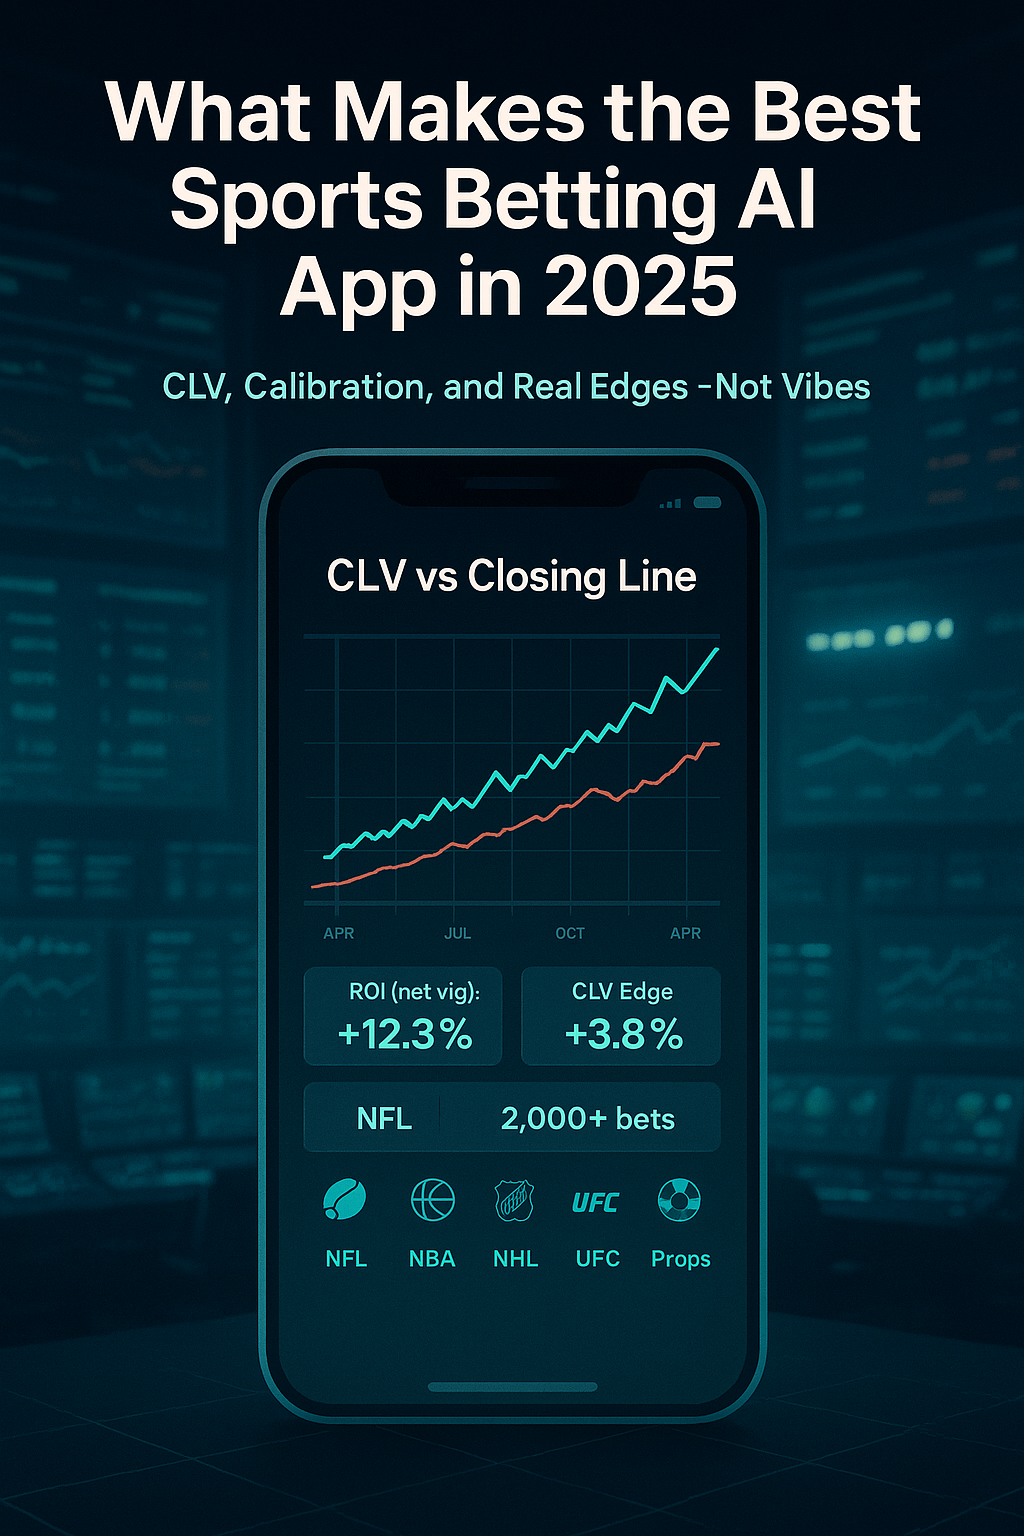
What Makes the Best Sports Betting AI App in 2025
What “best” actually means when there’s no obvious winner
When a search returns no single “best” sports betting AI app, treat “best” as a measurable edge. Not vibes. The top apps in 2025 stand out because they help you win closing line value, stay calibrated, act fast, and scale responsibly. In practice, that means you can measure and verify:
- Return on investment (ROI) after the vig, not before
- Consistent CLV vs the market’s closing line
- Good calibration: probabilities match reality over time
- Enough sample size to matter
- Low latency from odds change to alert to bet placed
- Broad market coverage (major leagues, props, and ideally in-play)
- Transparent modeling choices and model versioning
- Responsible play features and compliance basics
If you can’t quantify those, you can’t call an app “best.” You can call it interesting. That’s different.
Definition and criteria for the best sports betting AI app in 2025
Start with hard criteria you can test. Then add operational features that let you execute.
- ROI net of vig and limits
- CLV vs closing line across markets (spreads, totals, moneylines, props)
- Calibration and error: Brier score or log loss trends
- Sample size: enough bets to reduce variance
- Latency: time from odds update to bet notification
- Coverage: pre-game and in-play where possible, plus props breadth
- Stability: edges hold up over multiple seasons and out-of-sample splits
- Model transparency: explainability, feature importances, documentation
- Responsible gambling controls: limits, cool‑offs, exclusion options
- Security and privacy: sensible defaults, clear data handling
- Support and uptime SLAs
- Exportable logs, APIs, and audit trails
Evaluation and testing workflow
I test every betting AI app the same way. Paper first. Real money later. And even then, slow. The process is repeatable and boring on purpose, because boredom is how you avoid overfitting to one hot month.
Stage 1: Paper test your picks (step-by-step)
1) Create a pick log
- Fields: date, sport, league, game ID, market (spread/total/ML/prop), team or player, odds at pick time, book, stake, model probability, fair odds, EV at pick time, timestamp, bet ID.
- Add closing odds, closing timestamp, grade (win/loss/push), and payout after result.
2) Track CLV and EV
- For each pick, compute the difference between your odds and the closing odds (converted to implied probabilities).
- Keep both absolute and standardized CLV (e.g., pennies vs spread).
- For expected value, EV = (pwin × profitifwin − (1 − pwin) × lossiflose).
3) Compute calibration
- Bucket predictions (e.g., 50–55%, 55–60%, etc.).
- Compare predicted vs actual outcomes per bucket.
- Use reliability plots and Brier score; a well‑calibrated model has buckets near the 45-degree line.
4) Snapshot latency
- Store timestamps when the app: ingests odds, sends alert, you tap bet, and the book confirms.
- If books move before you confirm, your edge shrinks. Quantify the slippage.
5) Keep bankroll separate
- Use a virtual bankroll with your real unit size.
- No real wagers yet. Two to four weeks minimum. Longer if the slate is thin.
Stage 2: Backtesting correctly
- Use multiple seasons with time-based splits (e.g., train through 2022, validate on 2023, test on 2024).
- Avoid lookahead bias (e.g., no using closing lines to simulate bet timing).
- Reflect live realities: model latency, bet windows, limits, partial fills.
- Cross-validate hyperparameters on stale data only; lock the model before you test the most recent season.
- Rerun with different holdout windows to check stability.
- If a version change happened mid-season, treat pre-change and post-change separately.
Stage 3: Bet sizing and bankroll tracking
There’s no “one” right sizing method. The choice depends on your edge reliability, limits, and tolerance for drawdowns.
- Flat stake: simple, stable, easy to audit. Use for early testing.
- Kelly (fractional): optimizes long-term growth if your edge and probabilities are accurate. Use fractional (e.g., 0.25–0.5 Kelly) to reduce volatility.
- Unit caps: to handle lower-confidence markets like long-tail props.
Track: bankroll value, rolling 100‑bet ROI, max drawdown, exposure by sport and book, and average closing line edge.
Stage 4: Live A/B and monitoring
- A/B test model versions: A vs B picks on similar market tiers; hold to a clear randomization rule.
- Monitor feature drift: player roles, injuries, rotations, weather regimes; data distributions change.
- Retrain cadence: weekly for props-heavy models, biweekly or monthly for sides/totals.
- Alert performance: latency, delivery failure rate, noise ratio (alerts without bets placed).
- Model health dashboard: CLV trend, calibration trend, ROI trend, and recent limit hit rates.
Stage 5: Reality checks—vig, limits, and execution
- Verify edge net of the vig: EV must be positive after juice and potential price movement.
- Limits: some props or smaller markets cap stake. Adjust unit sizing by market depth.
- Slippage: measure how often a price is gone in 15–60 seconds. If too often, your real EV is lower than the paper EV.
- Market breadth: if an app shines only in small props that you can’t scale, it’s not “best” for most users.
- Compliance and jurisdiction: don’t test markets you can’t legally bet. Keep your audits clean.
Features that separate leaders
Engineered edges and execution features are both vital. The best apps bring both.
- Real-time odds ingestion and alerting
- Fast feed from multiple books - Smart throttling to avoid alert fatigue
- Configurable bet sizing and bankroll logic
- Flat stake, fractional Kelly, confidence tiers - Per-market caps and stop-loss options
- Explainability
- Feature importances, SHAP-style summaries - Rationale for a pick: injury, pace, weather, splits, matchup
- Scenario simulations
- “What if” tools for injuries, tempo, minutes, weather - Sensitivity to key inputs
- Custom model inputs
- Let advanced users include their own projections or weights - Blend your models with the platform’s
- Injury and news pipelines
- Verified sources, time-stamped updates - Impact scores that flow into projections
- APIs and export logs
- Full pick logs, market snapshots, version IDs - Webhooks for automated tracking
- Uptime and support SLAs
- Transparency during outages - Support that answers with data, not scripts
- Privacy and security basics
- Clear data retention policy - 2FA and least-privilege access for account internals
- Responsible gambling tools
- Deposit limits, session timeouts, cool-offs - Links to education and counseling resources - Soft nudge prompts when patterns indicate risk
Where ATSwins fits in this landscape
ATSwins positions itself as an AI-powered sports prediction platform with data-driven picks, player props, betting splits, and profit tracking across NFL, NBA, MLB, NHL, and NCAA. It offers free and paid plans, plus education for smarter decisions. That aligns with the core features bettors ask for: model-driven selections, breadth across major leagues, props coverage, and tools to track outcomes.
From a testing standpoint, the same workflow applies:
- Use the app’s picks and profit tracking to seed your pick log.
- Compare ATSwins probabilities (or confidence tiers) with your own fair odds and market prices at pick time.
- Record closing lines to compute CLV.
- Track ROI across sides, totals, and props separately.
- Check if props edges hold after accounting for limits.
- Evaluate latency from alert to bet. If you’re consistently late by 1–2 minutes, simulate slippage in your EV.
ATSwins’ betting splits can help frame market sentiment—useful when you want to avoid crowded sides that move quickly. For players who like to learn by doing, the free tier is helpful for paper testing without committing funds. Paid tiers make more sense once you verify that CLV and calibration trends are positive for the markets you actually bet.
A simple testing plan with ATSwins (step-by-step)
1) Start with one sport
- Pick one league (say, NBA). Too many markets early creates fog.
- Paper test for two weeks minimum. Longer during low-volume periods.
2) Build your pick log schema
- Include: sport, market, pick, ATSwins odds or confidence (if presented), book odds at alert time, timestamp, your stake, EV, closing odds, result.
3) Monitor CLV
- Compare alert price vs close. Aim to beat close on a majority of sides/totals.
- For props, look at relative edge in implied probability; track how often your price gets worse before you bet.
4) Track ROI by slice
- Break out ROI by market type (spreads vs props), by line range (e.g., spreads ±3, ±7), and by team/player tiers.
- Keep a separate tab for outlier days to avoid overreacting to one-off swings.
5) Adjust sizing
- Start with flat stake. If CLV and calibration stabilize, move to fractional Kelly based on your estimated edge per pick type.
6) Post-mortems
- Weekly: review your largest CLV gains and losses. What drove them—injury news, pace, back-to-back fatigue?
- Retune alert filters or timing windows if you’re consistently late.
7) Scale cautiously
- Expand to a second league only when the first is stable.
- Caps on small props markets to avoid hitting limits and hurting execution.
Responsible testing and play
Trust and safety aren’t extras. They’re part of “best.”
- Data provenance and licensing
- Confirm the app licenses its data feeds and respects usage rights. - App should disclose sources at least at a high level.
- Jurisdictional compliance
- Sports betting laws differ by region. - KYC/AML may apply if the platform handles payments or wallets.
- Responsible gambling features
- Account-level limits (deposit, stake, session time). - Cooling-off and self-exclusion options. - Educational content and links to organizations such as the National Council on Problem Gambling.
- Disclose methodology and limits
- Apps should show how models work at a high level, where they’re strong, and where they struggle. - Avoid overpromising. No system beats every market all the time.
- Privacy and security
- Clear privacy policy, encryption in transit and at rest, 2FA. - Minimal data collection beyond what’s needed to run the product.
A practical, repeatable workflow you can adopt
Use this simple, slightly opinionated setup.
- Storage
- One master spreadsheet (or database) with pick logs; one sheet per week. - A second file for bankroll and risk metrics. Lock formulas.
- Analysis
- Colab notebook for calibration curves, rolling ROI, CLV histograms. - Experiment tracking with model version and app version tags; use a change log.
- Weekly operating rhythm
- Monday: publish last week’s CLV vs close; mark top 10 edges by magnitude. - Wednesday: model drift check; review injury/news pipeline performance. - Friday: promote or rollback model version based on A/B results.
- Versioning
- Whenever the model changes (features, weights, preprocessing), bump the version and freeze it for one full week to get clean comparisons.
- Risk controls
- Do not raise stake size after big wins. Only after a month of stable edge and CLV. - Use per-market caps; small markets get smaller stakes.
How to test calibration, fast
- Bin model probabilities (e.g., 0.50–0.55, 0.55–0.60).
- For each bin, compute actual win rates.
- Plot predicted vs actual by bin. If the 0.60 bin wins ~60% over enough bets, you’re on track.
- Track Brier score weekly. If it doesn’t trend downward as you add data, revisit features or priors.
- Check sharpness: are predictions too close to 50%? Too timid. Or too extreme without validation? Too bold.
Finding the right markets for your edge
- Sides and totals
- Liquid, efficient. CLV is a strong signal of quality. - Harder to beat long-term unless you’re fast and selective.
- Moneylines
- Good for smaller slates and underdogs, but watch the vig.
- Player props
- Edges exist, but limits and latency matter. - Needs strong injury/minutes pipelines and fast execution.
- Live/in-play
- Potential if latency is low and modeling is event-aware. - Test carefully; simulate delays and get realistic about fills.
- Futures
- Sparse sampling; hard to attribute edge vs variance. - Treat as a small satellite portfolio.
Practical templates you can copy
Pick log schema (columns)
- date, sport, league, gameid, markettype, pickselection, book, oddsatpick, impliedprobpick, modelprob, fairodds, EVatpick, timestamppick, oddsatbet, timestampbet, closingodds, timestampclose, stakeunits, result, payout, modelversion, appversion
Bankroll sheet (daily snapshot)
- date, startbankroll, totalstaked, totalreturn, endbankroll, dailyROI, rolling100betROI, maxdrawdowntodate, exposurebysport, exposurebymarket, avgCLV, stdev_CLV
Experiment tracking
- daterange, modelversion, featuresenabled, trainingdatacutoff, retraincadence, A/Bgroupassignmentrule, numpicksA, numpicksB, ROIA, ROIB, CLVA, CLVB, calibrationA, calibration_B, decision (promote/rollback), notes
Weekly model health checklist
- CLV trend vs last week
- Calibration drift
- Latency outliers
- Limits hit rates by market
- Data quality incidents (missing injury tags, lineup changes)
- Top 5 profitable feature contributions, top 5 negative contributors
- User feedback themes
Common pitfalls and how to avoid them
- Chasing short‑term ROI
- Solution: prioritize CLV and calibration first. ROI follows with time.
- Ignoring execution costs
- Solution: log slippage and missed prices; simulate worse fill prices.
- Overfitting to props
- Solution: diversify across market types; cap stake per prop.
- Not versioning models
- Solution: use explicit model IDs; never merge changes without a control.
- Poor data hygiene
- Solution: nightly exports, checksum counts, and spot audits on random picks.
- Misusing Kelly
- Solution: fractional only, tied to verified edge ranges, with caps.
What good explainability looks like in betting models
- Feature importances across recent picks, not just global averages.
- SHAP-like summaries at the pick level that show how injuries, pace, weather, matchups, and player form push a prediction.
- Exposure view: which features drive most of your bets, and whether they correlate with higher or lower CLV.
- Error analysis: which features show up most in losing picks; are they fragile inputs?
Injury and news pipelines that actually help
- Timestamp each update; store source and confidence.
- Propagate impact into minutes/usage and pace changes for NBA and NCAA hoops; for NFL, adjust target share and snap rate expectations.
- For MLB, project lineup probabilities and travel/fatigue flags; for NHL, goalie confirmations and lines matter.
- Backfill misses: if a late scratch moved the market and the app missed it, flag the incident and adjust the process.
Data drift and retraining cadence
- Detect drift: compare distributions of key features week over week (pace, efficiency, player minutes).
- Set thresholds: when KL divergence or PSI crosses a line, schedule a retrain.
- Retrain cadence: props-heavy models weekly; sides/totals biweekly; futures ad hoc.
- Validate: after retrain, run a quarantine period before promoting the model.
Scaling beyond the first league
- Sequence: stabilize NBA or NFL first, then add MLB, NHL, NCAA.
- Use separate unit sizes per sport based on historical CLV and calibration.
- Keep cross‑sport exposure caps to avoid correlated bad weeks.
- Periodically rotate a sport out for maintenance weeks.
Using splits and public action wisely
- Splits data is context, not gospel.
- If a pick aligns with heavy public action but still shows CLV edge, fine.
- If a pick is opposite the majority and still beats close consistently, you might have signal.
- Regressions slip when you overweight public splits—keep them as a small feature or just an informational panel.
How to judge latency and alert quality
- Measure median time from alert to your placed bet.
- Track “price drift at alert”: if prices often move in the wrong direction before your tap, raise alert thresholds.
- Limit “micro-edges” that vanish in 10 seconds unless your workflow is optimized for instant execution.
- Prefer apps that show alert confidence and decay—how fast an edge is expected to erode.
The security and privacy basics you should expect
- 2FA and device‑based login alerts.
- Clear data retention policy: what they store, why, and for how long.
- Segregated environments for development and production.
- Access controls for staff; audit logs.
- Minimal PII collection; no unnecessary permissions.
A final operational snapshot you can copy today
- Step 1: Pick one sport and market (NBA spreads). Paper test for two weeks.
- Step 2: Log every pick with pick odds, close odds, and timestamps.
- Step 3: Compute CLV and Brier score weekly; track rolling 100-bet ROI.
- Step 4: Promote fractional Kelly (0.25–0.5) only after CLV is positive for two weeks and calibration stable.
- Step 5: Expand to props; set strict unit caps due to limits and slippage.
- Step 6: Version your model and the app version; A/B any change for a week.
- Step 7: Export and archive all logs; run a monthly post‑mortem on edge durability.
- Step 8: Use responsible play tools: deposit caps, timeouts, and a budget you respect.
The “best” sports betting AI app in 2025 is the one that helps you do all of this cleanly and consistently, from real-time odds to accountable results. Tools like ATSwins for picks and profit tracking, a reproducible testing workflow, and strict risk controls—put together—are what produce real, measurable edge. Not magic. Just process.
Conclusion
Smart betting starts with measurable edge, solid testing, and disciplined staking. Track ROI and CLV, calibrate probabilities, and respect limits & variance. Use trustworthy data, simple workflows — review results often. To go further, ATSwins's expertise shines in ATSwins, an AI-powered platform for data-driven picks, player props, betting splits, and profit tracking across NFL, NBA, MLB, NHL, & NCAA. Free and paid plans help you decide smarter.
Frequently Asked Questions (FAQs)
What actually makes something the best sports betting AI app?
A best sports betting AI app shows a real edge, not just hype. Look for three core signals: steady ROI after vig, positive closing line value (CLV) versus the market close, and good probability calibration (50% lines win around 50%, etc.). Add in real-time odds updates, fast injury and lineup data, clear model notes, plus stable uptime & support. If it also tracks unit results and lets you export your logs—great. That’s what pros look for.
How can I test the best sports betting AI app before I trust it?
Start with paper bets. Log 100–300 picks from the best sports betting AI app, record the odds you bet and the closing odds, and track win/loss in simple units. Check that CLV is positive most days and that the EV you expect roughly matches the outcomes over time. Use flat stakes at first (like 1 unit per play), then consider a small Kelly fraction only after you see stable results for a few hundred bets. If the edge vanishes when limits tighten or odds move quickly, pause and re-check your process.
Can the best sports betting AI app handle live betting and player props well?
It can, but only if it’s built for speed and breadth. The best sports betting AI app should update lines in seconds, react to injuries and rotations, and cover props with clear inputs (minutes, usage, weather, pace). For live plays, latency kills value—so quicker data, simpler bet entry, and alerts help. I also prefer apps that show confidence ranges for props & live edges, not just “bet now” prompts.
What’s a safe way to size wagers when using the best sports betting AI app?
Keep it simple. With any best sports betting AI app, I start with flat stakes (0.5–1.0 units) and set daily loss caps. If results and CLV hold across a few hundred bets, I might use a half-Kelly or quarter-Kelly based on the app’s edge estimate, never full Kelly. Set deposit limits, cool-offs, and track tilt days. If betting feels off, step back. For support resources, see the National Council on Problem Gambling at https://www.ncpgambling.org.
How does ATSwins.ai fit into finding the best sports betting AI app?
ATSwins.ai helps you act like a pro when you’re evaluating the best sports betting AI app. It’s an AI-powered sports prediction platform offering data-driven picks, player props, betting splits, and profit tracking across NFL, NBA, MLB, NHL, and NCAA. Free and paid plans give bettors insights and guides to make smarter, more informed decisions. I lean on its splits and profit tracking to validate whether my lines beat the close and to spot where an app’s edges are strongest. Explore features at https://atswins.ai and use the logs to see what’s working, then scale carefully.
Related Posts
AI For Sports Prediction - Bet Smarter and Win More
AI Football Betting Tools - How They Make Winning Easier
Bet Like a Pro in 2025 with Sports AI Prediction Tools
Sources
The Game Changer: How AI Is Transforming The World Of Sports Gambling
AI and the Bookie: How Artificial Intelligence is Helping Transform Sports Betting
How to Use AI for Sports Betting
Keywords:
MLB AI predictions atswins
ai mlb predictions atswins
NBA AI predictions atswins
basketball ai prediction atswins
NFL ai prediction atswins