Sportsbooks don’t move lines by accident. Every time a number changes, there’s a reason behind it, even if it’s not obvious right away. As someone who builds AI models to read what the market is saying, I’ve learned that understanding the mix of public money, sharp action, and timing can completely change the way you bet. When you learn to read betting splits and follow line movement correctly, you’ll see the story the market is telling in real time instead of guessing.
In this guide, I’ll break down what betting splits really show, how line movement reflects sharp and public behavior, and how to use AI tools and smart data tracking to make better wagers. By the end, you’ll have a clear, practical process you can follow before every bet you make.
Table Of Contents
- Foundation: Public Money, Sharp Money, And What Betting Splits Actually Show
- Line Movement And Market Microstructure
- Practical Workflow With AI
- Risk and bankroll
- Pitfalls and ethics
- Working examples: combining splits, price, and timing
- Measuring hold and translating to implied value
- Putting it together with ATSwins-style workflows
- Helpful references and context builders
- A short checklist you can reuse before every bet
- A few final notes for the ATSwins bettor
- Conclusion
- Frequently Asked Questions (FAQs)
Foundation: Public Money, Sharp Money, And What Betting Splits Actually Show
If you’ve been around betting for a while, you’ve probably heard people talk about public money and sharp money. These are just labels, but they tell you a lot about where the action is coming from and what it means.
Public money basically means wagers from casual bettors. These are the fans betting for fun, chasing teams they like, or riding hype stories. Most public bets come in close to kickoff or tipoff, and they’re usually smaller. The public loves favorites, overs, and hot teams. You’ll see it all the time. People backing whoever covered last week or whoever is trending on social media.
Sharp money, on the other hand, comes from bettors and groups who specialize in price discovery. They’re not just picking teams they like; they’re hunting for wrong numbers. Their bets are bigger, they come earlier, and they’re sensitive to limits and timing. Sharps might hammer openers, buy off key numbers, or wait until limits rise to push the market in their direction.
Neither group wins all the time, but the way they interact builds the market. Reading that structure through betting splits is how you start to see what’s really happening behind the scenes.
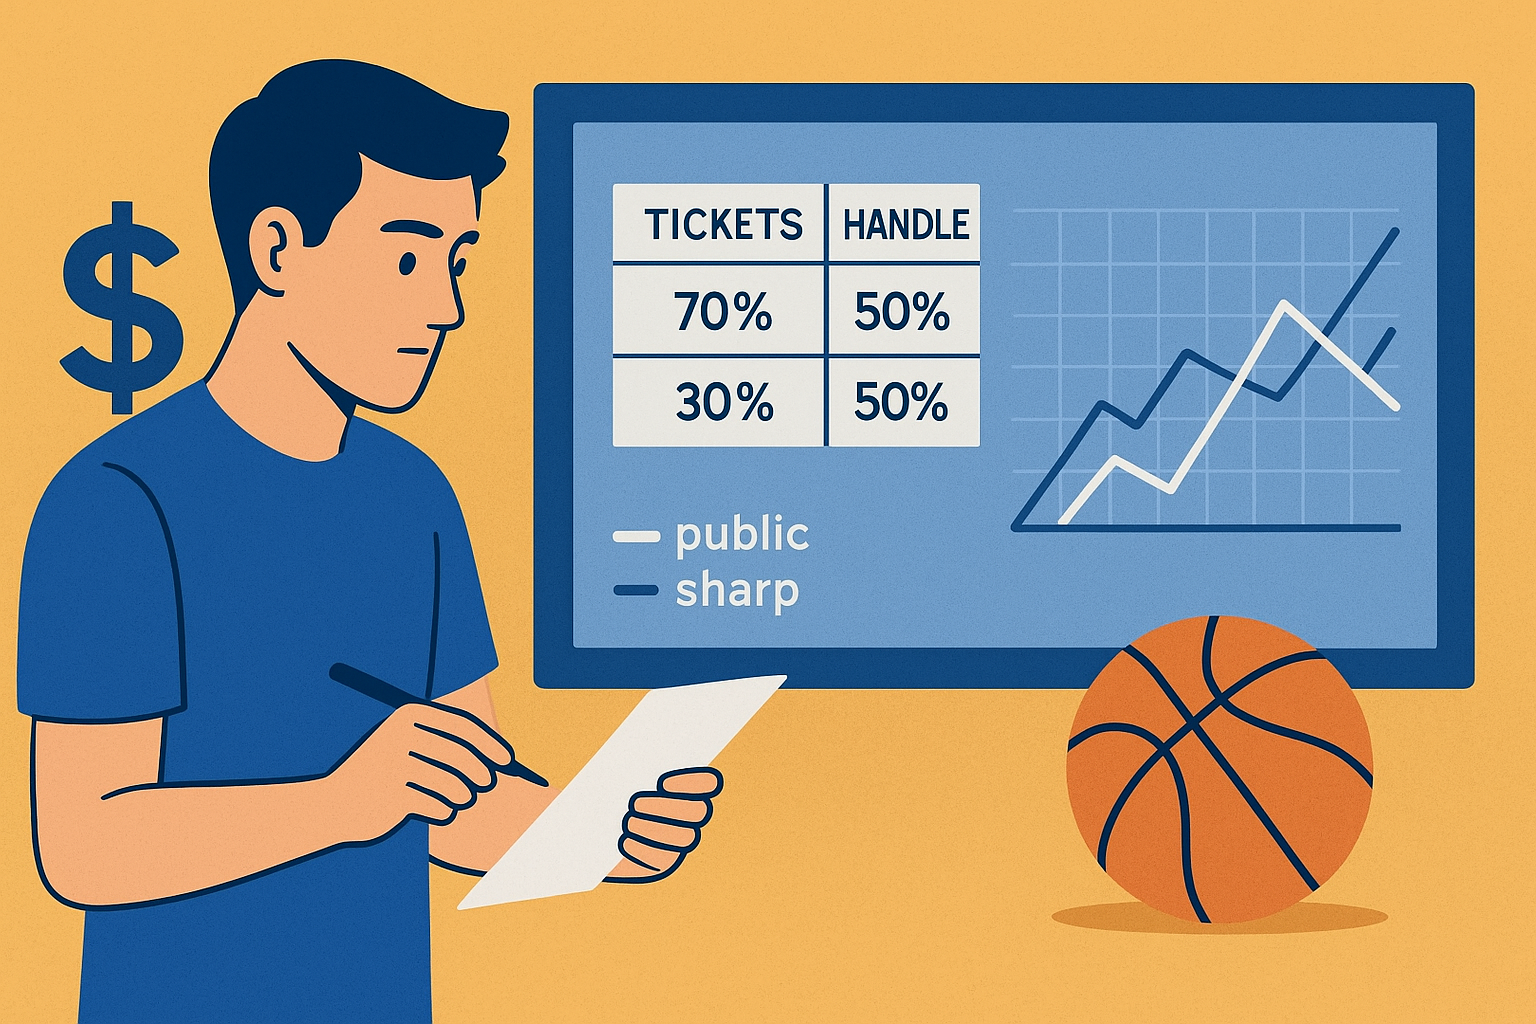
Betting splits tell you two big things: ticket percentage and handle percentage. Ticket percentage is how many total bets are on each side, while handle percentage is how much total money is on each side. If 70% of tickets are on one team but only 50% of the handle is, that usually means the public is driving up the number of bets, but bigger bettors are on the other side. That’s a potential signal of sharp resistance.
Splits usually come from sportsbooks that publish live data on sides, totals, and moneylines. Some of these updates come fast, others hourly, and some are aggregated. The problem is that not all splits are created equal. One sportsbook’s data might lean heavily public, while another includes more sharp money. That’s why timing and sample matter a ton.
If you’re using a platform like ATSwins, pairing time-stamped splits with time-stamped odds lets you see what really happened instead of guessing. You can measure which side moved the line, when it happened, and how it lined up with public vs. sharp behavior.
There are a few core concepts that always come up when reading splits: reverse line movement, steam, and closing line value.
Reverse line movement (RLM) happens when the line moves opposite the popular side. Imagine 70% of tickets are on Team A -3, but the line drops to -2.5. That means sharp bettors are likely backing Team B. It’s not a guarantee that Team B will win, but it’s a clear sign that professional money pushed against the crowd.
Steam moves happen when multiple sportsbooks move at once in one direction. That usually means a group of sharps hit the same side across books during a high-limit window. Steam can also reverse if there’s disagreement or new info like injuries or weather.
Closing line value (CLV) is what separates good betting from guessing. It’s the price you get compared to the closing number. If you consistently beat the close, that’s the best indicator you’re getting real edges. You can have short-term losing streaks, but over time, CLV tells the truth about your skill.
When reading splits, compare ticket and handle percentages, look for contradictions, check how the line moved since open, and always think about timing. Early sharp hits mean something different than late public surges. Add context like weather, rest, injuries, and key numbers before deciding what a move means.
Line Movement And Market Microstructure
From the moment a line opens to when it closes, the betting market tells a full story. Market-making books with sharp limits often move first, while retail books follow. If a market-maker moves the number, that means something real just happened.
Limits matter too. When lines open, limits are small, so sharps might wait until they can get more down. That’s why you’ll see bigger steam moves closer to game time. Injury news or weather updates can also flip a market instantly. A quarterback downgrade, a goalie confirmation, or a 20-mph wind shift can move totals several points in minutes. Splits will always lag those changes.
You also need to think about hold (the built-in house margin) and key numbers. The hold tells you how much edge you need to break even. For example, a -110/-110 market has about a 4.5–5% hold. Key numbers like 3 and 7 in the NFL are massive. Moving off +3.0 to +2.5 isn’t a small change; it’s a big one in terms of probability. Always know where you are relative to those keys before you react to a move.
When splits and price movement disagree, that’s when the real insight happens. If the handle is on Team A but the line moves toward Team B, that usually means sharp money came in on Team B. If both tickets and handle are heavy on one side but the line won’t budge, it might mean the book is comfortable taking that action because they’ve shaded the price already.
Line movement can also stall when limits are low or when opposing sharps are balancing the action. Sometimes, quick surges in tickets without a price change mean low-impact public bets or even spoofing. The trick is to verify with multiple sources and not chase old data.
Before every bet, check how long ago the move happened, whether it’s across a key number, and if the hold varies across books. A lot of people lose value by reacting to something that happened fifteen minutes earlier.
Practical Workflow With AI
Now let’s talk about how to actually build a workflow that makes use of this information. Betting with data doesn’t have to be complicated. A solid process beats a hunch every time.
Start by pulling time-stamped splits and odds at regular intervals; every five or ten minutes works for most sports. Record ticket and handle percentages for sides, totals, and moneylines. Do the same for odds from several sportsbooks. Add context like weather, injuries, and rest situations. Always standardize team names and time zones so your data lines up cleanly.
If you’re using ATSwins, you can easily compare your own model’s projections with what the ATSwins dashboards show for picks, splits, and profit tracking. Seeing how your view lines up against both the market and the ATSwins baseline helps keep your edges honest.
Once your data is clean, normalize it into consistent time buckets. Ten-minute snapshots are fine earlier in the day, but closer to game time, you might want one- or two-minute intervals. For each snapshot, store the current line, change from open, handle gap, time-to-close, and any weather or news flags.
Good features to track include line changes, handle minus ticket gaps, contradictions (when the line moves against the popular side), and how dispersed prices are across books. Time-to-close matters too because signals behave differently early vs. late. Adding league context like NBA pace or MLB bullpen strength also helps.
For modeling, you don’t need a deep neural net. Start with logistic regression for simplicity, or gradient boosted trees like XGBoost if you want to capture non-linear relationships. You can target the probability of beating the closing line or the probability of a bet being positive expected value.
Validate your model by training on a few weeks, testing on few next, then sliding the window forward. Don’t let closing data leak into your training set. Segment results by market type like sides, totals, moneylines and check CLV hit rates separately.
Once you’re live, track every bet you place. Log the timestamp, odds, stake, features at the time, and what the closing line ended up being. Then review CLV after close. Use dashboards to visualize ROI, drawdown, median CLV, and how often you beat the close.
If you see that your bets with certain signals like contradictions plus a 10% handle gap keep generating positive CLV, that’s a good sign. If not, recalibrate. Update models monthly and keep notes on what changed.
For tools, you don’t need a massive setup. Basic Python with pandas and scikit-learn can handle almost everything. Store your data in CSVs or a small database, schedule pulls every few minutes, and automate your logs. It’s more about consistency than flash.
Your process might look like this: pull data every ten minutes, compute features, score each open market with your model, check if the expected edge is big enough after accounting for vig, then bet if it clears your thresholds. At market close, fetch final prices, record CLV, and move to the next day.
Even with automation, keep human guardrails in place. Set exposure caps per league and per game. Don’t bet just because a model says so; bet when the signal and the price both agree.
Risk And Bankroll
Let’s be honest. Most bettors lose not because their picks are terrible but because they can’t manage risk. You can be right and still go broke if your unit sizing is out of control. That’s where bankroll management comes in.
A simple and effective approach is using fractional Kelly sizing. You estimate your edge, then stake a fraction of what the Kelly formula says. The Kelly formula helps you maximize long-term growth while avoiding ruin, but because sports edges are noisy, you usually want a smaller fraction, like 0.25 to 0.5 Kelly.
For example, if your model gives you a 54% chance to win a -110 bet, your fair odds would be closer to -117. Plug that into Kelly, and you’d get about a 4.9% bet size. Using half Kelly means betting around 2.5% of your bankroll. Most disciplined bettors cap single bets at 1–2% to manage variance.
Limit your exposure too. Don’t risk more than a few units on the same game across different bets, especially correlated ones. If you’re betting an NFL side and total that move together, your risk is higher than it looks.
Set caps per league so you don’t overload one sport. If you hit a bad run, say down 6 to 8 units in a week, pause. A cool-down period can stop tilt betting. Always remember that the goal is long-term growth, not short-term excitement.
And it needs to be said: responsible betting matters. Edges are small, and variance can be brutal. Bet only what you can afford, and treat it like investing, not gambling for fun.
Pitfalls And Ethics
There are a lot of traps people fall into when using data for betting. One of the biggest is relying on a single sportsbook’s splits. That’s like trying to judge the whole stock market by looking at one company’s chart. Always cross-check data when you can, and pay attention to which books move first.
Stale lines are another killer. Some data feeds lag behind reality, especially near game time. A five-minute delay can destroy your edge. If your splits don’t update quickly, don’t treat them as live.
You also need to avoid data leakage in your models. Never use closing data or post-news updates when you’re simulating decisions that happen earlier. Survivorship bias is another sneaky one. If you only track the games you bet, you’ll overestimate your edge. Keep logs of all potential bets, even the ones you passed on.
Overfitting is another problem. A feature that looks great for a few weeks might just be random noise. Test stability across multiple seasons and leagues before you trust it. Keep your models simple and grounded in logic.
Finally, keep your process ethical. Respect local regulations, data source terms, and sportsbook limits. Document your rules, preregister your tests if possible, and log every model change. Betting should be about skill and discipline, not gaming the system.
Working Examples: Combining Splits, Price, And Timing
Let’s look at a few examples of how this actually plays out.
Say you’re looking at an NFL game where 68% of tickets are on the favorite at -3, and 58% of the handle is too. Two hours before kickoff, the line drops to -2.5 at a sharp book. That’s reverse line movement. It means sharp bettors likely hit the dog hard enough to push the line off a key number. If your model still shows value on the dog at +3, grab it quickly at a slower-moving book before it disappears.
Now imagine an NBA total opening at 231.5 and slowly climbing to 233 throughout the afternoon. Tickets are 60% on the over, handle 66%, and the line keeps inching up. That’s not fake steam. It’s likely legit money tied to pace or lineup news. If your numbers agree and the line hasn’t gone too far, you might follow. If not, skip it. Fading the public blindly isn’t always smart when the price is fair.
Another example: in MLB, say the home team sits around -125 at a sharp book but -120 at retail ones. Tickets are 55% home, handle 62%. The weather is neutral, and the bullpens favor the home team. That slight handle edge, plus better prices at retail,l means you’re likely getting small sharp support. You take -120, and by first pitch, the line closes -128. That’s a win for you even before the game starts. You beat the market.
Measuring Hold And Translating To Implied Value
You don’t have to be a math major to understand hold. It’s just the built-in cut the sportsbook keeps. If both sides are priced at -110, the implied probabilities add up to about 104.76%. The extra 4.76% is the book’s margin.
You can use that to judge your needed edge. If your expected edge is only 2% and the hold is 4.5%, you’re still negative. Aim for a margin that clears the vig comfortably, ideally at least 1.5 to 2% net.
Key numbers and fair prices matter here too. In the NFL, moving from +3 to +2.5 often costs 15 to 20 cents of value. Don’t pay through those keys for a signal that looks good but doesn’t justify the price. In other sports, the impact varies. NBA totals care more about pace and fatigue than key points. In MLB or NHL, starting pitchers and goalies swing prices fast.
Putting It Together With ATSwins-Style Workflows
Once you’ve got your signals, models, and bankroll rules, it’s time to make it actionable. One effective framework is labeling bets as “with-sharp” or “fade-public.”
With-sharp means the line moved against the popular side and continued to move that way later. Fade-public means heavy ticket counts but smaller handle percentages, with the line staying flat or moving slightly opposite the crowd.
Track ROI and CLV for each label separately. You’ll often find that fade-public only works in certain leagues or late windows. With-sharp bets tend to show stronger CLV over time.
Consistency matters more than flash. Use the same process every day, and let the data tell you which categories work. Over a few months, you’ll see patterns emerge that feel like second nature.
Helpful References And Context Builders
It’s easy to get lost in data, so context is your best friend. Build historical baselines for scoring, pace, and rest patterns by league. Cross-check how your numbers align with ATSwins' projections to stay calibrated. Use public-interest signals like social trends cautiously, but they can help you spot when the crowd might pile on late.
Most importantly, keep updating your understanding. The market evolves every season, and limits, rules, and player trends all shift. Treat betting like an ongoing experiment where every week gives you new data points to learn from.
A Short Checklist You Can Reuse Before Every Bet
Before locking anything in, walk through this mental checklist:
- Are your splits and odds fresh within the last few minutes?
- Is there a contradiction between splits and line movement, and do you trust the book that moved first?
- Is the handle-to-ticket gap meaningful, like at least eight or ten percent?
- Are you crossing or giving up a key number?
- Are you in the right time window for your strategy, early for openers or late for public fades?
- Does your expected edge beat the vig comfortably?
- Are you within your exposure limits for this game and league?
- And finally, are you logging this bet so you can track CLV and ROI later?
A Few Final Notes For The ATSwins Bettor
Betting splits aren’t a crystal ball, but they’re one of the best tools for understanding market sentiment. Combine them with live price action and your own model to get a full picture. CLV tracking is the compass that keeps you honest. It tells you if you’re beating the market, not just winning games by luck.
Keep things simple. A couple of strong signals used consistently will take you further than chasing every new metric. Manage your bankroll with discipline, respect key numbers, and don’t chase steam late.
If you want a reliable way to track your bets, splits, and model comparisons without building spreadsheets from scratch, ATSwins gives you everything in one place. You can see public vs. sharp action, compare line movement, and follow your profit tracking across major sports.
Conclusion
At the end of the day, sports betting is about timing, pricing, and psychology. Markets move for reasons, some visible, some not. By learning to read betting splits, understanding sharp vs. public behavior, and respecting line movement, you turn noise into information.
Combine that with a consistent workflow, risk control, and regular review, and you’ll be ahead of 95% of bettors who rely on instincts alone. The key is staying patient and process-driven. Every edge compounds when you treat it like a craft.
Use the data, stay disciplined, and keep tracking your results. When you bet smarter, not faster, your bankroll starts telling the story for you.
Frequently Asked Questions (FAQs)
What are betting splits?
They show how many tickets and how much money are on each side of a bet. Tickets represent volume, while the handle shows total money. Comparing them reveals who’s betting what.
What is reverse line movement?
It’s when the line moves against the popular side. It usually indicates sharp money is on the less popular team.
What is closing line value (CLV)?
CLV measures the price you got versus the final closing price. Beating the close over time means you’re finding real edges.
Should I always fade the public?
Not always. The public is right sometimes. Focus on when the line moves opposite public action. That’s a sharper tell.
How can I track my bets easily?
Platforms like ATSwins make it simple to log picks, see line moves, and track profit without manual spreadsheets.
What’s the best bankroll rule?
Keep bets under 1–2% of your bankroll per play, and avoid correlated bets on the same game.
Related Posts
AI For Sports Prediction - Bet Smarter and Win More
AI Football Betting Tools - How They Make Winning Easier
Bet Like a Pro in 2025 with Sports AI Prediction Tools
Sources
The Game Changer: How AI Is Transforming The World Of Sports Gambling
AI and the Bookie: How Artificial Intelligence is Helping Transform Sports Betting
How to Use AI for Sports Betting
Keywords:
MLB AI predictions atswins
ai mlb predictions atswins
NBA AI predictions atswins
basketball ai prediction atswins
NFL ai prediction atswins