

Navigating the vast ecosystem of Major League Baseball player props requires looking far past standard batting averages and surface-level earned run averages. When you open a sportsbook app during a busy summer slate, you are greeted by dozens of individual lines ranging from pitcher strikeouts and total bases to runs batted in and home runs. Behind each of these numbers lies a complex web of quantitative modeling, probability theory, and regression analysis designed to price human performance into a neat numerical market. Understanding this underlying math transforms how you view a baseball game, shifting your perspective from casual fandom to disciplined mathematical evaluation.
Foundations of Baseball Probability
Baseball is uniquely suited for mathematical modeling because of its discrete, sequential nature. Unlike fluid sports like soccer or basketball where continuous action dictates the flow, baseball breaks down into individual plate appearances, pitches, and distinct outcomes. Every single pitch results in one of a finite set of events, whether it is a ball, strike, foul, or ball in play. This granular structure allows analysts to break down player tendencies into baseline probabilities. When platforms like ATSwins.ai evaluate a matchup, they do not look at a player as a single static entity. Instead, they treat every player as a collection of probabilities governed by historical sample sizes, park factors, and situational splits.
To understand the math, you must first separate a true talent level from observed results. A batter who hits three home runs in a single week has experienced a high-variance cluster of events that does not necessarily mean his true home run probability has permanently shifted upward. Quantitative models utilize regression techniques, such as regressing statistics toward a league-average baseline based on sample size, to filter out short-term noise. This concept is often framed through the lens of expected statistics. Metrics like expected weighted on-base average use exit velocity and launch angle data from every batted ball to assign a precise mathematical probability of a hit or extra-base hit occurring. By stripping away defensive alignments and fielding luck, models reveal the true underlying production capability of a player.
Modeling Pitcher Strikeouts
One of the most popular individual markets revolves around pitcher strikeout props, where a sportsbook posts a line such as 6.5 strikeouts and asks you to choose the over or under. Building a robust model for this market requires diving into discrete probability distributions. While casual observers might assume strikeout counts follow a simple bell curve, analytical platforms rely on advanced modeling techniques to account for the binary nature of individual batter-pitcher confrontations. Each batter in the opposing lineup possesses a distinct strikeout percentage based on their historical tendency to swing and miss against specific pitch types, such as fastballs, sliders, or changeups.
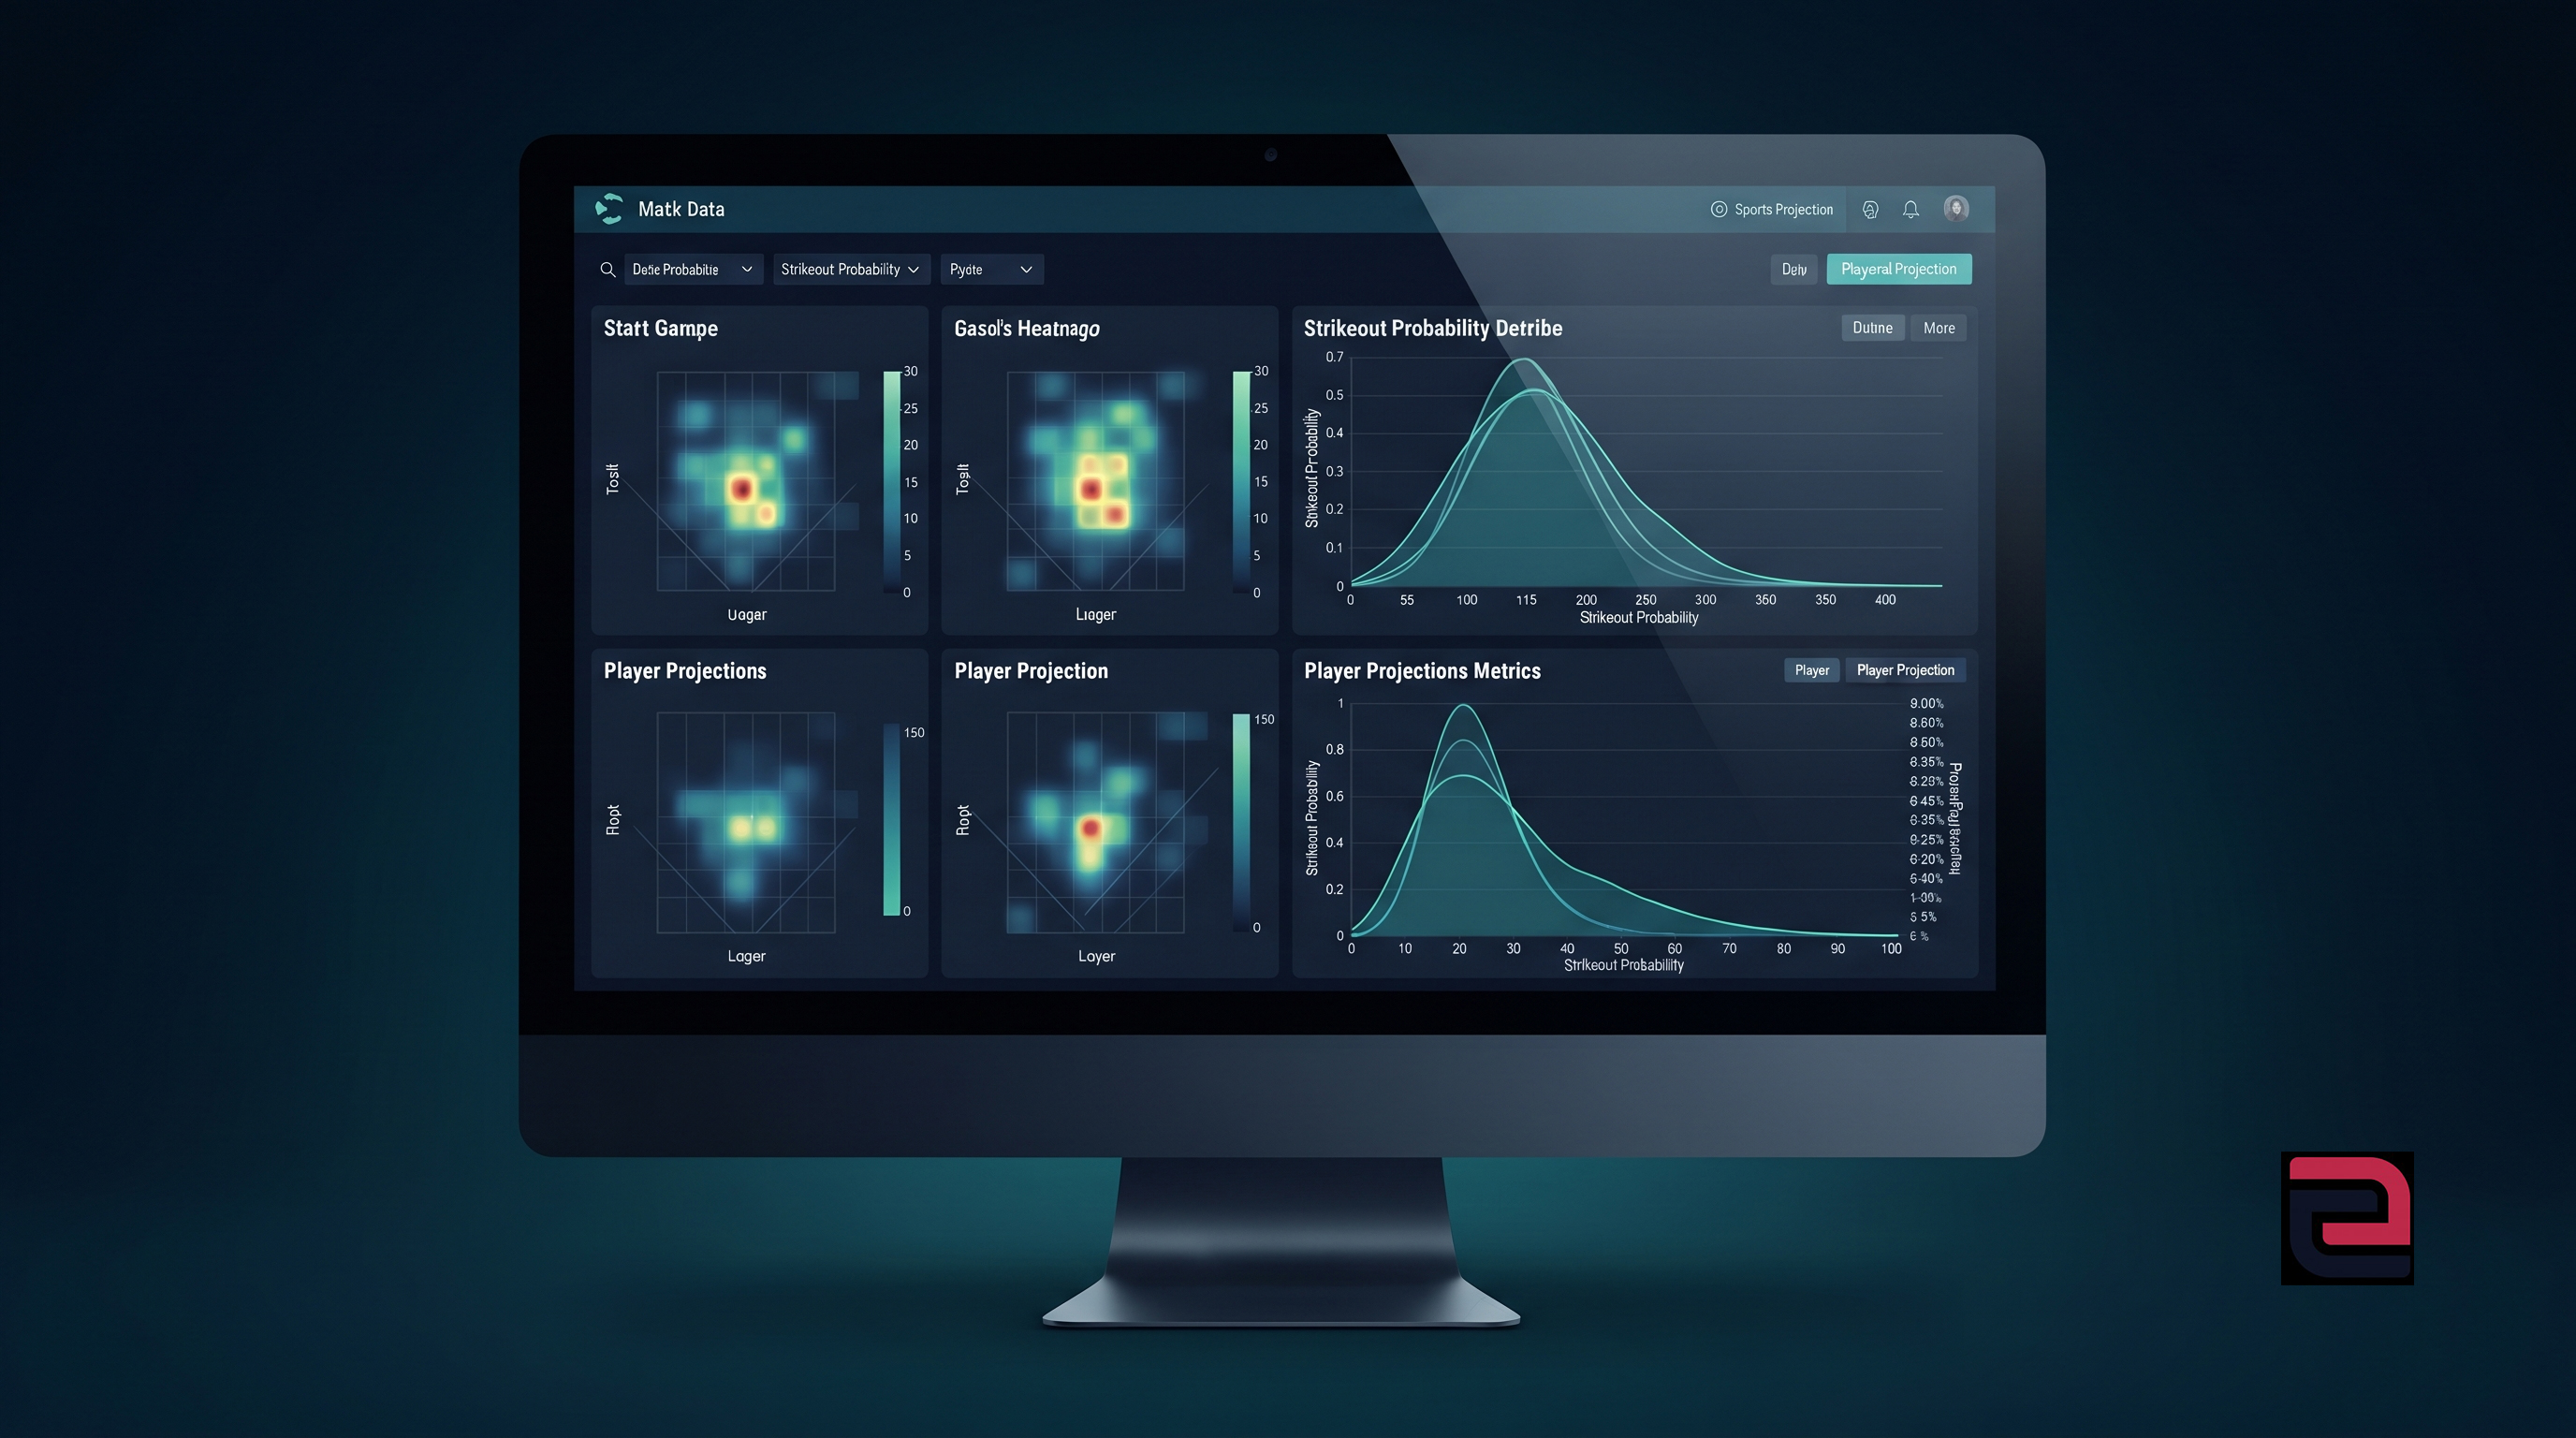
When a starting pitcher faces a nine-man lineup, a predictive model simulates the entire sequence of expected plate appearances. If a pitcher typically faces twenty-four batters in an outing, the model calculates the probability of a strikeout for each individual matchup. These individual probabilities are then aggregated using binomial or compound probability formulas to generate a precise projection distribution. This means the output is not just a single projected number like 6.2 strikeouts, but an entire probability curve showing the exact mathematical likelihood of the pitcher recording zero strikeouts, one strikeout, two strikeouts, all the way up to double digits. Comparing this custom-built probability distribution against the odds posted by sportsbooks reveals where the market price diverges from mathematical reality.
Evaluating Hitter Props and Variance
Hitter props, including total bases, hits, and runs batted in, present an entirely different set of mathematical hurdles due to extreme inherent variance. Baseball is a game where even the greatest hitters in history fail to record a hit in roughly seven out of every ten plate appearances. Because success rates are relatively low on a per-at-bat basis, single-game samples are notoriously volatile. A model predicting a player to accumulate over 1.5 total bases must account for the exact batting order position, as leadoff hitters secure significantly more plate appearances over the course of a nine-inning game than hitters tucked into the bottom of the order.
Furthermore, predictive modeling incorporates platoon splits, evaluating how a left-handed hitter performs against right-handed pitching versus left-handed pitching. Pitch-tracking data allows modern algorithms to measure a hitter's whiff rate, chase rate, and hard-hit percentage against specific velocity ranges and horizontal break profiles. When an elite power hitter matches up against an opposing starter who heavily relies on a fastball that matches the hitter's optimal attack zone, the mathematical model adjusts the expected run-value and slugging probability upward. However, acknowledging uncertainty is critical. Even with advanced modeling, short-term variance remains the dominant force in single-game baseball outcomes, meaning disciplined bankroll management and probability weighting are just as important as the initial projection.
Implied Probability and Market Pricing
Calculating the math behind player props requires understanding how sportsbooks construct their prices and how to reverse-engineer those numbers into implied probabilities. When you see American odds listed next to a prop bet, those numbers represent more than just potential payouts; they reflect the market's consensus probability of an event occurring, adjusted to include the sportsbook margin, commonly known as the vig or juice. Converting American odds into implied probability is a fundamental mathematical step for any serious sports analyst. For negative odds, you divide the negative odds number by that same number minus one hundred, while positive odds are calculated by dividing one hundred by the positive odds number plus one hundred.
The true edge in prop evaluation comes from finding discrepancies between your independently calculated probability and the implied probability of the market. If a quantitative model determines that a starting pitcher has a fifty-eight percent chance of recording over 5.5 strikeouts, but the available sportsbook odds imply a probability of only fifty percent, a mathematical value gap has been identified. This is where platforms utilizing a comprehensive sports betting data platform add structural value. By operating as a robust AI sports betting probability model, they process thousands of historical data points, weather conditions, ballpark dimensions, and umpire tendencies to output fair-line estimates. Finding long-term value in sports forecasting is entirely about identifying these mathematical mispricings rather than blindly chasing outcomes.
The Role of ATSwins in Prop Analytics
Analyzing Major League Baseball player props through a purely manual lens is computationally impractical given the sheer volume of daily variables, ranging from late lineup scratches and bullpen usage rates to shifting humidity levels and wind vectors. This complexity is where platforms like ATSwins.ai provide systematic clarity. By leveraging an advanced sports probability engine, simulation engines, and player projections, ATSwins processes massive datasets to generate objective fair-line estimates and probability distributions for every game on the daily slate.
Instead of relying on gut feelings or media narratives, users can leverage data-driven insights to evaluate how closing-line value and market evaluations shape optimal decision-making. The platform focuses on establishing transparent probability frameworks, helping enthusiasts understand the difference between raw predictions and true statistical likelihoods. Whether you are examining pitcher strikeout trends or evaluating hitter production matrices, integrating structured analytics into your routine elevates your entire approach to sports forecasting. To explore advanced simulation features and data tools designed for modern sports enthusiasts, visit the main portal at ATSwins.ai.
Frequently Asked Questions
What makes MLB player props different from full-game markets?
Full-game betting requires predicting the final winner or total combined score, which introduces countless compounding variables including bullpen collapses and defensive miscues. Player props isolate individual statistical achievements, such as an individual pitcher's strikeouts or a specific batter's total bases, allowing analysts to focus strictly on isolated matchups and player-specific data inputs.
How do weather conditions affect player prop models?
Weather variables, particularly wind speed, wind direction, temperature, and barometric pressure, exert a massive influence on baseball trajectories. Predictive models factor in these environmental metrics because heavy air or incoming wind can turn potential home runs into routine warning-track fly balls, directly altering hitting and pitching projections.
Why is implied probability important when evaluating odds?
Implied probability translates sportsbook odds into a standard percentage, allowing you to compare the price being offered against your own calculated probability. If your model indicates a higher likelihood of an event occurring than what the sportsbook odds imply, you have uncovered a positive value opportunity.
How do predictive models handle unexpected lineup changes?
Modern sports analytics platforms continuously ingest real-time data feeds. When a starting lineup is officially released or a player is scratched due to a late injury, automated algorithms instantly recalculate plate-appearance expectations, opposing pitcher splits, and updated probability distributions to reflect the new game environment.