

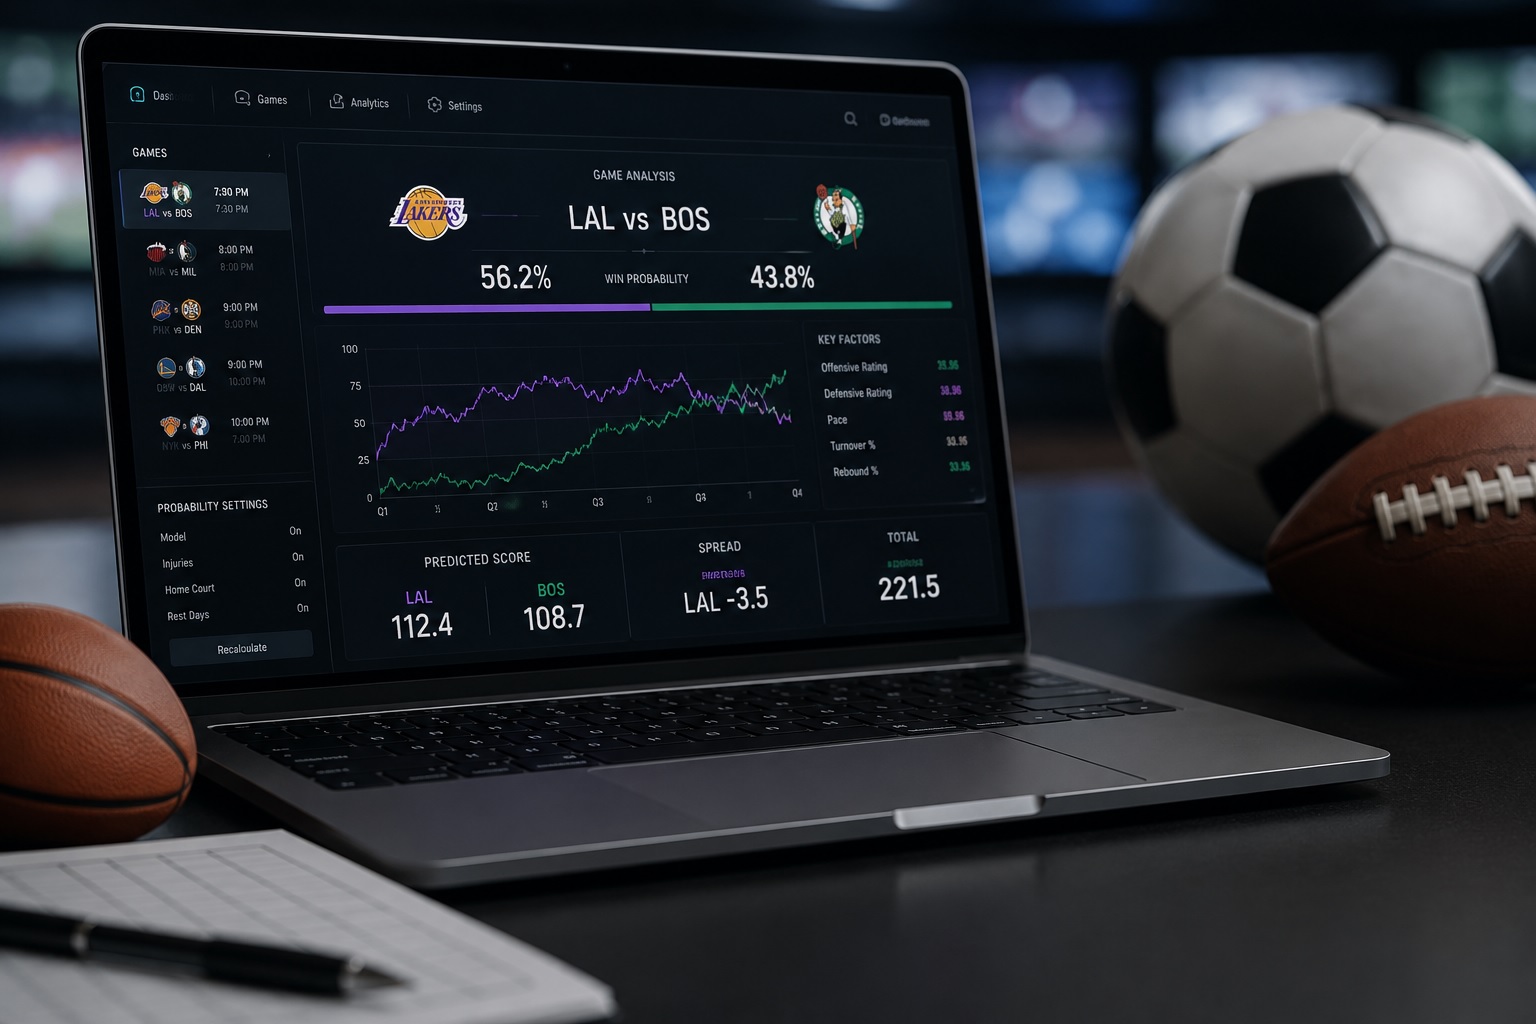
Sports odds are not magic. They are math, data, and context all rolled into one. I work with this stuff every day, building AI models that turn messy sports data into clean probabilities you can actually use. The goal is not to impress anyone with complicated formulas. The goal is to make better decisions. That means understanding injuries, pace, travel fatigue, and turning all of that into realistic probabilities, fair lines, and smarter bets.
Table Of Contents
- Building Sports Probability Analysis Software That Traders and Coaches Actually Use
- Foundation and goals
- Core components
- Step-by-step workflow
- Templates, schemas, and modeling patterns
- Evaluation, governance and ops
- Practical uses and tips
- Where ATSwins fits
- Implementation checklists
- Real-time latency and live betting specifics
- How-to examples across common markets
- Reproducibility and explainability tactics
- Bankroll math that keeps teams out of trouble
- Turning probabilities into action for coaches and traders
- Quality gates for release candidates
- Practical tips from day-to-day use
- Lightweight governance that grows with you
- From prototype to a platform
- Verification and sanity checks you can automate
- Bringing it back to ATSwins users
- Conclusion
- Related Posts
- Frequently Asked Questions (FAQs)
Building Sports Probability Analysis Software That Traders and Coaches Actually Use
Let’s start with the basics. Sports probability analysis software takes raw game data and turns it into probabilities you can actually act on. That means win probabilities, totals likelihoods, prop chances, and expected value. It is not just for bettors either. Coaches use it, analysts use it, and traders use it.
The key idea is simple. If you say a team has a 60 percent chance to win, that should actually happen about 60 percent of the time over the long run. That is called calibration, and it matters more than most people realize. You can have a model that looks smart but loses money because it is not calibrated. On the flip side, you can have a boring model that is well calibrated and quietly profitable.
The outputs from this kind of system usually include dashboards, alerts, APIs, and reports. You want something that is fast, easy to understand, and actually useful in real situations. That is where ATSwins comes in, because it focuses on taking those probabilities and turning them into picks, props, and insights that people can actually use.
Foundation and goals
The foundation of any good system is clean data and clear goals. You are not trying to predict everything. You are trying to predict specific outcomes as accurately as possible. That could be who wins, how many points get scored, or whether a player hits a stat line.
Good models balance sharpness and calibration. Sharpness means the model makes confident predictions when it has strong data. Calibration means those predictions actually match reality over time. You need both. If you only have one, you will struggle.
The goal is not perfection. The goal is consistent edges. Even small edges can add up if you apply them correctly.
Core components
Everything starts with data. You need reliable inputs like scores, play by play data, injuries, lineups, and betting lines. Then you clean that data, organize it, and store it in a way that makes it reusable.
Features are the next step. These are things like team form, rest days, travel distance, pace, and player availability. These are what your model actually uses to make predictions.
Then you have the models themselves. Some are simple like rating systems. Others are more complex like machine learning models or simulations. The best systems usually combine multiple approaches.
Simulation is a big part of this. Instead of predicting one outcome, you simulate thousands of possible game paths. This gives you a full distribution of outcomes, which is way more useful than a single number.
Finally, you calibrate everything so the probabilities actually match reality.
Step-by-step workflow
The workflow usually starts with collecting data. You bring in historical data, live feeds, and anything else relevant. Then you validate it to make sure it is clean and usable.
Next comes feature engineering. This is where you turn raw data into meaningful signals. For example, instead of just using points scored, you might use adjusted efficiency or pace.
After that, you train your models. Start simple and build up. Always compare against a baseline.
Then you evaluate using proper metrics like log loss and Brier score. Accuracy alone is not enough.
Backtesting is critical. You simulate how your model would have performed in the past using only the data available at that time.
Finally, you deploy the model and monitor it. Models are not static. They drift over time and need updates.
Templates, schemas, and modeling patterns
A good feature template includes team strength, recent form, schedule factors, player availability, and market context. These are the building blocks.
Different sports require different approaches. Soccer often uses goal based models. Basketball focuses on possessions. Football looks at drives. Baseball looks at matchups. Hockey relies on shot quality and volume.
The key is adapting the framework to the sport while keeping the core ideas consistent.
Evaluation, governance and ops
You need to measure what matters. Log loss and Brier score are the main metrics. Calibration curves show whether your probabilities are reliable.
You also need to track expected value and actual results. This is where a lot of people go wrong. They focus on wins and losses instead of long term value.
Governance matters too. You need version control, testing, and documentation. Treat your models like software, because that is exactly what they are.
Practical uses and tips
In pregame scenarios, you generate fair odds and compare them to the market. In live situations, you update probabilities in real time based on what is happening in the game.
You also need to think about portfolio management. Not all bets are independent. Correlation matters.
Scenario analysis is another big one. What happens if a player is out? What happens if the pace changes? These questions should be easy to answer.
Automation helps a lot. Set alerts for when value appears. Update models when new information comes in.
Where ATSwins fits
ATSwins is built around making this process practical. Instead of forcing users to build everything from scratch, it provides data driven picks, prop probabilities, betting splits, and tracking tools.
It focuses on usability. You are not just getting numbers. You are getting context and actionable insights.
If you want a deeper breakdown of how prediction tactics actually work in practice, the ATSwins article “Cracking the Code: Sports Outcome Prediction Platform Tactics for Accurate Wins” is a solid reference point that connects modeling ideas with real world application.
Implementation checklists
When building a system, you want a clear plan. Start with one league and one market. Build a baseline model. Add features gradually. Test everything.
Before release, make sure your model is calibrated, stable, and fast enough for real use. You also need monitoring in place so you can catch issues early.
Real-time latency and live betting specifics
Live betting is all about speed. A model that is slightly better but slower can lose to a faster model.
You need to optimize every step. Data ingestion, feature processing, prediction, and delivery all need to be fast.
You also need fallback systems. If something breaks, you should still be able to provide reasonable outputs.
How-to examples across common markets
For moneylines, you predict win probability and convert it into fair odds. For totals, you simulate scoring distributions. For props, you model individual player performance.
Each market has its own quirks, but the core idea is the same. Turn data into probabilities, then compare those probabilities to the market.
Reproducibility and explainability tactics
Reproducibility means you can rerun your model and get the same results. This is important for trust and debugging.
Explainability means you can understand why the model made a prediction. This helps with adoption and confidence.
Bankroll math that keeps teams out of trouble
Bankroll management is just as important as the model itself. Even a good model can fail with bad staking.
The Kelly criterion is a common approach, but most people use a fraction of it to reduce risk.
You also need limits and controls to prevent overexposure.
Turning probabilities into action for coaches and traders
For coaches, probabilities can guide decisions like when to go for it or how to manage rotations.
For traders, they help identify value and manage risk.
The key is turning numbers into decisions, not just insights.
Quality gates for release candidates
Before deploying a model, it should pass several checks. It should be calibrated, stable, and profitable in backtests.
It should also handle edge cases and perform well under stress.
Practical tips from day-to-day use
Keep things simple when possible. Monitor calibration regularly. Pay attention to schedule effects and injuries.
Do not overcomplicate your model unless it actually improves results.
Lightweight governance that grows with you
As your system grows, you need structure. Define roles, set up regular reviews, and keep documentation updated.
This helps maintain quality and consistency.
From prototype to a platform
Start small and scale gradually. Focus on one market, then expand.
Make sure your infrastructure can handle growth.
Verification and sanity checks you can automate
Automate checks for probability consistency, data quality, and unusual outputs.
If something looks too good to be true, it probably is.
Bringing it back to ATSwins users
At the end of the day, the best systems are the ones people actually use. ATSwins focuses on making probabilities usable.
It combines data, models, and tracking into a single platform that helps users make better decisions.
Conclusion
Sports probability analysis is all about turning data into decisions. Clean data, solid models, proper evaluation, and disciplined execution are what make the difference.
ATSwins brings all of this together in a practical way. It provides data driven picks, player props, betting splits, and tracking tools that help users stay consistent and informed.
If you focus on calibration, value, and process, you will be ahead of most people. The rest is just execution.