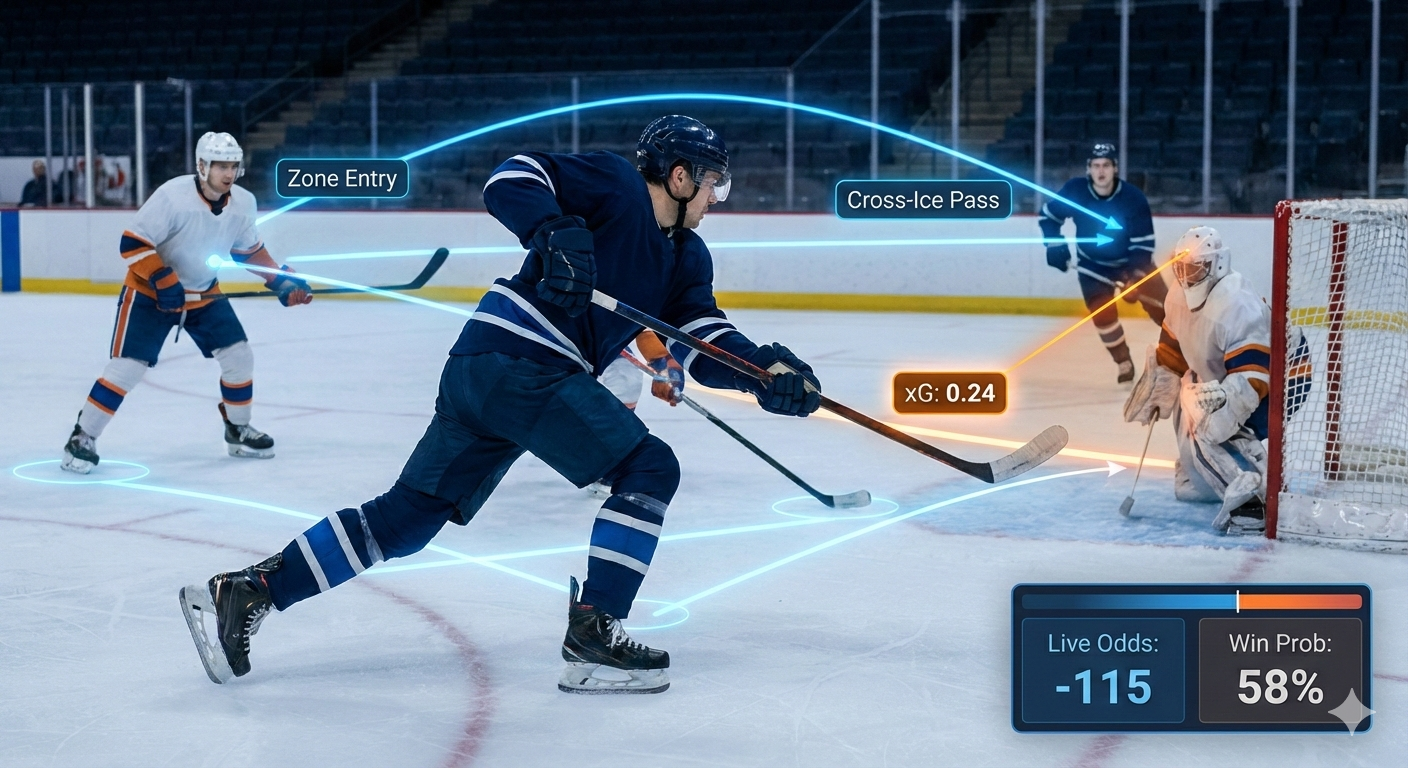
Watching NHL totals swing on a single rush is one of the wildest parts of hockey betting. One clean zone entry, one cross-ice pass, and suddenly an under looks dead. But the reality is that those moments are not random at all. They are patterns. When you break hockey down by shot quality instead of just shots or goals, things start making a lot more sense.
That is where expected goals, usually called xG, comes in. Instead of treating every shot the same, xG asks a simple question. Given where the shot came from and what happened right before it, how likely was it to become a goal? Once you can answer that question consistently, you are no longer guessing. You are pricing outcomes.
This guide walks through how to build an NHL expected goals betting model that actually holds up on game day. It blends shot quality, goalie context, game state, and realistic betting constraints. The goal is not to show off math skills. The goal is to turn probabilities into fair prices, edges, and disciplined bets you can trust. This is the same general framework that powers projections, picks, and player props workflows used at ATSwins.
Table of Contents
- Problem framing: what xG means in hockey and how it translates to wagers
- Data pipeline and features: getting to a clean training set
- Modeling core: from shot xG to team totals
- From xG to edges: pricing, EV, bankroll, and bet sizing
- Production and monitoring: making it reliable day after day
- Step-by-step: getting from zero to first bets in a weekend
- Practical tips from the ATSwins workflow
- A quick comparison of model options
- Reality checks and common pitfalls
- Extending to player props
- Notes on data quality and maintainability
- Where this fits for ATSwins users
- Conclusion
- Frequently Asked Questions
Problem Framing: What xG Means in Hockey and How It Translates to Wagers
Expected goals in hockey is the estimated probability that a specific shot becomes a goal. Every shot attempt is treated like a probability event. Some shots are basically prayers. Others are tap-ins. xG simply puts a number on that difference.
When you add up all those probabilities across a game, you get an expectation of how many goals a team should score. That is it. There is no magic. The value comes from consistency and context.
Shot location and angle do most of the heavy lifting. Shots from the slot go in more often than shots from the boards. That part is obvious. What separates strong models from weak ones is everything around the shot. Pre-shot movement matters a lot. East-west passes force goalies to move and open holes. Rebounds are dangerous because goalies are out of position. Rush chances catch defenses flat-footed. Traffic and screens matter because goalies cannot stop what they cannot see.
Goalies and teams matter too. Some goalies consistently save more than expected. Some defenses suppress high-danger looks better than others. Those effects are not noise, but they need to be handled carefully because short-term results can be misleading.
For betting purposes, xG is not about flexing post-game charts. It is about forecasting future outcomes. The workflow is simple in theory. Model shot quality. Aggregate to team expected goals. Simulate game results. Convert those simulations into fair odds. Compare to the market. Bet when the edge is real.
At ATSwins, this logic runs under the hood of moneyline, totals, and player prop projections. The sections below break down how that engine is built.
Data Pipeline and Features: Getting to a Clean Training Set
Everything starts with clean data. A fancy model on messy inputs will fail every time.
You begin by pulling structured play-by-play data across multiple seasons. Each game needs a unique identifier so shots can be grouped properly. For every shot attempt, you want timestamp, team, shooter, goalie, strength state, and location coordinates. Context events like penalties, faceoffs, and zone entries help later.
Raw data should always be stored by game and date in its original format. Do not overwrite it. Keep a processing log so you know when something failed or changed upstream. That will save you later.
Once you have the raw events, you normalize the rink. Shots need to be flipped so all teams are attacking the same direction in your coordinate system. Distance and angle are then calculated consistently. If a small percentage of shots are missing coordinates, they can be dropped from training without harming results.
Next comes game state tagging. Strength state matters a lot. Five-on-five shots behave very differently from power-play shots. Score effects matter too. Teams trailing late take different risks than teams protecting a lead. Rest and travel add subtle but real effects. Back-to-backs and long road trips show up in shot quality over large samples.
Fatigue is approximated using shift length and recent on-ice time. Even imperfect estimates help. Matchups matter as well. Facing a shutdown defense pair is different than facing a bottom-pair group.
Pre-shot movement flags are critical. Rebounds are identified when shots occur within seconds and close distance of one another. Rush chances are tagged based on how quickly the shot follows a zone entry. Lateral movement is flagged when the puck moves east to west immediately before the shot.
Goalie context is added carefully. Each goalie gets an identifier and a rolling performance measure that is heavily shrunk toward long-term averages. Starting on short rest is also flagged.
Labels are straightforward. Every shot attempt becomes a binary outcome. Goal or no goal. Empty-net shots are excluded because they do not reflect normal scoring context. Shootout attempts are excluded entirely.
Most importantly, data is split by date, not randomly. Training on future shots and validating on past shots is the fastest way to fool yourself. Rolling time splits keep everything honest.
Modeling Core: From Shot xG to Team Totals
A simple logistic regression is the best starting point. It predicts the probability that a shot becomes a goal based on the features you built. With regularization, it stays stable and interpretable. You can see if coefficients make sense. Distance should lower probability. Rebounds should increase it.
Diagnostics matter more than raw accuracy. Brier score and log loss tell you how well probabilities match reality. Calibration curves show whether a predicted 10 percent shot actually scores about 10 percent of the time.
Once the baseline is solid, gradient boosting can capture nonlinear interactions. Angle and distance interact. Rush chances interact with shot type. Boosting often improves raw accuracy, but it usually needs calibration afterward.
Goalie and team effects are added with caution. Raw goalie stats are noisy. Shrinkage is essential. One approach is to estimate residual performance relative to expected goals and shrink those values toward zero. That adjustment can be applied at aggregation time rather than per shot.
After every shot has an xG value, the model rolls them up. Sum expected goals for each team in each game. That gives you team-level expectations.
To translate xG into outcomes, you simulate scoring. The simplest method uses Poisson distributions for each team’s goals. While real hockey scoring is not perfectly independent, this approach works well enough when calibrated.
Run tens of thousands of simulations per game. From those, you get win probabilities, totals distributions, and regulation outcomes. These are the numbers you actually bet with.
From xG to Edges: Pricing, EV, Bankroll, and Bet Sizing
Probabilities mean nothing until they are priced.
Once you have a win probability, converting to fair odds is straightforward. The inverse of probability gives decimal odds, which are then converted to American format. That fair price is compared to the market.
If your fair line is meaningfully better than what is being offered, you have an edge. If not, you pass. Simple.
Totals work the same way. You calculate the probability of the game finishing over or under each posted number. Those probabilities convert to fair prices.
Expected value is calculated per unit risked. You should set a minimum edge threshold to account for uncertainty and slippage. Marginal edges are not worth forcing.
Bet sizing follows fractional Kelly. Full Kelly is too volatile for real betting. Using a fraction smooths drawdowns and keeps bankroll growth stable. Stakes are capped to avoid overexposure.
Timing matters. Goalie confirmation can swing prices significantly. If the starter changes late, the entire projection can flip. Thin edges disappear quickly once limits tighten.
At ATSwins, these rules are baked into how picks and confidence tiers are generated. The goal is consistency, not action for action’s sake.
Production and Monitoring: Making It Reliable Day After Day
A good model that is not monitored will drift and fail.
Daily automation pulls new games, updates team and goalie context, and processes projected lineups. Rest, travel, and injuries are refreshed before inference runs.
Lineup verification is critical. Goalie swaps require immediate re-runs. High-impact scratches change ice time distributions and therefore xG.
Calibration is checked weekly. If predicted probabilities drift away from reality, recalibration is applied. Segment checks catch issues that hide in aggregates.
Rolling retrains incorporate new data without overreacting to noise. Multiple training windows can be averaged to stabilize projections.
Everything is versioned. Features, models, and outputs are logged. If something breaks, rollback is immediate.
Responsible wagering rules are enforced. Exposure caps, pause rules on chaotic news days, and strict bet limits keep variance from spiraling.
Step-by-Step: Getting From Zero to First Bets in a Weekend
Start with a few seasons of historical data. Normalize shot locations and compute distance and angle. Tag basic context like strength state and rebounds.
Train a basic logistic regression on even-strength shots. Evaluate calibration and error metrics. Add simple scaling if needed.
Expand features slowly. Add special teams, score effects, and goalie context. Re-evaluate at every step.
Introduce a boosted model only after the baseline is solid. Check that improvements show up in validation, not just training.
Aggregate to team xG and simulate outcomes. Generate fair prices and compare them to available markets.
Paper trade for a week. Track error and variance. Adjust thresholds if swings are too large.
Once stable, automate the process and log everything.
Practical Tips From the ATSwins Workflow
Power-play modeling deserves special attention. Treat it separately from even strength.
Never finalize plays before goalie confirmation. If uncertainty remains, blend projections rather than guessing.
Avoid overreacting to short goalie runs. Shrink aggressively.
Watch for rink bias. Some buildings consistently skew coordinates.
Double-check injury news. Missing defensemen matter more than missing depth forwards.
A Quick Comparison of Model Options
Logistic regression is fast, interpretable, and stable, but it misses complex interactions. Gradient boosting captures those interactions but needs careful calibration. Hierarchical approaches handle goalie and team effects cleanly but require heavier monitoring. The best choice is the simplest model that produces reliable betting edges.
Reality Checks and Common Pitfalls
Strong historical metrics do not guarantee betting success. Market alignment matters.
Ignoring penalties and pace can break totals projections.
Using closing lines in backtests inflates results.
Skipping calibration compounds errors.
Over-betting edges destroys bankrolls faster than bad picks.
Extending to Player Props
Shot-level xG makes player props easier. Expected shot volume combined with shot quality gives goal probabilities. Ice time, usage, and matchup adjustments refine it further.
Shots on goal props are modeled through expected attempts adjusted for game state.
These projections plug directly into ATSwins player prop tools and highlight discrepancies worth attacking.
Notes on Data Quality and Maintainability
Raw data stays immutable. Fix errors downstream.
Model versions and metrics are logged simply.
Daily sanity checks catch silent failures before they cost money.
Where This Fits for ATSwins Users
ATSwins users benefit from transparent projections, profit tracking, and education. Seeing how xG responds to lineup news teaches market timing, not just picks.
Conclusion
NHL betting gets easier when you stop betting vibes and start pricing shots. Expected goals, goalie context, and game state turn chaos into probabilities. From there, it is just math, discipline, and patience.
Track results honestly. Compare your numbers to the market. Learn where your edge is real.
ATSwins brings these ideas together into an AI-powered sports prediction platform with data-driven picks, player props, betting splits, and profit tracking across NFL, NBA, MLB, NHL, and NCAA. Free and paid plans help bettors make smarter, more informed decisions without drowning in noise.
Frequently Asked Questions
What is an NHL expected goals betting model in plain terms?
It estimates how likely each shot is to score based on context. Those probabilities add up to team expectations, which translate into betting prices.
How accurate can an xG betting model be?
When calibrated, it should match reality over large samples and stay competitive with market prices.
How does ATSwins use this?
ATSwins blends xG models with broader context to deliver picks, props, and transparent tracking that helps bettors understand both risk and reward.
Related Posts
AI For Sports Prediction - Bet Smarter and Win More
AI Football Betting Tools - How They Make Winning Easier
Bet Like a Pro in 2025 with Sports AI Prediction Tools
Sources
The Game Changer: How AI Is Transforming The World Of Sports Gambling
AI and the Bookie: How Artificial Intelligence is Helping Transform Sports Betting
How to Use AI for Sports Betting
Keywords:
MLB AI predictions atswins
ai mlb predictions atswins
NBA AI predictions atswins
basketball ai prediction atswins
NFL ai prediction atswins