

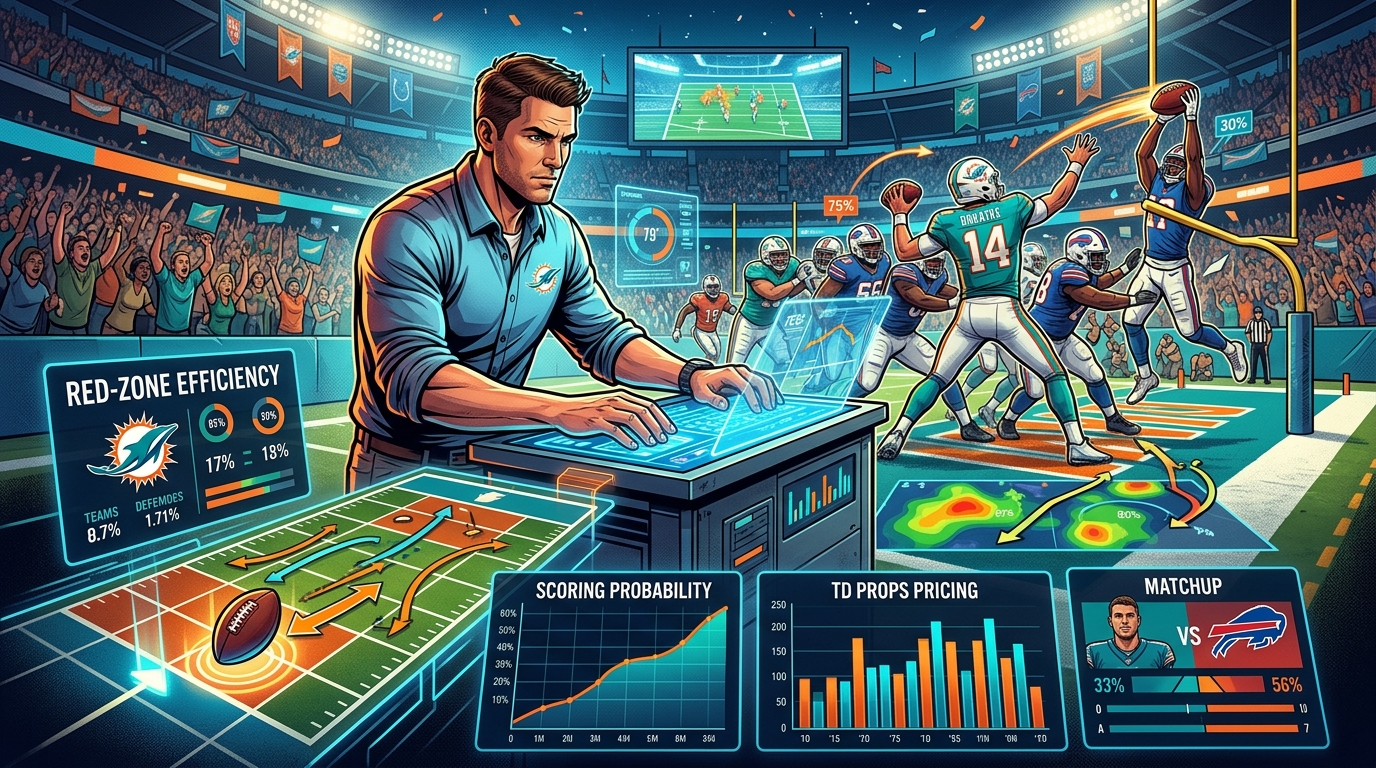
NFL team touchdown props look simple on the surface.
A sportsbook puts up a number, such as 2.5 touchdowns, and you decide whether the team will score three or more. Take the Under, and you're betting that it finishes with two touchdowns or fewer.
The rules are easy.
Figuring out whether the number is actually worth betting is where things get interesting.
A team averaging three touchdowns per game isn't automatically an Over 2.5 candidate. That average doesn't tell you much about the defense it is facing, how many possessions it should get, whether its quarterback is healthy, or whether the game is likely to be played at a fast or slow pace.
Even the team's recent scoring numbers can be misleading.
Maybe those touchdowns came against several weak defenses. Maybe the team benefited from short fields created by turnovers. Maybe it has been unusually efficient inside the red zone and is unlikely to maintain that conversion rate.
On the other side, a team averaging only two touchdowns per game might be worth a closer look if it is entering a favorable matchup.
That's the important part of NFL team touchdown props: the upcoming game matters more than the headline average.
A useful projection needs to look at the conditions surrounding the game. Expected possessions, offensive efficiency, defensive performance, red-zone opportunities, injuries, weather, turnovers, field position, and game script can all influence how many times a team reaches the end zone.
Rather than trying to predict one exact number, it makes more sense to think in terms of probabilities.
If a team has a 2.5 touchdown projection, for example, that doesn't mean it will score exactly 2.5 touchdowns. Obviously, that's impossible. The projection represents the center of a range of potential outcomes.
The real question is whether the team has a strong enough probability of reaching the posted line to make the market interesting.
Table of Contents
How NFL Team Touchdown Props Work
What Drives Team Touchdown Projections
Why Red-Zone Efficiency Matters
How Game Script Changes Touchdown Potential
Building a Team Touchdown Projection
Why Touchdown Distributions Matter
Common Mistakes to Avoid
How ATSwins Approaches NFL Touchdown Props
A Practical Way to Evaluate Team TD Props
Frequently Asked Questions
Using Probability to Evaluate NFL Team TD Props
How NFL Team Touchdown Props Work
A team touchdown prop is based on the number of touchdowns an entire team scores in a game.
That's different from a player touchdown prop, where the focus is on whether a specific quarterback, running back, receiver, or tight end finds the end zone.
With a team prop, there are multiple ways to get there.
Suppose a sportsbook lists a team's touchdown total at 1.5. An Over ticket needs at least two touchdowns. An Under ticket cashes if the team scores zero or one.
Move the line to 2.5, and the Over needs three touchdowns.
At 3.5, it needs four.
The number is straightforward, but the price attached to that number matters just as much.
Imagine a model estimates that a team has a 58% chance of scoring at least three touchdowns. If the sportsbook's price is effectively asking you to bet on a probability closer to 50%, there may be a difference between the model's estimate and the market's expectation.
That doesn't mean three touchdowns are guaranteed.
They aren't.
NFL games are too unpredictable for that kind of certainty. A turnover can completely change field position. A defensive touchdown can add seven points without the offense doing anything. A goal-line fumble can wipe out a scoring opportunity that looked almost certain.
The goal isn't to remove that uncertainty.
It's to estimate it.
That's why a good team touchdown projection should consider several possible outcomes instead of focusing on one predicted total.
What Drives Team Touchdown Projections
Looking at a team's scoring average is a reasonable place to start, but it shouldn't be where the analysis ends.
The more useful question is what the offense is likely to experience in this particular matchup.
There are two broad pieces to think about: opportunity and efficiency.
How often will the team have the ball?
And how well is it expected to use those possessions?
Expected Possessions
A team can't score a touchdown without getting the football.
That sounds almost too obvious to mention, but possession volume can have a meaningful impact on team touchdown props.
Consider two different games.
In one, both teams play quickly, run a high number of offensive plays, and regularly push the pace. That environment could produce 11 or 12 possessions for each offense.
In another, both teams prefer a slower approach and rely heavily on long drives. There may be considerably fewer possessions.
Even if the offense performs at the same efficiency level in both games, the scoring expectation can change because the number of opportunities is different.
Field position adds another layer.
A drive beginning at a team's own 10-yard line isn't equivalent to one starting near midfield. Turnovers, fourth-down decisions, special teams plays, and defensive stops can all affect where an offense starts its next possession.
When projecting possessions, it can be useful to consider offensive pace, opponent pace, expected play volume, third-down performance, turnover tendencies, and likely game flow.
If a team normally gets around 10 possessions but is projected to get 12 in a particular matchup, those extra opportunities could be important when the touchdown line sits close to a key threshold.
Offensive Efficiency
Having the ball isn't enough.
The offense has to move it.
This is where offensive efficiency becomes important. Instead of looking only at yards or points, a projection can examine how consistently an offense creates successful plays and maintains drives.
Early-down performance is particularly useful because staying ahead of the chains gives an offense more manageable situations later in the drive.
Explosive-play ability matters too. An offense capable of producing chunk gains can reach scoring territory quickly, while a team that depends almost entirely on long, sustained drives may have a different scoring profile.
Passing efficiency, rushing efficiency, pressure allowed, sack rate, and turnover tendencies can all play a role.
The basic idea is simple: estimate how effectively the offense should turn its possessions into meaningful scoring opportunities.
Opponent Defense
The defense on the other side of the matchup can change everything.
An offense averaging 3.1 touchdowns against average or below-average defenses shouldn't necessarily be projected to score three touchdowns against an elite unit.
A strong defense may limit explosive plays, create pressure, force third-and-long situations, and make the offense work for every yard.
The opposite can also happen.
A mediocre offense might suddenly become much more attractive when it faces a defense that struggles to pressure the quarterback, gives up explosive plays, or has difficulty stopping teams in the red zone.
This is why opponent adjustment is so important.
Two teams can have similar scoring averages while being completely different offensive units. Their schedules may have been different, their opponents may have defended them differently, and their current personnel may not resemble the group that produced those historical numbers.
The matchup needs to be part of the projection.
Injuries and Personnel
Injuries are another area where a simple model can get things wrong.
The quarterback obviously receives a lot of attention, but offensive injuries across the board can influence touchdown expectations.
An injured offensive tackle can affect pass protection and rushing lanes. Losing a running back can change goal-line usage. A missing wide receiver can remove a major source of explosive plays or red-zone targets.
The important thing is not to treat every injury as an identical statistical adjustment.
A backup receiver replacing a player who normally sees a few targets may not move the projection very much.
Losing the quarterback or a dominant offensive lineman is a different story.
The better question is:
How does the absence change the way this offense is expected to operate?
That answer can be more useful than simply adding or subtracting a fixed number from the projection.
Why Red-Zone Efficiency Matters
Moving the football is one thing.
Finishing the drive is another.
That's why red-zone performance deserves a significant place in NFL team touchdown projections.
A team can consistently move the ball between the 20-yard lines and still struggle to finish drives with touchdowns. Another offense may produce fewer yards overall but be excellent once it gets close to the goal line.
A useful simplified framework is:
Expected touchdowns = expected red-zone opportunities × expected touchdown conversion rate
It isn't a complete forecasting formula, but it helps explain the relationship.
Suppose one team reaches the red zone six times and converts four of those trips into touchdowns.
Another team gets there only four times but scores touchdowns on three trips.
The first offense is creating more opportunities.
The second is finishing at a higher rate.
Both characteristics matter when you're trying to estimate future touchdown production.
Don't Overvalue Small Samples
Red-zone numbers can become misleading when the sample is small.
A team that has scored touchdowns on eight of its first ten red-zone possessions might show an 80% conversion rate. That's an impressive number, but it doesn't necessarily mean the offense is going to maintain an 80% rate all season.
A handful of drives can dramatically change the percentage.
Penalties, turnovers, failed fourth downs, play-calling decisions, and simple variance can all influence the results.
That's where regression becomes important.
If an offense has been unusually efficient in the red zone, some of that success may be legitimate. But some may also be temporary.
The same applies to an offense that has been unusually poor.
A team converting only 35% of its red-zone opportunities might genuinely have finishing problems. It could also be a team whose underlying offensive performance is better than its touchdown results suggest.
That's why red-zone efficiency works best when combined with broader offensive and defensive data.
How Game Script Changes Touchdown Potential
Game script is one of the easiest factors to overlook.
A team doesn't play the same way when it is leading by three touchdowns as it does when it is trailing by two scores.
Imagine a strong favorite takes an early 17-point lead.
The offense may become more conservative. The running game could receive more work. The coaching staff may prioritize clock control and limiting turnovers.
That could lead to fewer overall plays, but it might also create valuable goal-line situations.
Now flip the situation.
The favorite falls behind early.
The offense may increase its passing volume and play at a faster pace. More aggressive play-calling can create explosive opportunities, but it can also lead to sacks, incompletions, and turnovers.
Neither situation automatically points to an Over or Under.
The important thing is understanding how the expected game script changes opportunity.
This is also why projected points can't simply be divided by six to estimate touchdowns.
A team projected to score 27 points might reach that total through three touchdowns and two field goals. It could score four touchdowns and one field goal. A defensive touchdown could contribute to the total as well.
The same point projection can produce very different touchdown distributions.
Building a Team Touchdown Projection
A practical model can begin with an expected touchdown rate and then adjust that number for the specific matchup.
For example, imagine a team has a projected touchdown mean of 2.6.
Again, that doesn't mean anyone expects the team to score 2.6 touchdowns.
It means the model believes the team's scoring outcomes should center around that level.
The team might score zero, one, two, three, four, or even five touchdowns.
The useful part comes from estimating how likely each outcome is.
A simplified distribution might look something like this:
0 touchdowns: 7%
1 touchdown: 19%
2 touchdowns: 25%
3 touchdowns: 22%
4 touchdowns: 14%
5+ touchdowns: 13%
Now suppose the sportsbook posts 2.5 touchdowns.
The Over doesn't care that the mean is 2.6.
It cares about the probability of reaching three or more touchdowns.
In this example, that's roughly 49%.
If the market price implies a substantially lower probability, there could be value. If the market price implies a higher probability, the Over may not be attractive even though the model's average sits above the line.
That distinction is extremely important.
Why Touchdown Distributions Matter
Two teams can have exactly the same projected touchdown average and still have very different probabilities of going Over.
Imagine Team A and Team B both have a mean projection of 2.5 touchdowns.
Team A might have a relatively narrow distribution. Most simulations could finish around two or three touchdowns.
Team B might be much more volatile. It could have a greater chance of scoring one touchdown or four touchdowns.
The averages are identical.
The Over 2.5 probabilities don't have to be.
This is one reason simulation can be particularly useful for NFL team touchdown props.
Instead of forcing every matchup into a single number, a simulation can run thousands of possible game scenarios.
Each scenario can incorporate different combinations of possessions, efficiency, field position, turnovers, defensive performance, injuries, weather, and game script.
Once enough simulations are completed, you can see how often each touchdown outcome occurs.
That provides a much better picture of the risk surrounding the market.
Common Mistakes to Avoid
Mistake 1: Treating the Season Average as the Prediction
If a team averages three touchdowns per game, it doesn't mean it has a three-touchdown expectation in its next game.
The upcoming opponent may be significantly better.
The pace could be slower.
The quarterback could be dealing with an injury.
The weather could be poor.
The team may also be projected to have fewer possessions.
Historical averages provide context. They aren't a substitute for matchup analysis.
Mistake 2: Dividing Points by Six
A projected 30 points doesn't automatically equal five touchdowns.
Field goals matter. Defensive scores matter. Two-point conversions can alter the relationship between points and touchdowns.
A proper touchdown projection should estimate how those points are likely to be generated rather than assuming every six points come from an offensive touchdown.
Mistake 3: Chasing Last Week's Result
A team that scored five touchdowns last Sunday isn't automatically going to score five again.
Maybe it got three short fields from turnovers.
Maybe it scored on a long defensive return.
Maybe it converted nearly every red-zone opportunity.
Those things can happen without becoming the team's normal baseline.
The same principle applies after a disappointing offensive performance. One touchdown doesn't necessarily mean an offense has suddenly become bad.
Look for a real change in performance before making a major adjustment.
Mistake 4: Ignoring Injuries
Personnel changes can alter an entire offense.
Don't just look at the quarterback designation. Check the offensive line, running back room, receivers, and tight ends.
A missing player who handles a large percentage of goal-line work may matter more to a touchdown prop than a player with a larger overall snap count but little red-zone involvement.
Mistake 5: Treating Weather as an Automatic Under
Bad weather gets too much credit as an automatic reason to bet an Under.
Wind, rain, and poor field conditions can certainly affect offensive efficiency, but the impact depends on the teams involved.
A run-heavy offense may be less affected by wind than a pass-heavy offense. A defense that struggles against the run may actually make the weather less relevant to the favorite's touchdown projection.
Weather should be an adjustment, not a conclusion.
How ATSwins Approaches NFL Touchdown Props
ATSwins takes a broader statistical approach to NFL forecasting instead of building a projection around one headline statistic.
That matters with team touchdown props because scoring is the result of several connected events.
The offense needs possessions. Those possessions need to produce productive drives. The team needs to reach scoring territory, and then it has to finish those opportunities.
Along the way, plenty can go wrong.
A sack can kill a drive.
A turnover can erase a scoring opportunity.
A penalty can extend a possession.
A defensive turnover can suddenly give an offense a short field.
That's why a useful projection needs to consider the entire game environment.
Opponent-adjusted offensive efficiency, defensive performance, pressure, expected pace, red-zone trends, injuries, weather, rest, travel, and game expectations can all contribute to the final projection.
Player usage matters as well.
Quarterback performance affects the entire offense. Running back workload can influence short-yardage and goal-line situations. Receiver availability can change the way a team attacks a defense.
These factors are connected.
The goal isn't to claim that a model knows exactly how many touchdowns a team will score.
It doesn't.
The goal is to estimate the range of likely outcomes and determine how often the team crosses the market's threshold.
That distinction is important when looking at ATSwins or any other statistical approach to NFL betting.
A prediction is not a guarantee.
It's a probability estimate.
A Practical Way to Evaluate Team TD Props
Start with the number the sportsbook is offering.
If the line is 2.5, your primary question should be:
What is the probability that this team scores at least three touchdowns?
Don't start with whether you "like" the offense.
Start with the threshold.
Then work through the matchup.
How many possessions is the team expected to get?
How efficient should the offense be?
How strong is the opposing defense?
Does that defense create pressure?
Can it stop explosive plays?
How often does it allow opponents to reach the red zone?
How well does it finish drives once teams get there?
Then consider game script.
Is this likely to be a close game?
Is one team expected to control the game?
Could the underdog be forced into a pass-heavy comeback?
Could the favorite slow down in the second half?
Those possibilities can change both volume and efficiency.
Next, check injuries and weather.
A quarterback change can be enormous. A missing offensive tackle can matter. So can the absence of a primary red-zone target.
Weather should be considered in the same way: as one part of the projection rather than a standalone betting signal.
Finally, compare the estimated probability with the market price.
This is where the analysis becomes useful.
Suppose your model projects 2.8 touchdowns.
That number alone doesn't tell you whether the Over 2.5 is a good bet.
You need to know how the projection is distributed.
If the team has only a 53% chance of scoring three or more, the situation is very different from one where it has a 68% chance.
The average doesn't tell you that.
A useful framework is:
Team strength → matchup → possessions → scoring opportunities → touchdown conversion → outcome distribution → market price
That sequence keeps the focus where it belongs.
You aren't trying to guess the exact final score.
You're trying to understand the probability of crossing a specific betting threshold.
Frequently Asked Questions
What are NFL team touchdown props?
NFL team touchdown props are betting markets based on how many touchdowns a specific team scores during a game.
For example, an Over 2.5 team touchdown prop requires the team to score at least three touchdowns. An Under 2.5 requires two or fewer.
Always check the sportsbook's individual market rules before placing a wager.
How do you predict NFL team touchdowns?
A projection can combine expected possessions, offensive efficiency, defensive strength, red-zone performance, game script, injuries, weather, field position, and turnover expectations.
A statistical model can then estimate both an expected touchdown total and the probability of different scoring outcomes.
That is generally more useful than relying on a team's season average alone.
Does red-zone efficiency matter?
Yes, but it shouldn't be considered in isolation.
An offense needs to reach the red zone before it can benefit from its red-zone conversion rate.
A team reaching the red zone seven times with a 55% touchdown rate may have more scoring potential than a team reaching it three times with a 70% rate.
Opportunity and efficiency work together.
Are NFL team touchdown props volatile?
Yes.
Touchdowns are relatively low-frequency events, so individual games can vary considerably from the projection.
A team projected for three touchdowns can finish with one, while another game can produce five.
Turnovers, field position, explosive plays, goal-line decisions, penalties, and defensive scores can all create significant swings.
Can AI predict NFL team touchdown totals?
AI and statistical models can estimate touchdown probabilities by combining large amounts of data and simulating potential game outcomes.
They cannot eliminate uncertainty.
The quality of the result depends on the data being used, the assumptions behind the model, proper testing, and how well the system adapts to changing teams, players, and game conditions.
Is a team's average touchdown total enough?
No.
A season average provides useful historical context, but it doesn't account for the specific matchup.
A high-scoring offense can have a poor touchdown outlook against an elite defense, while an average offense may have a much better opportunity against a defense that consistently gives up scoring chances.
Why do expected possessions matter?
Possessions create opportunities.
An offense projected for 12 possessions generally has more chances to score than one projected for eight or nine.
But the quality of those possessions matters too. A drive starting at the opponent's 30-yard line is obviously more valuable than one beginning at your own 5.
That's why both possession volume and field position should be considered.
Using Probability to Evaluate NFL Team TD Props
NFL team touchdown props are easy to understand but much harder to evaluate well.
The sportsbook gives you a number.
Your job is to determine how realistic that number is in the matchup.
That requires more than looking at a team's average touchdowns or points per game.
Expected possessions matter because the offense needs opportunities.
Offensive efficiency matters because those opportunities have to turn into productive drives.
The opposing defense matters because not every matchup creates the same scoring environment.
Red-zone performance matters because moving inside the 20 doesn't guarantee a touchdown.
Game script matters because teams behave differently when they're leading, trailing, or playing in a close game.
Injuries matter because personnel changes can alter the entire offensive approach.
Weather can matter because certain conditions affect some offenses more than others.
And simulation matters because a single average can hide the range of outcomes underneath it.
That's the biggest takeaway.
If a team has a projected average of 2.6 touchdowns, don't immediately assume the Over 2.5 is the right side.
Ask how often the team reaches three.
If the line moves from 2.5 to 3.5, the question changes again. Now you're interested in the probability of reaching four.
The same team can therefore look attractive at one number and unattractive at another.
Price matters too.
A strong offense isn't automatically a good Over bet. If the market has already adjusted for everything you know about that offense, there may be very little value left.
On the other hand, an average offense can become interesting when the matchup creates more opportunities than the market appears to expect.
This is where probability-based analysis can help.
ATSwins approaches NFL projections by bringing different pieces of the matchup together rather than relying on a single statistic. The purpose isn't to pretend that football can be predicted perfectly.
It can't.
There will always be randomness.
A tipped pass can become an interception. A fumble can create a short field. A fourth-down decision can completely change a drive. A defensive touchdown can turn an ordinary game into a high-scoring one in seconds.
No model can account perfectly for every one of those events.
What a good model can do is organize the information, estimate probabilities, and provide a consistent way to compare those estimates with the betting market.
That's ultimately what makes NFL team touchdown props worth studying.
The goal isn't to know the exact number of touchdowns before kickoff.
It's to understand the range of outcomes that makes sense, identify the probability of crossing the posted line, and decide whether the market price reflects that probability.
Instead of chasing last week's results, start with the matchup.
Instead of relying entirely on season averages, consider expected possessions and efficiency.
Instead of assuming every projected point becomes a touchdown, look at how the scoring is likely to happen.
And instead of treating one projection as a certainty, look at the full distribution of possible results.
That's a much more realistic way to approach NFL team touchdown props.
Football will always have randomness. That's part of what makes the sport difficult to predict and part of what makes these markets interesting.
The advantage comes from making the uncertainty a little easier to understand.
Estimate the opportunities. Adjust for the matchup. Project the scoring range. Compare the probability with the market.
That's the foundation of a more disciplined approach to NFL team touchdown props.
veral moving parts.
A team needs possessions and productive drives before it can score. The defense it faces can make those drives easier or harder. Once the offense reaches scoring range, red-zone execution becomes important. Injuries, turnovers, weather, and game script can then move the expected outcome in either direction.
That is why a season-long touchdown average isn't enough on its own.
A stronger approach is to estimate a range of possible outcomes and assign probabilities to those outcomes. The market line and price can then be compared with that distribution.
At ATSwins, the focus is on that type of analysis. Rather than treating a projection as a certainty, we look at the underlying data, matchup conditions, probability, simulation, and uncertainty that shape the expected result.
For anyone evaluating NFL team touchdown props, the key question isn't simply which team is likely to score the most. It's whether the estimated probability of a specific touchdown outcome differs meaningfully from what the market price suggests.