

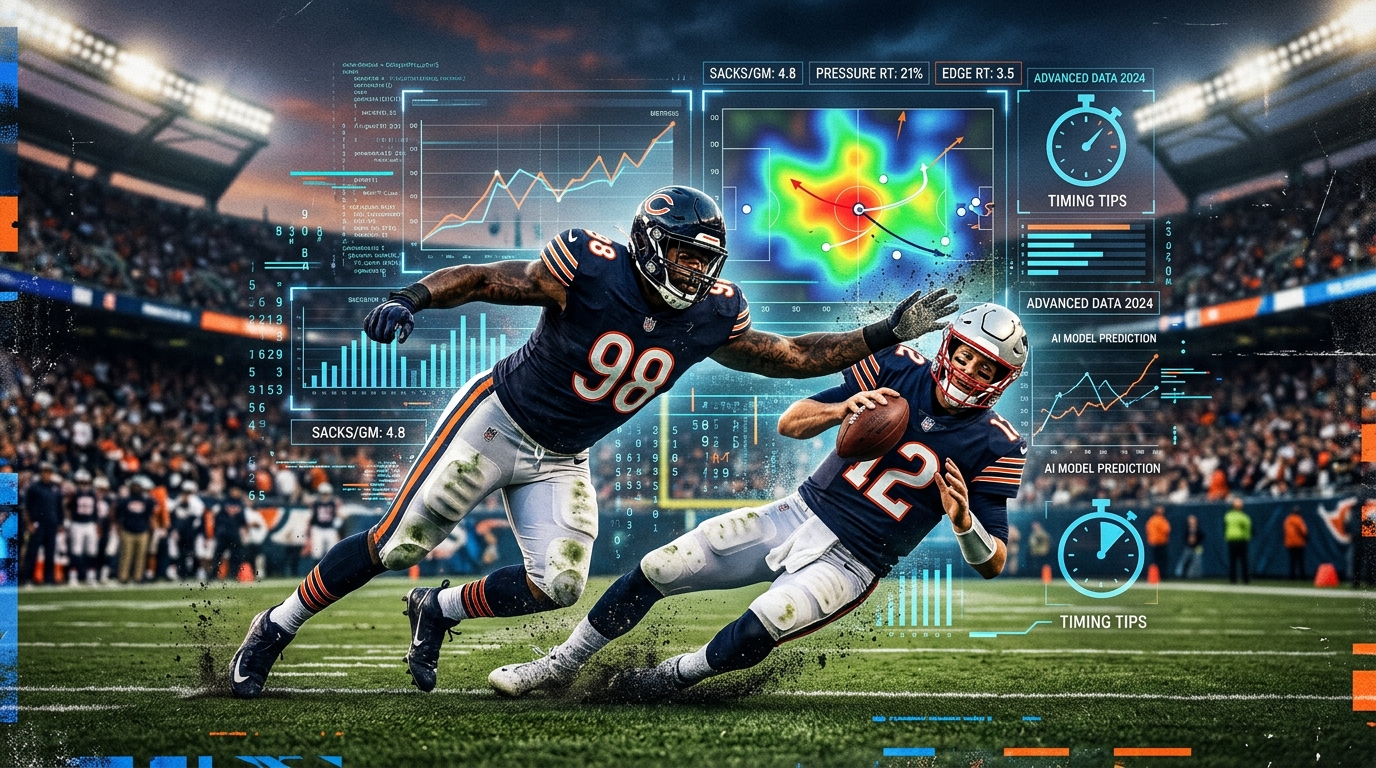
Betting NFL team sacks props is one of those markets where watching football and understanding numbers can work together. A defense can look dominant on film, but that does not automatically mean it will record four or five sacks.
That is why I prefer to build NFL team sacks props around pressure instead of simply looking at recent sack totals. Sacks are the final result. Pressure is the process that creates them.
The goal is not to predict the exact number of sacks. That is too volatile. The goal is to estimate the range of outcomes, compare those probabilities with the betting line, and decide whether the price offers enough value to make a wager.
Table Of Contents
Market basics: what NFL team sacks props really are
What really moves sacks on game day
Modeling and pricing sacks step by step
Building opponent-adjusted components
Creating a weekly NFL team sacks props workflow
Pricing examples from raw inputs to bet decisions
Same-game context and correlations
Practical checks that reduce mistakes
Building a reusable betting template
Timing and execution
Worked micro-case
Common pitfalls
Where ATSwins fits into the process
Frequently Asked Questions
Market basics: what NFL team sacks props really are
NFL team sacks props are wagers on how many times a defense will sack the opposing quarterback during a game.
The market looks simple, but the underlying outcome is not. Sacks are relatively rare events, so they can be extremely volatile. A defense can generate ten pressures and finish with zero sacks.
That is why I start with pressure. Pressure happens more often than sacks, giving us a larger sample.
The betting price matters just as much as the projection. A model predicting 2.8 sacks does not automatically make over 2.5 a good bet.
What really moves sacks on game day
Defensive pressure is the biggest starting point. A defense that consistently wins pass-rush snaps has more chances to create sacks, but the opponent still matters because offensive protection changes from matchup to matchup.
Quarterback time to throw is another major factor. A passer who gets rid of the ball quickly can reduce sack opportunities even when the defensive front is excellent.
Offensive line health can move a projection quickly. Losing a starting left tackle is different from losing a backup guard. Tackles deal directly with elite edge rushers, while centers have a major role in protection communication.
Game script matters too. A team expected to trail may throw more often, creating more pass-rush opportunities. A heavy favorite can also create pressure opportunities after building a lead.
Weather can complicate everything. Strong wind can reduce passing volume and encourage shorter throws. Rain can affect footing and ball handling.
Modeling and pricing sacks step by step
I start by creating an opponent-adjusted pressure estimate. The defensive pressure rate tells me how frequently the defense creates disruption, while the offensive pressure allowed rate tells me how often the opponent allows that disruption.
A simple starting point is to blend the two rates. If the defense creates pressure on 34 percent of dropbacks and the offense allows pressure on 28 percent, the midpoint is 31 percent.
Next, I adjust for injuries and scheme. A starting tackle being ruled out could add a few percentage points to expected pressure.
I then estimate sack-to-pressure conversion. This is the bridge between pressure and actual sacks.
Quarterback time to throw matters here. More time in the pocket generally gives rushers more opportunity to finish.
Once I have pressure and conversion, I estimate expected dropbacks. This is where the spread, total, pace, and projected game script become useful.
The core calculation is:
Expected sacks = pressure rate × sack-to-pressure conversion × expected dropbacks.
Suppose the final pressure estimate is 33 percent, sack-to-pressure conversion is 21 percent, and expected dropbacks are 40.
That number is useful, but I also want the probability of two, three, four, or five sacks. A Poisson distribution provides a quick starting point for count outcomes.
If my model says a defense has a 58 percent chance of recording at least three sacks and the market price implies only 52 percent, I have a potential edge.
Building opponent-adjusted components
The quality of the inputs matters more than the complexity of the formula.
For defensive pressure, I like using season-long performance while giving some weight to recent games.
The same applies to offensive pressure allowed. A team that gives up seven sacks one week does not automatically have the worst offensive line in football.
Position-specific injuries deserve special attention. If a starting tackle is unavailable, I want to know who replaces him and which defender is likely to attack that matchup.
Quarterback tendencies should also become numbers. A passer with a quick release may reduce sack conversion, while a quarterback with a high time-to-throw figure may create more opportunities.
Game script should be estimated before kickoff. The spread gives a useful starting point. A team favored by a touchdown is generally more likely to play with a lead than a substantial underdog.
I also pay attention to pass rate over expectation and pace. A fast offense creates more total plays, while a pass-heavy offense creates more direct sack opportunities.
Creating a weekly NFL team sacks props workflow
My weekly process starts with the baseline. I update defensive pressure, offensive pressure allowed, quarterback tendencies, offensive line performance, pace, passing tendencies, spread, and total.
During the week, injuries become more important. Practice reports can show whether an offensive tackle is limited or whether a quarterback is dealing with an issue that could affect mobility.
Closer to game time, I focus on confirmation. The final inactive list is especially important because questionable offensive linemen and quarterbacks become official.
Weather gets another review at the same time. A forecast from several days earlier can look very different on game day.
Finally, I compare my fair line with the market. If my model says 3.2 sacks but the market is already heavily juiced toward over 3.5, I may have missed the best price.
Pricing examples from raw inputs to bet decisions
Imagine a defense with a 34 percent pressure rate facing an offense that allows pressure on 29 percent of dropbacks.
A basic pressure estimate might begin around 31.5 percent. The tackle injury could move it higher, so suppose the final pressure projection reaches 33 percent.
Assume a 21 percent sack-to-pressure conversion and 39 expected dropbacks.
If the sportsbook posts over 2.5 at plus money, that could be attractive because the model is above the line and the price gives some protection.
Now consider an alternative line of 3.5 sacks. The mean alone cannot answer whether that is a good bet. I need the probability distribution.
Alternative lines are sensitive to the tail of the distribution, so I do not price them by simply adding a fixed amount to the main line.
That is an important part of betting NFL team sacks props.
Same-game context and correlations
Sacks do not happen in isolation. They are connected to the way a game develops.
A team that falls behind may throw more often. More dropbacks create more sack opportunities.
However, more pass attempts do not automatically mean more sacks. A quick passing offense can throw 45 times while allowing only one sack because the quarterback gets the ball out rapidly.
That is why I do not assume that projected passing volume should produce an equal increase in sacks.
The spread and total provide useful context, but team tendencies make the projection more specific. If an offense regularly uses quick throws when trailing, an increase in dropbacks may not create the same increase in sack opportunities.
Same-game parlays require extra caution. When several bets depend on the same game script, the combined position can become much riskier than it looks.
Practical checks that reduce mistakes
One of the best habits is reviewing old projections. After the game, compare the expected sack mean with the actual result.
I also track closing line value. If I regularly bet over 2.5 at plus money and the market closes at the same number with a much stronger price, that gives me useful evidence that my timing may be creating value.
Another useful check is sensitivity. Change the pressure estimate slightly and see how much the fair probabilities move.
The same applies to injuries. If one player's status changes the expected sack mean by nearly a full sack, I want to know whether that adjustment is truly justified.
Finally, compare your projection with the market. A disagreement is not automatically a problem.
Building a reusable betting template
A simple spreadsheet or model can handle most of this process. I want one area for defensive pressure, offensive pressure allowed, quarterback time to throw, scramble rate, offensive line information, pace, pass rate, spread, total, and weather.
Another section should contain adjustments. This makes it easier to see why the projection changed. If expected sacks move from 2.4 to 3.1, I should be able to identify whether the change came from an injury, quarterback update, weather, or projected volume.
The output should show expected sacks, probabilities for the main line and alternative lines, fair odds, market odds, expected value, and a suggested stake.
I also keep a record of every wager. Over time, the results can reveal weaknesses. If the model is consistently too aggressive against mobile quarterbacks, that should appear in the numbers.
The objective is to make the process repeatable. I do not want a model that only works when I spend hours staring at one matchup.
Timing and execution
Timing can make a good projection more valuable. Early lines sometimes offer numbers before the market fully reacts to injuries or matchup information.
Late-week updates can be useful because practice reports clarify offensive line health.
The final major window is the period before kickoff when inactive players are announced. This is when I want my model ready to run quickly.
Weather can move markets too. If wind expectations increase significantly, passing volume and quarterback behavior may change.
Most importantly, I try not to chase the market. If the line moves through my fair number, the bet may no longer be attractive.
Worked micro-case
Consider a defense with a 33 percent pressure rate facing an offense that allows pressure on 27 percent of dropbacks.
The starting pressure estimate is 30 percent. The tackle injury pushes the projection to approximately 33 percent.
The projected offense is an underdog and is expected to throw around 38 times.
The expected sack mean is therefore about 3.04.
That does not mean three sacks are guaranteed. The defense could record zero, or it could get six.
If my distribution gives the defense a strong probability of three or more sacks, I compare that with the price on over 2.5.
Suppose the main line is over 2.5 at a reasonable price while the 3.5 alternative is also fairly priced.
If the starting tackle unexpectedly becomes active, I immediately reduce the pressure and conversion assumptions. That could move the expected mean from about 3.0 to 2.7.
That is exactly why late injury information matters.
Common pitfalls
The biggest mistake is chasing last week's sack total. A defense recording seven sacks can create a strong narrative, but that performance does not automatically repeat.
Another mistake is treating every offensive line injury equally. Losing a starting tackle can have a different impact from losing a guard, and the replacement quality matters.
Blitz rate can also be misunderstood. More blitzing does not automatically mean more sacks. Aggressive pressure can create quick throws, missed assignments, or explosive plays.
Weather is another area where analysts can overreact. Moderate wind does not guarantee a sack-heavy game.
Finally, staking too aggressively can turn a good model into a bad betting strategy. Even a strong edge can lose several times because sacks are high-variance events.
Where ATSwins fits into the process
ATSwins can fit into this workflow as a practical layer for organizing betting information and keeping the bigger picture in view.
For NFL team sacks props, the key is still understanding the matchup. ATSwins can help make that process easier to organize, especially when I want to compare information, monitor betting trends, and keep track of results over time.
The biggest advantage of an analytics platform is not that it removes uncertainty. It does not.
That is how I approach NFL team sacks props. Start with pressure, adjust for protection and quarterback behavior, estimate volume, build a distribution, compare the probabilities with the price, and then manage the risk.
Frequently Asked Questions
What are NFL team sacks props?
NFL team sacks props are bets on how many sacks a defense will record in a game. The most common version is an over/under line such as 2.5 sacks.
Which stats matter most for NFL team sacks props?
Pressure rate is one of the best starting points because pressure occurs more frequently than sacks. I also consider offensive pressure allowed, quarterback time to throw, scramble rate, offensive line health, pass-rush matchups, expected dropbacks, game script, and weather.
How do injuries affect NFL team sacks props?
Offensive line injuries can have a major effect, especially when a starting tackle is unavailable. The replacement player, the defender likely to attack that matchup, and the quarterback's ability to handle pressure all matter.
Can I build an NFL team sacks props model without advanced software?
Yes. A spreadsheet can be enough for a useful starting model. Estimate pressure, estimate sack conversion, project dropbacks, calculate an expected sack mean, and use a probability distribution to price the over and alternative lines.
How can ATSwins help with NFL team sacks props?
ATSwins provides a broader sports analytics and betting workflow that can support NFL research. Its data-driven picks, player prop information, betting splits, and profit tracking can help bettors organize research and monitor performance.
Conclusion
NFL team sacks props become easier to analyze when you stop treating sacks as a simple average and start thinking about how sacks are created.
My preferred process is to estimate pressure first, convert pressure into expected sacks, project dropbacks, and then use a distribution to calculate the probability of each outcome.
There will always be variance. A defense can dominate a matchup and finish with one sack, while another team can turn a few pressures into a huge number.
The goal is not to eliminate uncertainty.
With a repeatable process, careful injury adjustments, sensible staking, and ATSwins supporting the research and tracking side, NFL team sacks props can become a much more structured market to analyze.
That is the mindset I want to bring into every NFL week. Find the pressure mismatch, understand the protection, estimate the volume, respect the price, and let the numbers make the final decision carefully.