

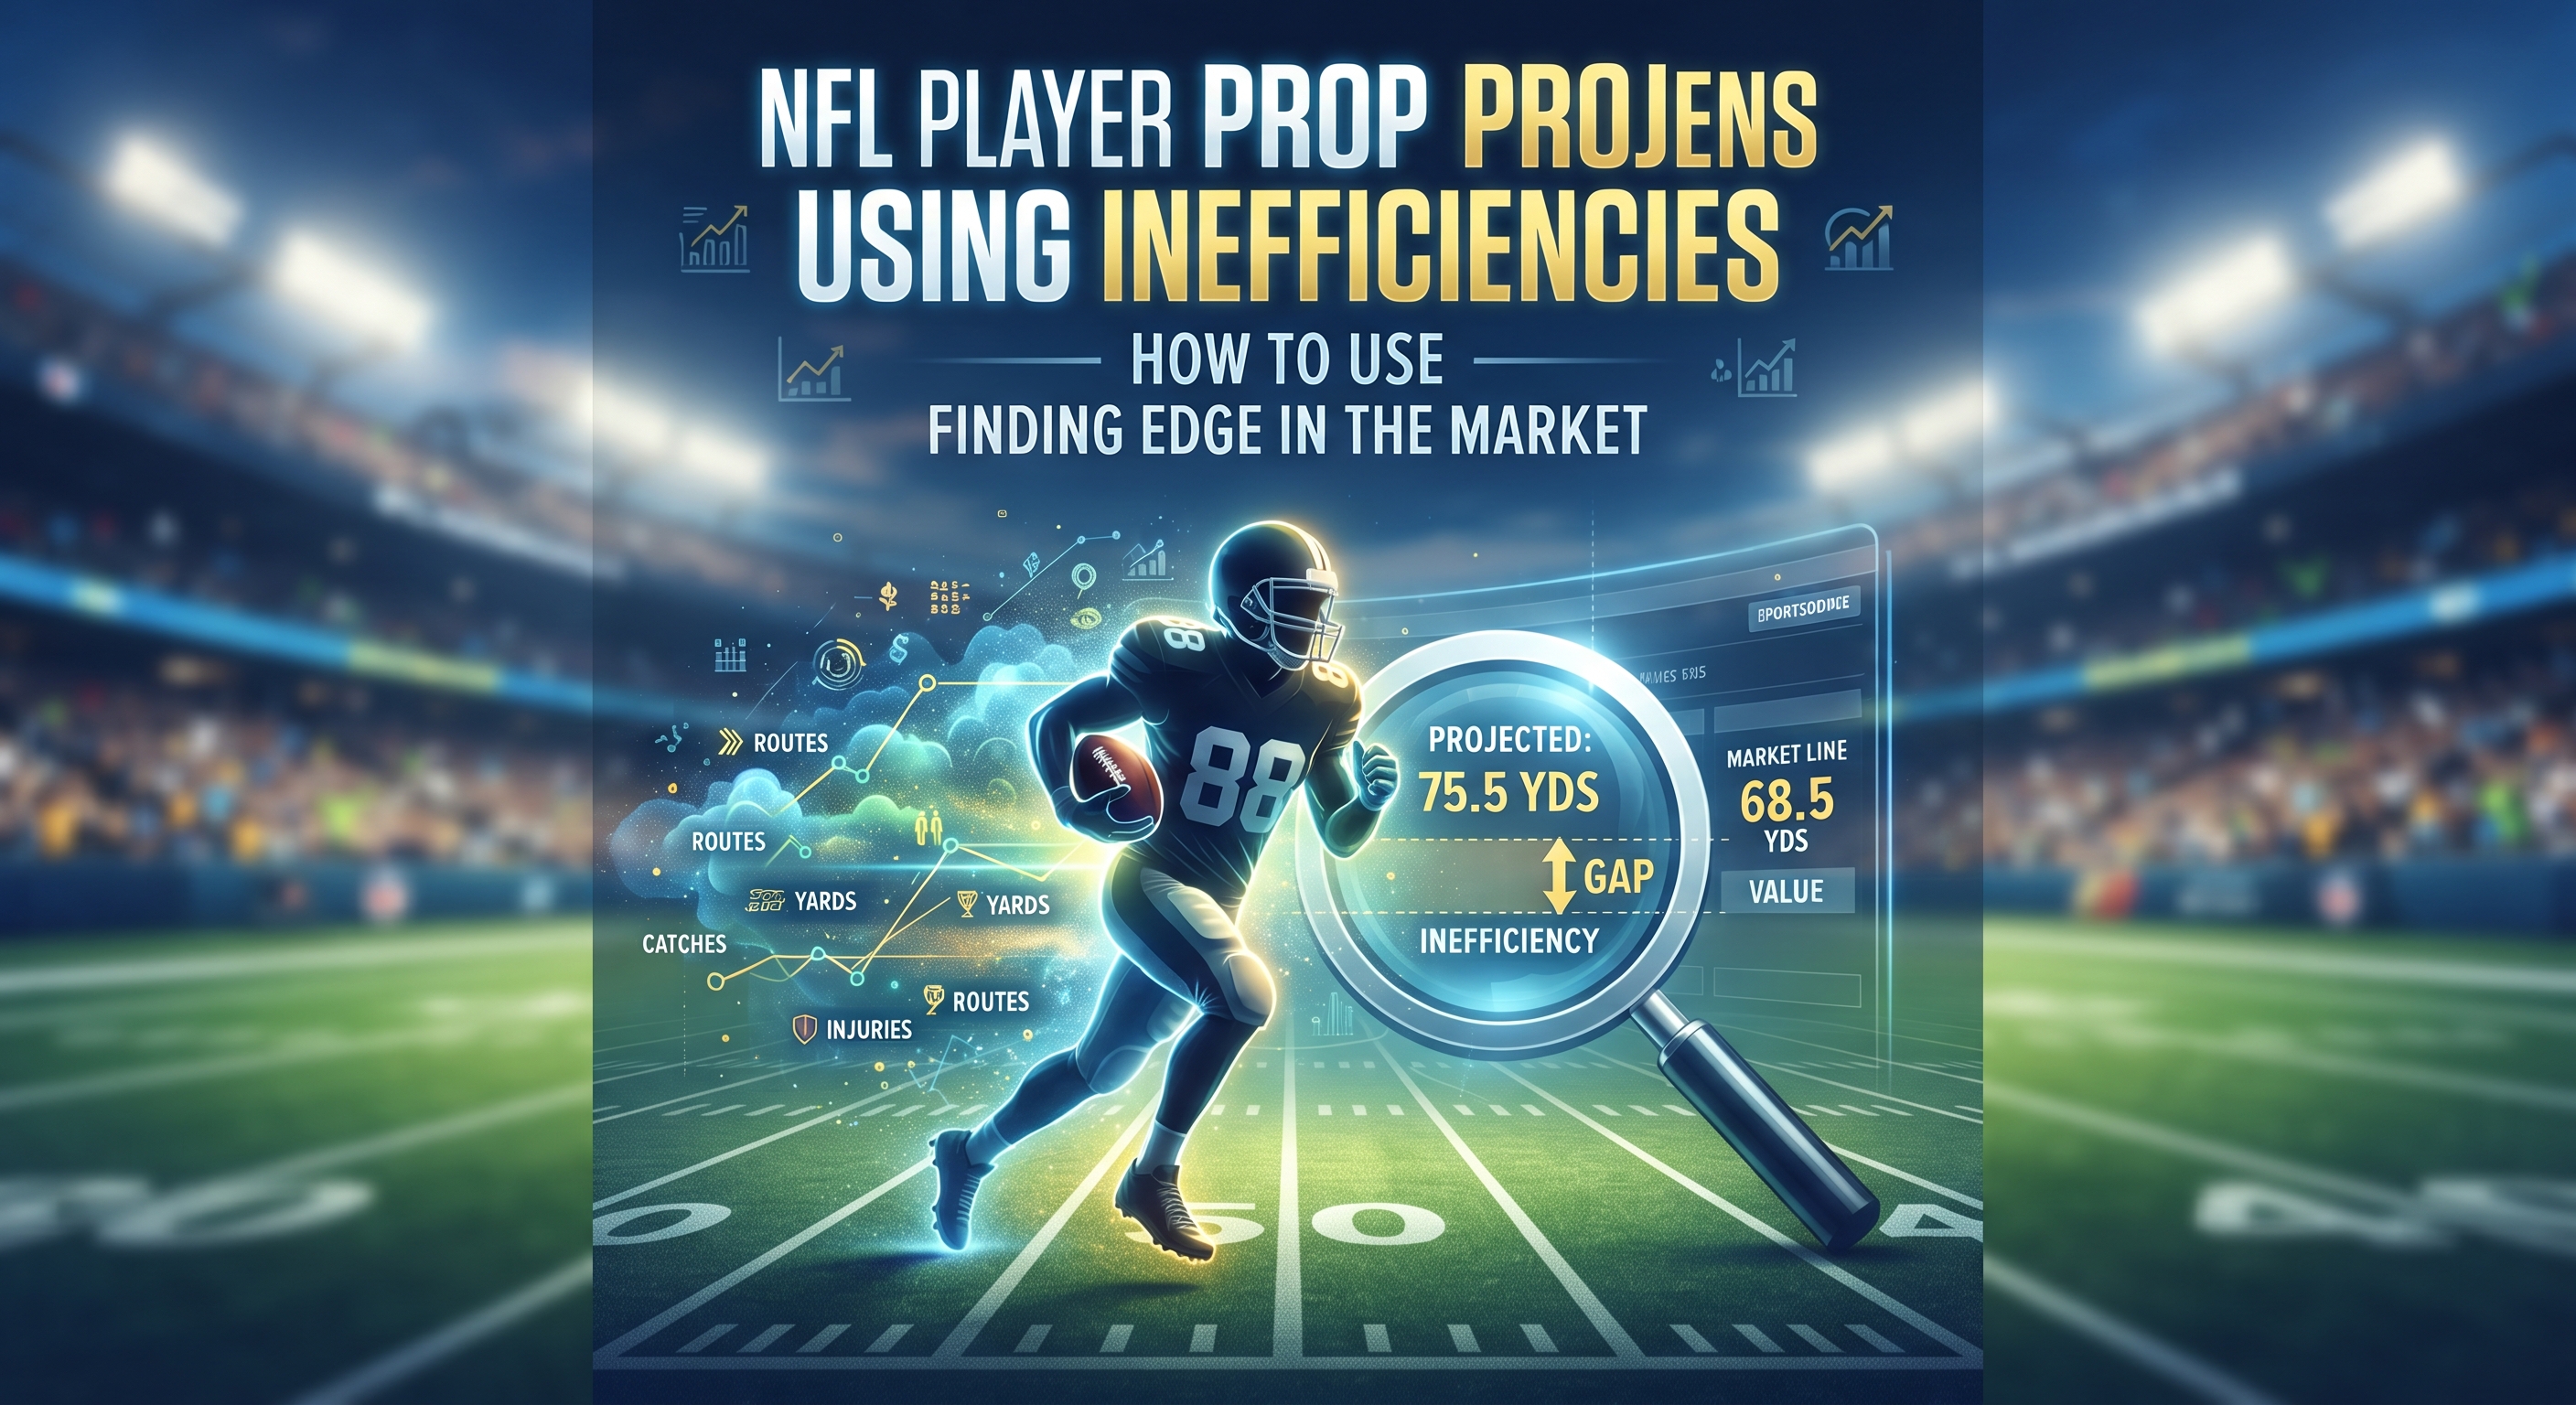
NFL player props are where the math meets the market, but they do not have to feel like a giant spreadsheet. As a pro analyst who builds AI-driven projections, I’ll show you how to turn routes, pace & injury context into clear edges-then time your bets before lines move. The goal is to keep this practical, data-backed, and easy to follow, so you can move when the market gives you a reason to move and avoid forcing bets when it does not.
Player-prop value usually starts with usage: routes run & route share, snap rate, targets per route, aDOT; then layer opponent, pace/PROE, red-zone role, travel and weather. Price it right: simulate distributions (not just averages), translate to fair lines after vig removal, then compare to book juice; stake with fractional Kelly and cap risk. Simple, steady. Timing is alpha-hit slow adjustments early week; then re-check 90–30 mins before kickoff for actives/inactives, weather... and pull back on correlated bets. Track process: log bets, pre/post line moves for CLV, weekly backtests and calibration; build small feedback loops so the model actually learns, and you too. Our expertise at ATSwins.ai: an AI-powered sports prediction platform offering data-driven picks, player props, betting splits, and profit tracking across NFL, NBA, MLB, NHL and NCAA. Free and paid plans give bettors insights and guides to make smarter, more informed decisions.
What “inefficiencies” in NFL player props really mean
The four repeating inefficiencies
Soft lines from stale injury news Books move quickly on headline injuries, but the nuance is often late. A WR going from limited to full, a backup RB trending to start, or a TE quietly ramping up snaps can linger in the market. If the usage delta is material and the book hasn’t fully baked it in, you’ll see a stale median. That’s the classic soft line. Mispriced usage rates Player props hinge on opportunity more than talent. When route share, target per route run, rush share, or red-zone share shift week-to-week because of scheme or depth chart changes, books can lag. This is especially true after bye weeks and coordinator tweaks. Book-specific juice and skew Two books can post the same yardage number but have very different prices, and their alternate ladders often reveal the book’s opinionated skew. That skew matters more than the posted median, because your edge usually lives in the tails. Correlation traps between teammates Betting multiple overs on the same offense looks smart until a run-heavy script or a concentrated target funnel hits. Props are not independent. If you ladder too many correlated overs without accounting for game-flow or QB efficiency, small leaks add up.
Earlier searches may not hand you a universal playbook for “inefficiencies,” so the practical edge comes from primary data, market microstructure, and knowing when books are forced to shade. That last bit is often visible in real time around ai baseball game analysis team beat reports, inactive lists, and cross-book alt ladders.
A fast checklist for spotting inefficiencies
Is there fresh, credible injury/role news that changes snap or route share? Did the team’s pass rate over expectation (PROE) swing in recent weeks? Has the defense’s coverage shell usage changed (e.g., more Cover-2) that alters aDOT distribution? Is there clear book skew in the alt ladder (e.g., 50+ at -110, 70+ at +115 vs market +135)? Are you stacking correlated overs without a script that actually supports it?
Quick examples that pop up every week
Backup RB starts: Underpriced rush attempts and red-zone anytime TD, while the starter’s receiving yards may be over if targets shift to slot WRs on early downs. WR returning to 85%+ routes: Longest reception market is often softer than receptions because the book moves median receptions but under-updates deep target frequency. QB mobility narrative: Books shade rush yards up after one big scramble game; attempts and designed runs might not follow. Under on attempts or alt-unders on yards can have value if the prior was scramble-driven.
Data to power projections fast
Core opportunity and efficiency metrics
Routes run, route share, and snap share Targets per route run (TPRR) and aDOT Team pass rate over expectation (PROE) and pace (seconds per snap) Red-zone carries and targets, inside the 10 usage Defensive coverage tendencies (man/zone rates), pressure rate, and blitz rate Weather (wind, precipitation) and travel/body-clock context Offensive line pass-block win rate and run-blocking continuity For QBs: scramble rate under pressure, designed rush attempts, early vs late-down split Primary sources (free or low-cost) that are reliable: NFL tracking data for route/air separation, speed, alignment, and sometimes pressure context historical game logs and player data for game logs, splits, and historical baselines Open play-by-play via open NFL play-by-play data for PROE, EPA, success rates, and fast ingestion Live injuries at live NFL injury reports: live NFL injury reports Useful complements if you need structured feeds or faster updates nfl player prop edge finder : structured sports data feeds for injury statuses, depth charts, and game stats feeds
Turn raw data into opportunity-based baselines
Think “bottom-up.” Start with how many plays, how those plays divide (pass vs run), who gets the routes/carries, then translate to targets/attempts and yards. Step-by-step: Estimate total plays Base on each team’s season-to-date pace, plus a rolling 3-week adjustment with a small opponent-weighted factor. Include neutral vs trailing pace splits. Convert plays to pass vs run Use team PROE and adjust for opponent pass defense strength and expected game script (spread/total). Example: If the team averages +4% PROE but faces a run-funnel defense, bring it down 1–2%. Allocate routes and carries Routes: Project route share by role (X, Z, slot, TE1) and snap tiers. Use the last 3 games with a decay factor and a prior on career role. Carries: Start with RB1 share plus short-yardage/goal-line notes; adjust if RB2 showed pass-pro bumps or coach quotes suggest a hot-hand plan. Translate routes to targets Targets = Routes × TPRR. Calibrate TPRR using rolling data with context (man vs zone splits; some WRs spike vs man). Include QB tendency for target distribution. Some QBs feed the slot or TE on pressure. Translate targets and carries to yards Receiving yards = Targets × Yards per target (Y/T). Estimate Y/T from aDOT, opponent coverage shell, and player YAC over expected.
Rushing yards = Attempts × Yards per carry with adjustments for opponent front, O-line run block grade, and light/heavy box tendencies. Add red-zone role and TD expectation Compute expected TDs using red-zone shares, team implied total, and inside-the-10 weighted opportunities. Weather and travel Apply wind downgrades to deep aDOT players. Adjust fatigue for West-to-East early kickoffs slightly (small effect; don’t overdo it)
Practical templates you can replicate
Projection sheet columns: Team plays, pass%, run%, pace Routes, route share, TPRR, aDOT Targets, receptions, receiving yards Rush share, attempts, rushing yards Red-zone share, TD expectation Opponent D adjustments (coverage mix, pressure) Weather/travel flags “90-minute window” news checklist (before kick): Inactives verified? Any surprise OL scratches or snap limits? Beat reports on rotation changes? Weather shift vs morning forecast? Market moved? If not, this is your window.
Modeling the distribution, not just the mean
Two-model stack: trees for signal, Bayes for stability
Gradient boosted trees (e.g., XGBoost/LightGBM) to predict per-play efficiency and opportunity variables (TPRR, Y/T, rush YPA) from features: Coverage mix, pressure rate, box counts, alignment, game script Rolling player/team form and opponent adjustments Bayesian hierarchical models to stabilize player-level parameters: Partial pooling on TPRR, Y/T, rush share across players and seasons Priors informed by role archetypes (alpha WR, field-stretcher, slot, bell-cow RB, early-down grinder, pass-catching back) Why both? Trees discover nonlinear interactions, while Bayes keeps fragile sports probability engine small-sample players in check so you don’t overreact to one spike week.
Simulating game paths at scale
For each game, simulate 10,000+ paths: Draw team plays from a distribution centered on projected pace with variance from historical spreads. Draw pass/run splits conditional on game script (simulate score differentials over time). Sample routes/carries based on role volatility (e.g., WR3 route share has higher variance). For each target, draw yards from a distribution parameterized by aDOT and opponent coverage; for each carry, draw yards from a defense- and OL-adjusted distribution. Aggregate per-path props (receptions, yards, attempts, TDs). Convert to probabilities for each sportsbook line: P(Over L), P(Under L), and for alt ladders P(≥ 60), P(≥ 80), etc.
Converting probabilities to fair odds and EV
Vig removal on posted lines: For a two-way market with odds Oover and Ounder (American), convert to implied probabilities pover_imp and punder_imp. Normalize: pover_fair = pover_imp / (pover_imp + punder_imp). Compare to your model pover_model. Your edge on Over = pover_model − pover_fair. EV per unit stake: If price is +120, payoff = 1.2 per 1 risked. EV = pover_model × 1.2 − (1 − pover_model) × 1. Re-apply book-specific hold Books differ in standard holds by market. After finding fair odds, check that your edge persists under their typical hold. Practical step: favor the book with least skew in that prop’s alt ladder.
Calibrating and validating the distributions
Reliability and calibration Bucket predictions by probability and check outcomes (e.g., overs that were 55–60% should hit near 57–58% in backtest). Brier score and log loss for binary outcomes (over vs under) Track by market type (receptions, yards, attempts) to see which you predict best. Closing line value (CLV) If your picks consistently beat the close by 0.5–1.5 yards or 10–20 cents, the process is likely sound, even if variance bites short term.
Example: building fair odds on a WR receiving yards Over 54.5
Simulation results: P(Over 54.5) = 0.57. Book price: -110 on both sides, imply pover_imp ≈ 0.524. Fair pover_fair ≈ 0.524; Edge = 0.57 − 0.524 = 0.046 (4.6%). EV at -110 (risk 1.1 to win 1): EV = 0.57 × 0.909 − 0.43 × 1.1 ≈ 0.518 − 0.473 = +0.045 per $1 risked (4.5% ROI). If another book offers -102, EV jumps; shop it.
Finding and timing edges
Time windows that matter
24–48 hours pre-kick Props open with low limits. Note initial numbers, especially for role questions. Early positions are for CLV if you trust your usage reads. Morning-of Weather updates and beat reporter clarity. Books move a bit but still leave alt ladders sloppy. 90 minutes pre-kick (inactives) This is the gold window. Stale lines live here. Roster confirmations let you push volume edges with confidence. Live markets Pace mismatch is clear in Q1? Halftime props can have edge when first-half variance hides underlying opportunity (e.g., drops suppressing WR receptions despite strong routes/TPRR).
Tactical setups that repeatedly print
Pace and PROE mismatches Fast vs fast creates more plays; even if efficiency is modest, volume props (receptions, attempts) benefit. Slow vs slow compresses volume; unders on fringe players gain. Alt ladders when books shade medians If the main line is about right but the distribution is fat-tailed (deep-threat WRs), compare 50+/70+/90+ pricing. Tails often underpriced on niche players. Derivative props when volume vs efficiency diverge Longest reception: great when aDOT and pressure-induced scramble tendencies align. Books anchor to median receiving yards and miss the single-play upside. Rush attempts vs rush yards: if YPC outlook is poor but game script screams run volume, attempts overs can be cleaner than yards. Reverse is true for explosive RBs in time-share. Cross-book skew hunting If Book A shows +130 at 60+ and Book B shows +150 at 60+ but -110 at 50.5 vs -118 elsewhere, the “shape” of probability distribution differs. You can pick off the best tail and avoid the worse median.
Step-by-step: a same-day “actives window” workflow
Lock injury statuses and snap expectations (RB1 snap %, WR2 routes). Recompute opportunity baselines (plays, pass%, route/carry shares). Run simulations and export per-line probabilities for 3–4 books. Filter for: Edge ≥ 3% on main markets Edge ≥ 5–7% on alts (due to variance) Correlation flags (limit overlapping overs) Place bets, then immediately log lines and limits. Recheck line moves 20–30 minutes later; add if price improves or pull back if news broke against you.
Protecting bankroll and slate-level risk
Fractional Kelly staking Stake = f × Edge / OddsMargin. Most bettors run 0.25–0.5 Kelly for props due to higher variance. Guarding correlations Cap total exposure to one team/game to avoid script whipsaw. If you hold multiple overs in a game, consider small hedges in derivative markets (e.g., QB attempts under if you expect quick blowout with RB volume). Laddering vs spraying Ladder deeper only when the tail case has structural support (aDOT, press-man, wind at back, dome). Spraying ladders on short aDOT slot WRs is usually a leak. Beware macro totals If the full-game total drops 2–3 points late due to wind, trim overs broadly, not just the obvious deep threats.
Ongoing QA and ops
Backtesting that actually surfaces signal
Weekly cohorts Evaluate picks by week and by player archetype. Themes you’ll find: Early-down RB attempts props behave differently than 3rd-down receiving props. TE target volatility is higher than WR2, even when routes look similar. Matchup-normalized checks Look at how your model adjusts the same player vs run-funnel vs pass-funnel defenses. Are the deltas consistent with historical payoff?
Calibration, Brier, and distribution fit
Calibrate probabilities Reliability plots for P(Over) in 5% bins. You want near-diagonal. If under-confident (line below diagonal), consider shrinking distributions. Brier score by market Track receptions, yards, attempts, longest reception separately. Over time, tilt your betting volume into the markets with the lowest Brier and best CLV.
Feature drift and alerting
Drift watchlist Route share changes after injuries Team PROE regime shifts (new play-caller, QB change) Coverage shell usage league-wide (e.g., more two-high looks midseason) Automated alerts Trigger when a player’s projected usage shifts >15% vs prior week or when book price moves >15 cents but your fair odds barely change (re-check assumptions).
Bet logging and measurable CLV
Always log: Market, book, line, price, time, stake Your model probability and edge at the moment of bet Closing line and price at kickoff Analyze: Distribution of CLV in cents and in implied median yardage difference Win rate by CLV bins (e.g., >10 cents CLV should outperform)
Surfacing misfits for analyst review
Build a daily “disagreement” table: Top 10 props where your model differs by 10+ yards vs consensus Reasons column (injury, role change, weather, coverage) Analyst checkboxes: confirm, downgrade, reject Re-train notes When analysts repeatedly override similar edges (e.g., WR vs bracket coverage), encode that feature to reduce manual overrides later.
Turning platform data into action
ATSwins angle Bettors using an AI workflow benefit from centralized picks, betting splits, and profit tracking. If you’re blending your model with a platform that tracks ROI across sports and props, you gain a feedback loop on what actually pays. For an end-to-end betting workspace with data-driven picks and logs that help reinforce the process, see ATSwins.
How to implement this process, step-by-step
Build the data layer (Day 1–2)
Data pulls: open NFL play-by-play data play-by-play for pace, PROE, EPA, success rates Next Gen Stats for alignment, speed, separation, and pressure proxies historical game logs and player data for game logs and splits live NFL injury reports for statuses and practice participation Storage and refresh: Daily update pipeline plus a “rapid refresh” on Sundays. Keep a rolling 8-game and 3-game window for form; add career priors.
Create opportunity baselines (Day 3)
Team-level module: Project plays and pass/run using spread/total and historical splits. Player-level module: Role-based priors for route share and carry share. TPRR stabilized with a small Bayesian prior (league-average by role). Opponent and environment module: Coverage shell mix, pressure rates, wind, and dome/grass tags.
Train models (Week 1, then weekly refresh)
Tree model inputs: Player role, aDOT, coverage, pressure, O-line, QB tendencies, recent form. Targets: Per-route TPRR, per-target Y/T, per-carry YPC, per-game route and carry shares. Hierarchical model: Partial pooling for TPRR and Y/T with team and player random effects.
Simulate and price (Daily during season)
Sim step: 10,000+ paths per game, sampling scripts from spread/total distributions. Produce P(Over L) for all common lines and alts. Line shopping: Ingest book lines every 10–15 minutes on heavy days; every hour otherwise. Flag edges above thresholds (e.g., 3% main, 5% alts).
Bet sizing and execution (Game day)
Sizing: Fractional Kelly with cap per market and per game. Timing: Pre-kick 90-minute push on confirmed role edges. Monitor for last-minute weather or OL scratches.
Tracking and review (Post-game)
Log results, update CLV stats. Weekly review meeting: Top winners/losers, CLV vs outcomes, market biases noticed. Re-tune priors where needed.
Tools and workflows that save time
Useful tools
Data sources: NFL tracking data historical game logs and player data open NFL play-by-play data live NFL injury reports structured sports data feeds Model and ops: Tree libraries (XGBoost, LightGBM), Stan or PyMC for Bayes A basic scheduler to run pre-game refreshes A line scraper or API aggregator plus a simple alerting bot
Fast templates you can copy
Inefficiency checklist (pre-bet): New role or snap change? Pace and PROE mismatch? Coverage shell favors or caps aDOT? Book’s alt ladder shows skew? Is your slate-level correlation within limits? Sunday ops calendar (ET) 8:00a: Weather, first data refresh 10:00a: Beat reports check; adjust role baselines 11:30a: Inactives lock; rerun sims 11:40–12:00p: Execute top edges; record lines and stakes 12:40p: Final scan for late weather/OL scratches Stake sizing quick sheet 2–3% edge: 0.25 Kelly 4–6% edge: 0.3–0.4 Kelly 7%+ edge or alt ladders with strong structural case: 0.5 Kelly cap Absolute cap per player and per game to control correlation
Practical examples across common markets
Receptions vs receiving yards
Receptions overs Best for slot WRs and TEs with high TPRR but low aDOT. Wind or two-high shells that compress targets underneath can help. Receiving yards overs Better for field-stretchers in favorable coverage (more single-high or man) and with clean pass protection. Inefficiency tell If receptions moves up but longest reception barely budges, the book updated volume but not explosiveness. That’s a flag to check longest reception overs.
Rushing attempts vs rushing yards
Attempts overs Strong when you model a run-heavy script (lead or neutral) with a coach who leans conservative, even at modest efficiency. Yards overs Better when the front-7 and OL matchup suggests chunk gains; also when the RB catches favorable light-box rates. Inefficiency tell After a big yards-per-carry game, books lift yards faster than attempts. If the script won’t repeat, attempts under can be sharper.
QB passing yards vs attempts
Attempts overs Trail scripts, high PROE, and aggressive coaches. Attemps overs pay with volume even if YPA isn’t great. Yards overs Need both volume and efficiency; wind and pressure slash YPA risk. Inefficiency tell Books sometimes shade yards up on marquee QB matchups, but attempts remain flat across the market. If pressure is high, attempts can still clear while yards stall.
Common pitfalls and how to avoid them
Overreacting to one-week spikes
Use rolling windows with decay and a role prior. A single 9-target game for a part-time WR rarely holds without a clear role change.
Ignoring OL and defensive injuries
OL injuries often matter more than skill-player Q tags. Poor pass pro kills deep aDOT props. Always include OL status in the actives check.
Chasing steam blindly
CLV is good, but ask why the steam occurred. If it’s public favorite bias, it can be a fade. If it’s quiet OL news or wind uptick, you might still be late but correct.
Over-stacking correlated outcomes
Keep a slate correlation meter. If you already have two overs on the same pass game, your third should either be small, a hedge, or avoided.
How ATSwins-style analytics fit into the workflow
Blending platform insights with your model
Use betting splits to see where the market leans, but price with your distribution. If your fair P(Over) is 59% and the market is heavy on the other side, don’t be scared off if your data is robust. Track your ROI and CLV by market and by book. A platform that centralizes picks, props, and profit tracking helps spot real edges vs noise. You don’t need to overcomplicate it-just make the feedback loop tight.
A minimal, repeatable routine
Morning: refresh projections, scan platform splits, and write your day’s watchlist. Pre-kick: run your actives window process; execute top edges. Post-game: log outcomes, update CLV, tag wins/losses with reasons (“coverage surprise,” “role misread,” “weather shift”), and feed that back into priors.
Bringing it together: a quick-start playbook
Day-before checklist (15–25 minutes per slate)
Pull injury statuses and practice reports. Rebuild team pace and PROE expectations by matchup. Identify three to five likely role changes (snap increases, formation changes). Flag weather risk games and dome games for different prop sets.
Game-day, 90-minute sprint
Confirm inactives; adjust any snap/route shares. Rerun sims; export edges by book and by line. Compare alt ladders for skew; choose tails where justified by profile (aDOT, coverage). Place and log; set alerts for late weather or OL changes.
After kick
Record closing price and line; compute CLV. Tag selections: volume edge vs efficiency edge vs ladder tail. Schedule a 30-minute weekly review; promote repeatable edges and prune noisy ones. This is the real workflow for NFL player prop projections using inefficiencies: build opportunity baselines fast with reliable data, model distributions rather than medians, hunt skew and timing windows, protect bankroll with fractional Kelly, and keep the QA loop tight. Keep it simple, repeatable, and anchored to fresh usage and coverage context. When in doubt, let the data call the play.
Conclusion
AI-powered props come down to quick usage reads, sound distributions & steady sizing... We hit routes and injuries, tempo, and fair pricing; track CLV to confirm. Bottom line: keep it simple and disciplined. Next: test small, log results, then lean on ATSwins - an AI-powered platform with data-driven picks, player props, betting splits and profit tracking across NFL, NBA, MLB, NHL and NCAA. Free and paid plans for smarter choices.
Frequently Asked Questions (FAQs)
What does “NFL player prop projections using inefficiencies” actually mean?
It means you build numbers for a player’s likely outcomes, then target sportsbook lines that haven’t adjusted for real-world signals. In practice, you spot pricing mistakes from things like late injury updates, role changes, pace & pass rate shifts, or weather that books priced slowly. You’re not guessing; you’re turning live information into edges, then comparing your projection versus the posted line to find positive expected value.
Which data should I track for NFL player prop projections using inefficiencies?
Start with usage and opportunity, then layer context: Routes run, snap share, route share, targets per route run, aDOT, red-zone role (volume first, efficiency second). Team pace and pass rate over expected (PROE), plus opponent tendencies and coverage types. Late-breaking availability: actives/inactives, limited practices, travel and weather. Helpful, complementary sources: Player tracking and route data: NFL’s official Next Gen Stats Play-by-play and modeling inputs: open NFL play-by-play data Historical usage: historical game logs and player data Injury news and statuses: live NFL injury reports Schedules, depth charts, and feeds: structured sports data feeds Weather: reliable weather data Track those daily, but especially 90–30 minutes pre-kick when lines can lag. That’s when inefficiencies show up most.
How do I turn NFL player prop projections using inefficiencies into real edges?
Set a baseline: project median outcomes from usage (routes, carries, targets) and team tendencies (pace & PROE). Adjust for matchup and game script: opponent coverage/box counts, likely trailing/leading scenarios. Price a distribution, not a single number: simulate outcomes (even simple Monte Carlo) to get fair odds across lines and alt lines. Compare to market: remove the sportsbook vig to get no-vig implied odds, then see where your fair line differs. Bet sizing: use fixed units or a fractional Kelly approach. Keep it small; variance is real. Validate: track closing line value (CLV). If your numbers beat the close more often than not, your inefficiency read is probably working. Tip: When volume shifts but efficiency doesn’t (e.g., more routes, same yards per target), derivative props like receptions or attempts may show cleaner edges than yards.
When’s the best time to bet NFL player prop projections using inefficiencies?
Two windows matter most: Early week: if you’ve got a strong read on usage changes (scheme tweaks, injuries that the market is slow to price), you can beat the move. Lines can be soft, though limits might be lower. Late news window: roughly 90–30 minutes before kickoff. Actives/inactives, snap-count hints, and weather clarity can create fresh inefficiencies. Move quick, but don’t force it. Also watch for: Pace mismatches (fast vs slow teams) that impact play volume. Teammate correlations. If a WR is ruled out, redistribute targets realistically; avoid double counting. Market skew. Some books price alt ladders with uneven juice; that’s where you might find a better number, sometimes much better.
How does ATSwins.ai help with NFL player prop projections using inefficiencies?
ATSwins.ai is an AI-powered sports prediction platform offering data-driven picks, player props, betting splits, and profit tracking across NFL, NBA, MLB, NHL, and NCAA. Free and paid plans give bettors insights and guides to make smarter, more informed decisions. In practice, I use ATSwins to: Cross-check my NFL player prop projections using inefficiencies against live market movement and betting splits. Monitor late-breaking changes that affect usage baselines (so I react faster, not later). Log results and track profit to see which inefficiency signals are actually paying. You get a clean workflow-research, pick, track-and less noise. Learn more at ATSwins.ai.