

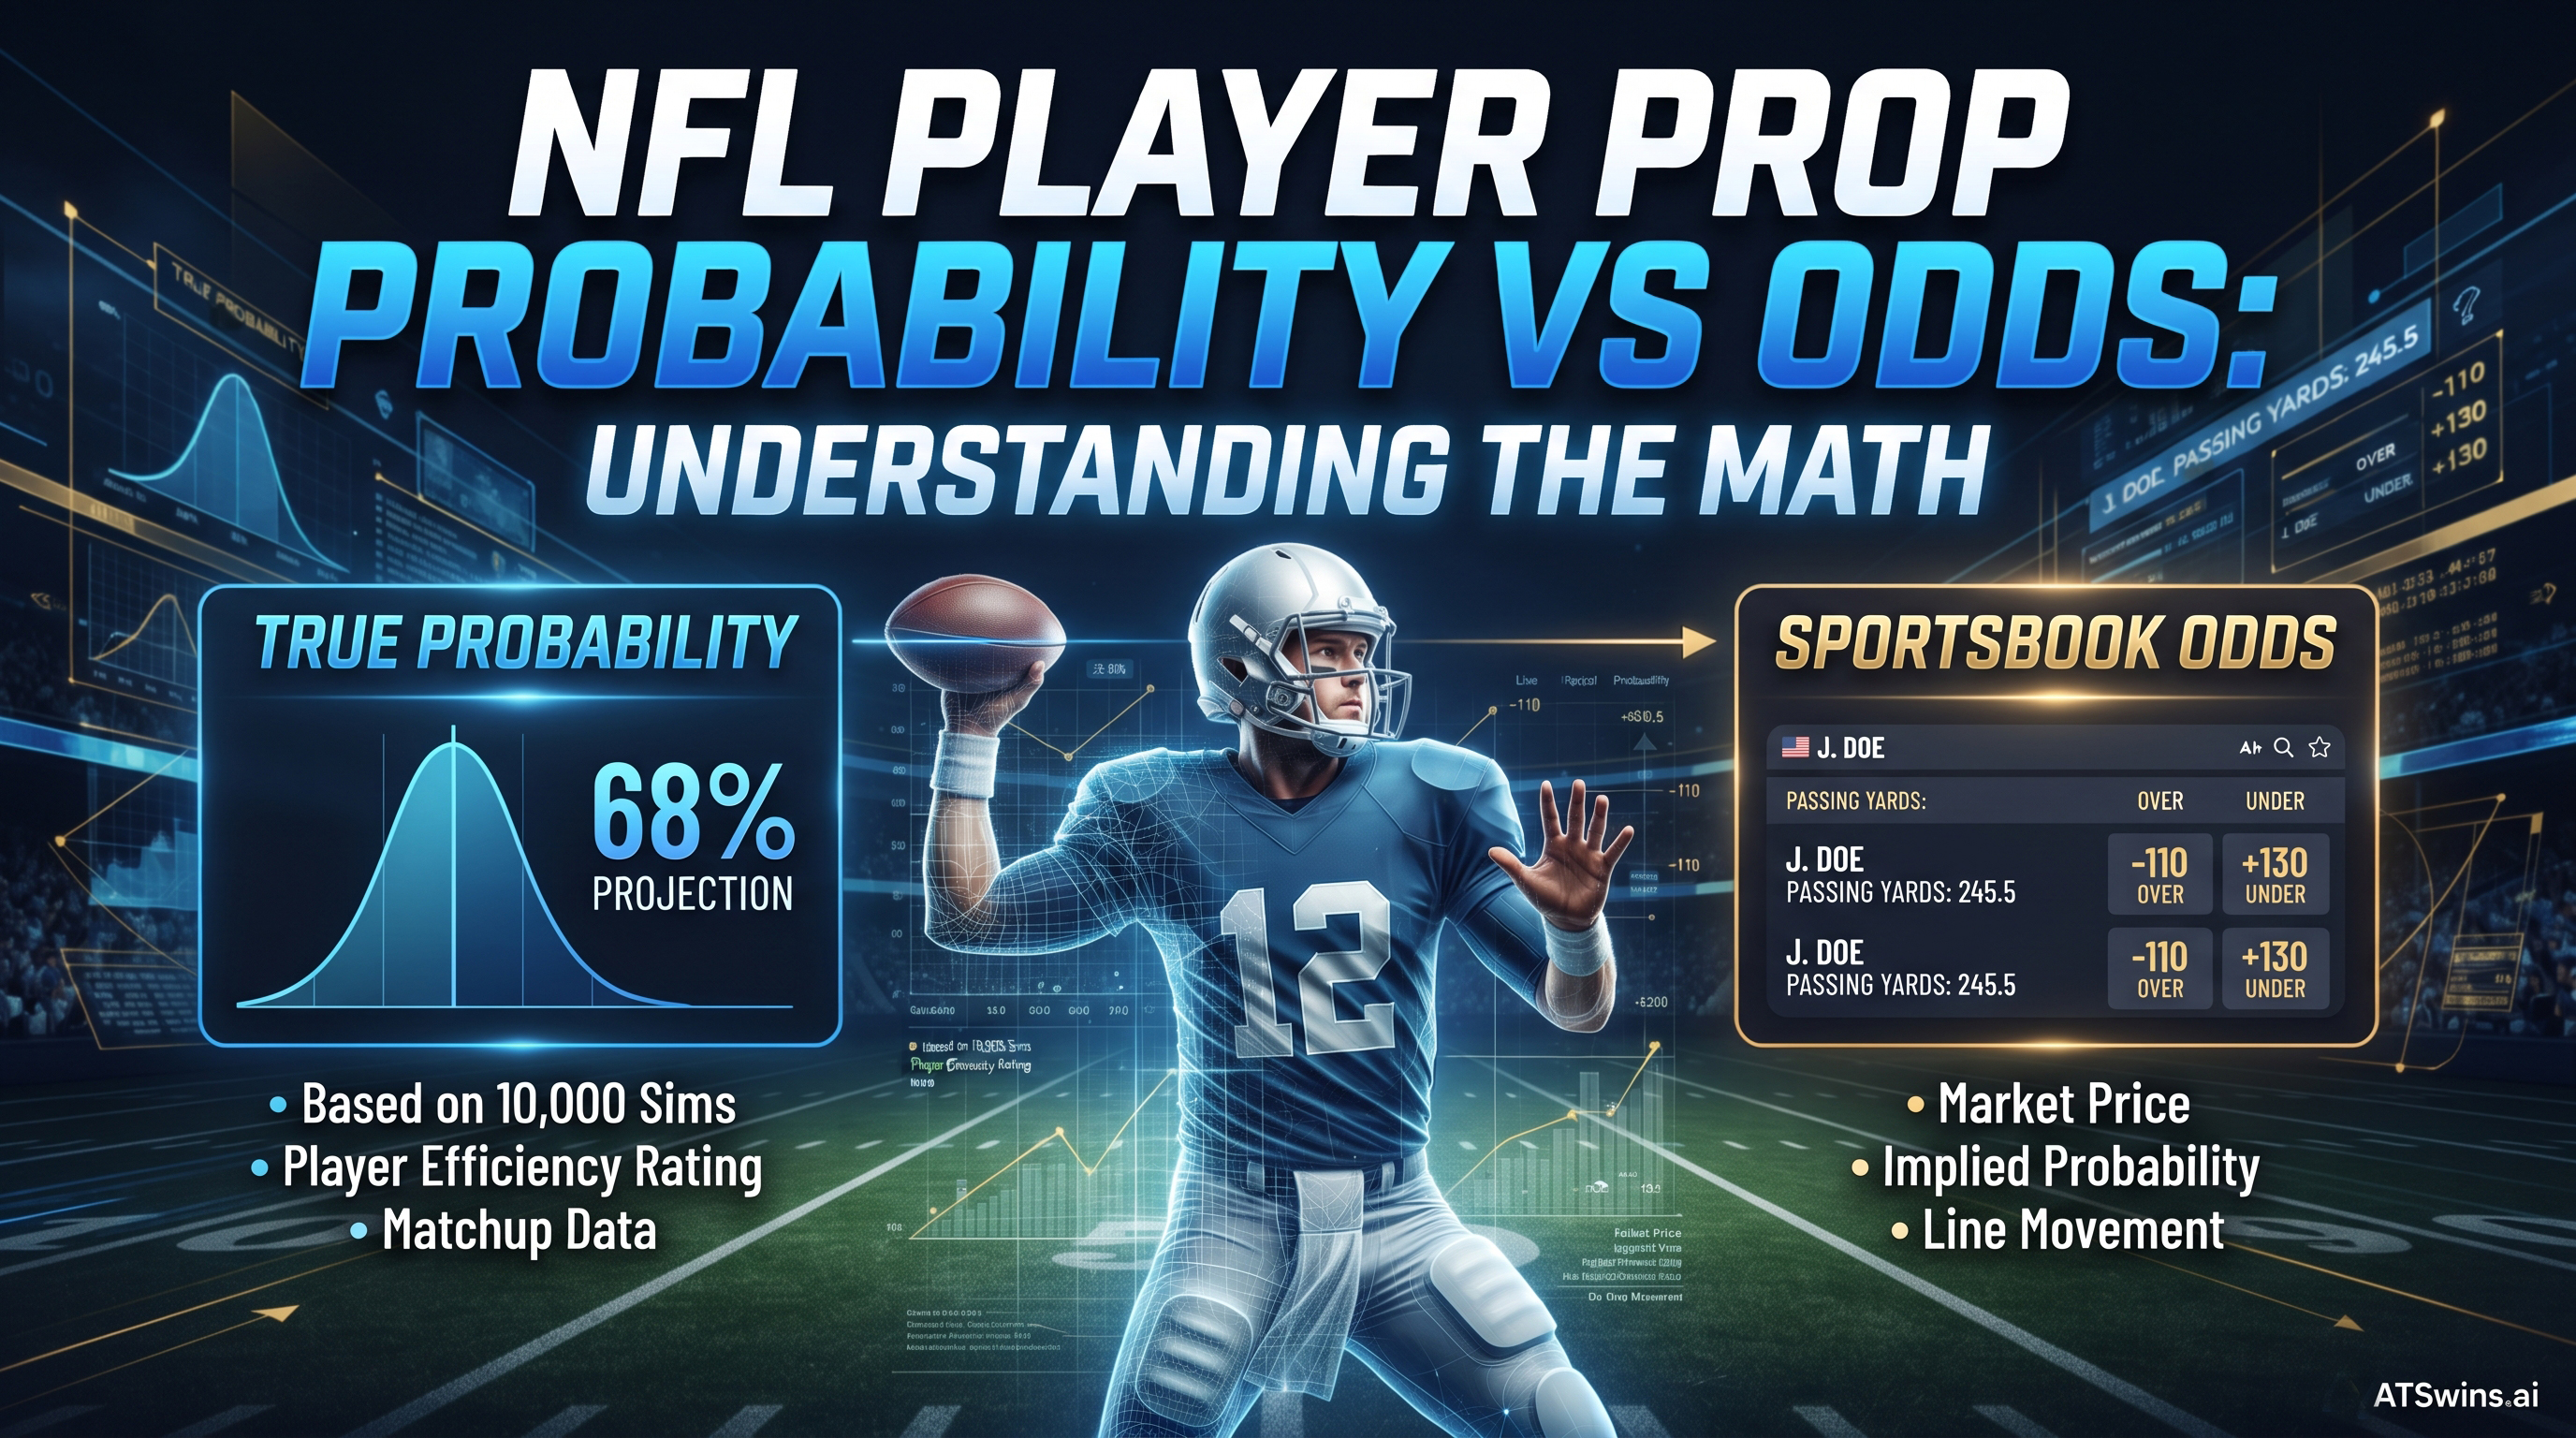
Navigating the world of football analytics often leads to a fundamental question about how numbers translate into real-world choices. When looking at weekly matchups, fans and analysts frequently encounter two distinct figures that sound similar but operate under completely different rules. These figures are player prop probability and betting odds. Understanding the gap between what is mathematically expected to happen and what a marketplace is pricing that event at forms the core of modern sports analytics.
True probability represents the genuine mathematical likelihood of a specific event occurring based on rigorous historical data, situational variables, and predictive modeling. When evaluating an athlete taking the field for a Sunday afternoon kickoff, an advanced analytical model takes thousands of variables into account. These variables include past performance under similar defensive schemes, weather conditions, snap counts, target shares, and situational pace of play.
Instead of guessing whether a wide receiver will clear a specific yardage mark, a data-driven framework runs extensive game simulations to produce a distribution of outcomes. If a quarterback's passing touchdown projection yields a specific threshold in sixty out of one hundred simulated game scripts, the true mathematical probability of that event occurring is sixty percent. This percentage is entirely detached from public opinion, fan bias, or money movement in the open market. It is simply a reflection of historical sample sizes and statistical distribution. Understanding this baseline is essential because it provides an objective anchor point before looking at what sportsbooks are offering to the public. Behind these complex simulations, an advanced AI sports betting probability model processes millions of data points to establish an unbiased baseline for every single matchup on the slate.
Betting odds, on the other hand, do not necessarily represent the true mathematical probability of an event. Instead, odds represent a commercial price set by oddsmakers to balance liability and attract balanced action from the public. While oddsmakers use sophisticated internal models to generate their initial opening numbers, the subsequent movement of those lines is heavily influenced by public betting volume, sharp money syndicates, and news updates such as late-breaking injuries.
When looking at a standard player prop market, the numbers are translated into American odds, decimal odds, or fractional odds. For example, if a running back is favored to rush over a certain yardage total, the price might be set with negative odds, meaning a bettor must risk more money to secure a profit. Conversely, the under might be listed with positive odds. These prices can be converted into implied probability, which tells the analyst what percentage chance the sportsbook’s price assigns to the outcome. However, due to the business model of bookmaking, the implied probabilities of all possible outcomes in a given market will always add up to more than one hundred percent.
The extra margin built into sportsbook pricing is known as the vig, juice, or take. This built-in house edge ensures that regardless of the actual statistical outcome of the game, the marketplace operators maintain a sustainable business model. For player props, this margin is often wider than it is for standard game spreads because individual player markets are less liquid and harder for oddsmakers to price with absolute precision.
Because of this built-in tax, comparing true probability directly to raw odds will reveal an immediate discrepancy. If a model calculates that a tight end has a fifty percent chance of scoring a touchdown, but the sportsbook prices both the over and the under at standard minus one hundred ten juice, the implied probability of that pricing is roughly fifty-two point four percent on both sides. That extra two point four percent represents the cost of admission set by the market. Recognizing how this margin operates helps analysts understand that beating the closing line requires finding spots where the true mathematical probability significantly overcomes the frictional cost of the marketplace.
The eternal challenge for anyone studying sports analytics is determining whether a discrepancy between a model and a market price represents a genuine analytical edge or simply a flaw in the underlying assumptions of the model. When a predictive system identifies a wide receiver prop where the calculated probability differs substantially from the implied odds, a rigorous evaluation process must take place.
Factors that can distort a model include small sample sizes early in the season, sudden coaching adjustments, or unquantifiable locker room dynamics. At the same time, sportsbooks are exceptionally efficient at absorbing sharp information, meaning that a massive gap between a model and a market price is often a sign that the model is missing a vital piece of context, such as an unlisted injury or a weather shift. Platforms like ATSwins.ai emphasize continuous model calibration and data quality to ensure that projections account for as many moving parts as possible before comparing those outputs against market prices. Furthermore, integrating comprehensive sports betting market intelligence allows quantitative analysts to monitor how professional money flows into specific player props throughout the week.
Applying this comparative framework to a weekly slate of games requires discipline and a strict focus on sample sizes. Rather than treating every divergence between a probability model and a betting line as an automatic opportunity, sophisticated analysts look for systemic patterns where certain types of player props are systematically mispriced by public perception.
For instance, public attention often gravitates heavily toward offensive skill players who feature prominently in highlight reels, leading to inflated expectations for superstars and deflated expectations for rotational players. Predictive models do not care about name recognition or prime-time television slots; they evaluate past performance distributions objectively. By comparing the fair line generated by data simulations with the numbers displayed on the board, analysts can isolate situations where the market price fails to respect the true range of possible outcomes. Utilizing tools available through resources like ATSwins analytics platforms, powered by a sophisticated sports probability engine, allows enthusiasts to examine these probabilistic breakdowns systematically without relying on emotional hunches.
What is the main difference between player prop probability and odds?
True probability is a mathematical calculation derived from statistical models and historical data representing how often an event should occur. Odds are commercial prices set by sportsbooks that incorporate public betting trends, liability management, and a built-in house margin.
Why do implied probabilities from sportsbook odds exceed one hundred percent?
Sportsbooks add a commission fee known as the vig or juice into their pricing structure. This ensures that the sum of the implied probabilities for all possible outcomes in a given market always totals more than one hundred percent, guaranteeing revenue for the operator.
How do advanced models calculate player prop probabilities?
Advanced analytics frameworks utilize thousands of historical data points, including snap counts, target shares, defensive matchups, weather patterns, and pace of play, running numerous game simulations to establish a distribution of likely statistical outcomes for an individual athlete.
Can predictive models guarantee success in player prop markets?
No model can eliminate uncertainty or guarantee outcomes in sports. Football is inherently volatile, influenced by unexpected injuries, referee decisions, and random variance. Predictive models simply aim to identify long-term statistical value by comparing true probabilities against market prices over a large sample size.