

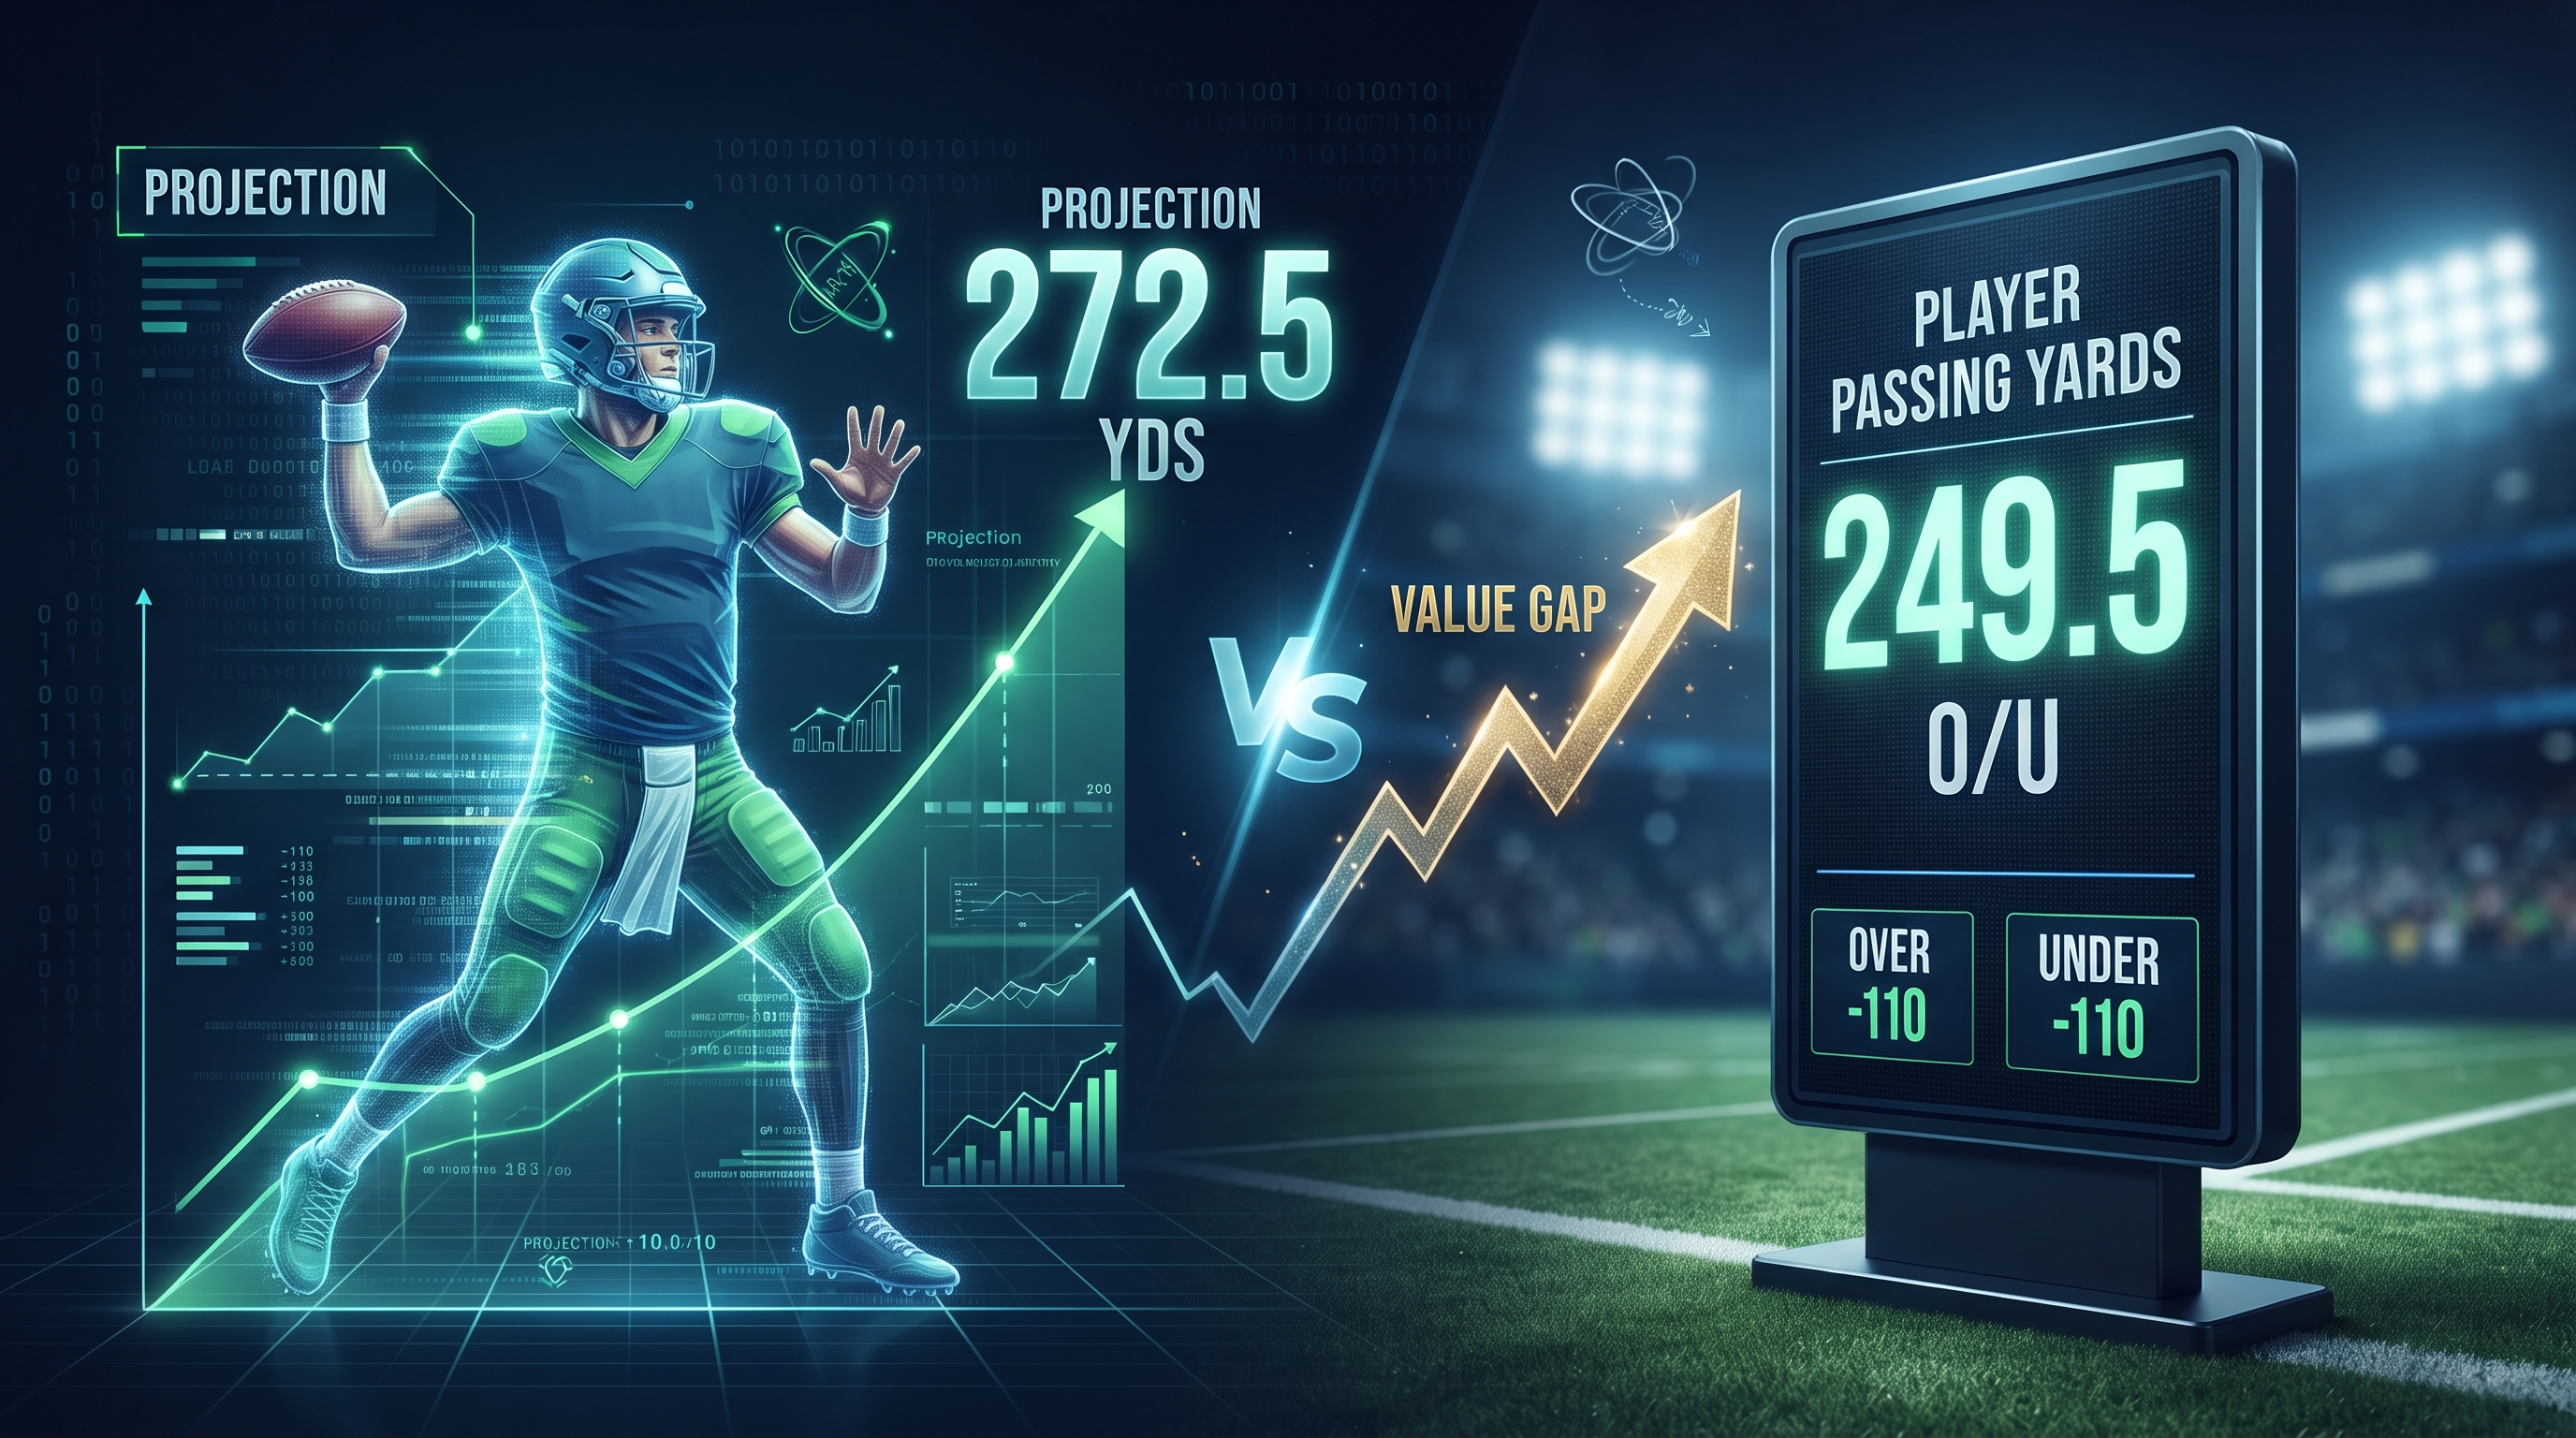
When we talk about projection versus the line, we need to understand what it actually means in practice. Your projection is simply your modeled expectation for a specific quarterback passing yards output in an upcoming game. You should use a median for betting markets most of the time, because player props settle on single-outcome medians much more cleanly than means when distributions happen to be skewed. However, keeping the mean around is still useful when you need to sanity-check major outliers. The sportsbook prop line is the number you bet over or under, complete with its attached price or vig, such as 249.5 at minus one hundred fifteen. Some sportsbooks post clean integers like 250, which immediately introduces a non-zero push probability that you have to account for. When we say projection versus line, we are looking at the delta, which is the projection minus the line. That delta tells you where you might have an edge, but the delta alone is never enough on its own. You need the full distribution, including variance and skew, to turn that raw delta into an actual probability for both the over and the under.
A ten-yard edge where you project 260 against a 250 line might be exceptionally strong or completely weak depending entirely on the variance of passing yards for that specific quarterback in that specific matchup. If your distribution is tight and features lower variance, a small delta can easily translate into a massive probability gap. If the distribution is wide due to volatility from unpredictable volume or extreme opponent traits, you will need a much larger delta to justify putting money down. To convert your projection and variance into betting probabilities, you start by building a complete distribution for passing yards. Then you compute the probability of the over, which is the chance that yards exceed the line. If the line sits at 249.5, a result of exactly 249 is a loss while 250 is a win. If the line is an integer like 250.0, you have to estimate the push probability by treating the distribution as continuous and approximating the push as the probability mass sitting right between 249.5 and 250.5. Once you derive your probabilities for over, under, and push, you can easily calculate fair odds. For negative American odds when probability is fifty percent or higher, you take the probability divided by one minus the probability and multiply by one hundred. For positive odds, you take one minus the probability divided by the probability and multiply by one hundred. Comparing these fair odds to the book odds gives you your expected value.
Push risk and juice completely change how you look at the math. Push risk reduces realized value at integer lines, which is why some books shade those lines or prefer half-yards to avoid ties entirely. Juice dictates your break-even point. For a standard minus one hundred ten price, your break-even probability sits around fifty-two point thirty-eight percent. For minus one hundred twenty, it jumps to fifty-four point fifty-five percent. You only want to place a bet when your true win probability exceeds that required break-even threshold. To gather data, we lean heavily on primary data feeds and historical prop behavior because static pages rarely map one-to-one across seasons. ATSwins helps centralize all of these moving parts by offering AI-driven projections, betting splits, player props, and profit tracking so you do not have to stitch every single input together by hand, functioning similarly to an advanced nfl player prop edge finder for spotting market discrepancies.
Data and modeling — turning inputs into a passing yards distribution
Gathering the right core inputs every single week is the foundation of any reliable model. For quarterback efficiency, you want to track expected points added per play and completion percentage over expected to capture accurate throws and overall drive efficiency, alongside air yards per attempt, time to throw, and sack avoidance rates. Team context is just as critical, meaning you need to look closely at pace measured in seconds per play, pass rate over expected broken down by game situation like neutral, trailing, or red zone, and offensive line pass block win rates alongside pressure rates allowed. Receiver ecosystems matter immensely, so track wide receiver, tight end, and running back target shares, route participation percentages, health statuses, yards after catch per reception, contested catch ability, and separation metrics. Opponent defenses require deep analysis of coverage tendencies including man versus zone rates, light box frequencies, blitz rates, simulated pressure looks, quick pressure rates under two and a half seconds, and explosive pass rates allowed. Finally, environment and schedule factors like weather conditions, stadium type, travel fatigue, short weeks, game spreads, and totals help paint the complete picture.
Moving from a simple point estimate to a full distribution requires a bottom-up approach layered with uncertainty. Step one is projecting total plays and dropbacks by taking baseline pace and adjusting it for opponent tempo, then splitting plays into run versus pass using pass rate over expected and expected game script. Step two involves projecting yards per dropback, which stems from air yards per attempt multiplied by completion rate and yards after catch, plus chunk plays from defensive pass interference and busted coverages, minus sack yardage. Step three layers in variance by introducing volume variance through a Poisson or Gamma mixture for attempts, and efficiency variance through a lognormal or normal mixture for yards per attempt to handle the natural skew of long completions. Step four runs a Monte Carlo simulation anywhere from twenty thousand to one hundred thousand times, sampling play volume, attempts, completion rate, air yards, yards after catch, and sack rates to output a comprehensive distribution complete with median, mean, standard deviation, tenth and ninetieth percentiles, and empirical probabilities for any posted line.
The game environment must sit right at the heart of your model because totals and spreads directly inform pass rate and tempo. A game with a forty-four point total is an entirely different world for dropbacks compared to a game with a fifty-two point total. Script asymmetry matters just as much because trailing teams call more passes, but often with a lower success rate if the pass rush ramps up, whereas leading teams tend to slow down and run the clock, which suppresses passing attempts and yards after catch opportunities. Short-week fatigue like Thursday Night Football or international travel can zap vertical route trees, so you should trim air yards or reduce late-game efficiency in your simulations for those spots. Weather adjustments must also be handled carefully because sustained winds over fifteen miles per hour impact air yards and completion percentage far more than light rain, meaning calm cold weather is manageable while heavy wind gusts are destructive.
Practical data blending requires using structured play-by-play data sources to bucket situational pass rate over expected by score differential, aligning Next Gen Stats metrics with opponent pressure rates to validate sack expectations, and pulling route rates and target shares while smoothing them out with multi-week priors to avoid overreacting to a single fluky performance.
Comparing projection to the posted line
Once you have your distribution, you need to scrape or enter current lines and vig from multiple sportsbooks to find the best available number. Lines move constantly, so if your model updates hourly, maintaining a shadow line representing the exact number where your fair odds sit at minus one hundred ten on either side is extremely helpful. Calculating expected value per one unit of risk involves taking your win probability and multiplying it by the win amount, then subtracting the loss probability multiplied by one unit. Comparing your calculated over or under probability to the book break-even percentages tells you immediately whether you have a legitimate mathematical edge. You also have to account for correlation, script shifts, and news risk. A trailing game script naturally boosts passing attempts, so your simulations should couple attempt totals with realistic score paths derived from the spread distribution. Conversely, heavy leads create pace downshifts that can crush marginal overs relying on fourth-quarter garbage-time padding. Late inactives and snap caps require you to hold your fire or price out active versus inactive branches before deciding when to pull the trigger.
Timing your entries around injury reports and market movement windows is an art form in itself. Early in the week, limits are soft and market uncertainty is high, meaning your edges can be massive, but news risk is also at its peak. Twenty-four to forty-eight hours before kickoff, limits start rising and lines sharpen up as more information gets baked into the market. Close to kickoff, betting limits reach their absolute maximum, but steam moves exceptionally fast and can erase value in the blink of an eye, requiring you to pass if the number is already gone. Translating your simulated distribution into fair odds and edges follows a strict step-by-step process. You run tens of thousands of simulations for the quarterback under current inputs, compute the probabilities and fair odds for every candidate line, pull current market prices, calculate expected value per unit of risk, and record the bet while monitoring for closing line value.
When executing these bets, you need to decide on strict thresholds for placement. Many sharp bettors look for a yardage cushion of three to five yards combined with a positive expected value greater than two to three percent at a minimum, bumping those requirements higher for high-variance quarterbacks or questionable weather situations. For under bets, you should always bias toward bigger cushions because markets occasionally price downside volatility poorly, but unders can still prove fragile if the game script flips unexpectedly. You must shop across multiple numbers rather than just chasing the price, because securing a significantly better number can easily outweigh a few cents of juice. Keeping a meticulous tracking log of every single wager, including your projections, standard deviations, posted lines, fair odds, expected values, closing lines, and final results, is the only way to ensure long-term profitability and accountability in your sports probability engine betting journey.
Execution and tracking — consistent process beats big swings
Maintaining strict discipline in your execution separates winning bettors from recreational players who rely entirely on gut feelings. You should always avoid chasing steam if you have already missed the best available number on the board, letting it go rather than forcing an entry that completely destroys your long-term return on investment. Shopping numbers across multiple sportsbooks is mandatory because a better key number can completely dwarf minor differences in price juice. Time your entries carefully around final injury reports and active lists released ninety minutes before kickoff, especially if your edge relies heavily on a specific pass-catcher's yards after catch ability. Tracking every metric of your process allows you to review outliers and refine your underlying variance assumptions over time. If a quarterback repeatedly misses your projections by wide margins, you need to go back and check whether your pace priors understated no-huddle rates, whether your pressure interactions were too optimistic about the offensive line holding up, or if shifting route trees altered the expected depth of target.
You also need to avoid stacking correlated overs unless you are modeling their joint outcomes accurately through advanced simulation. Simply betting a quarterback over, a wide receiver one over, and a wide receiver two over without accounting for the fact that attempts, yards per average, and target shares are tightly linked can quietly expose your bankroll to massive hidden risks. If you do not explicitly model these correlations, you should cap your exposure to multiple overs from the exact same passing attack, or consider hedging with an under on an opposing pass-catcher if the game script implies a slower overall pace. Keeping your bankroll rules simple and robust is vital for survival. Flat staking between zero point five and one percent per prop is clean, safe, and highly effective, while fractional Kelly criteria can work well if you remain conservative and use half or quarter Kelly sizing to completely avoid devastating drawdowns. Never fall into the trap of using martingale or doubling up after losses, because aggressive chasing strategies completely clash with the probabilistic nature of player props.
Developing practical checklists and workflow routines will dramatically speed up your weekly preparation. Before placing any NFL passing yards bet, you should systematically verify that you have updated all injury reports and route participation data through Friday, re-checked weather forecasts for wind updates within twelve hours of kickoff, confirmed whether spreads and totals have moved materially, incorporated pass rate shifts for trailing or leading scripts, computed all over, under, and push probabilities, ensured expected value clears your personal threshold with a healthy yardage cushion, shopped multiple books for the best price, checked for correlation conflicts on your betting card, and recorded the timestamped entry snapshot for closing line value tracking. Applying platform tools like those found on ATSwins allows you to use AI-driven projections as a reliable starting prior, layering on your own situational tweaks such as pass rate over expected deltas, wind thresholds, and active status reports to transform a strong baseline into a truly game-specific distribution.
Conclusion
We have covered the complete roadmap for turning quarterback passing yards into profitable bets by building solid distributions, comparing projections against posted lines, pricing overs and unders accurately, managing juice and push risk, and timing your entries to perfection. The foundational pillars of success are absolute discipline, contextual awareness, and rigorous tracking of every single wager you place. By setting strict thresholds, logging your results religiously, and leveraging advanced analytical platforms like ATSwins to access data-driven player props, betting splits, and transparent profit tracking across major sports leagues, you give yourself the ultimate framework to make smarter, sharper, and far more informed decisions over the long haul.
Frequently Asked Questions (FAQs)
What does nfl passing yards projection vs line actually mean?
It represents the direct comparison between your statistical estimate of a quarterback passing yards output, known as the projection, and the sportsbook posted number, known as the line. If your analysis shows a meaningful gap where you project two hundred seventy-two yards against a line of two hundred forty-nine point five, you have likely uncovered valuable edge on the over. Conversely, if your model sits at two hundred twenty-eight yards against that same line, it leans heavily toward the under. The entire objective is to accurately size that gap, account for underlying statistical uncertainty, and determine whether the resulting edge clears your required betting threshold.
How do I turn nfl passing yards projection vs line into a real edge?
You start by building your projection alongside a reasonable variance estimation, utilizing a standard deviation that typically ranges between thirty-five and fifty-five yards for NFL quarterbacks. Next, you convert that distribution into exact probabilities for the over and the under using either a normal approximation or a robust simulation model. After that, you price the bet by comparing your fair probability to the sportsbook price after stripping out the vig, ensuring your edge is genuine. You must also account for push risk on round integer numbers compared to half-yards, and strictly adhere to sound bankroll management rules because player props require ironclad risk control.
What factors most often move nfl passing yards projection vs line on game day?
Surprise inactives and late-breaking usage news regarding starting wide receivers, offensive tackles, or cornerbacks can swing passing attempts and efficiency drastically in a very short window. Weather conditions, particularly sustained winds exceeding fifteen miles per hour and heavy precipitation, consistently pull passing production downward. Pass rate over expected and team pace adjustments also alter volume expectations significantly. Furthermore, late market movements involving game totals and spreads shift script probabilities, which instantly updates your projection versus line calculations.
How should I think about juice, alt lines, and risk when reading nfl passing yards projection vs line?
You should always strip the vig first by converting American odds into implied probabilities so you can compare them apples-to-apples against your fair over and under numbers. Alternative lines can often provide superior value when your projection suggests a heavily skewed distribution with significant upside volatility, allowing you to target plus-money payouts instead of heavy juice. Be extremely cautious around key numbers that attract heavy public action, and always pass on bets where your post-vig edge falls below two percent, as environmental noise can easily wipe out thin margins.
How can ATSwins help with nfl passing yards projection vs line?
ATSwins functions as an advanced AI-powered sports prediction platform that provides data-driven player prop projections, comprehensive betting splits, and automated profit tracking to streamline your handicapping process. Similar to an advanced ai baseball game analysis toolkit expanded into football, the platform helps you spot pricing gaps instantly, monitor live market movement to optimize your timing, track your closing line value and historical win rates automatically, and utilize flexible access plans to scale your analytical workflow effectively.