

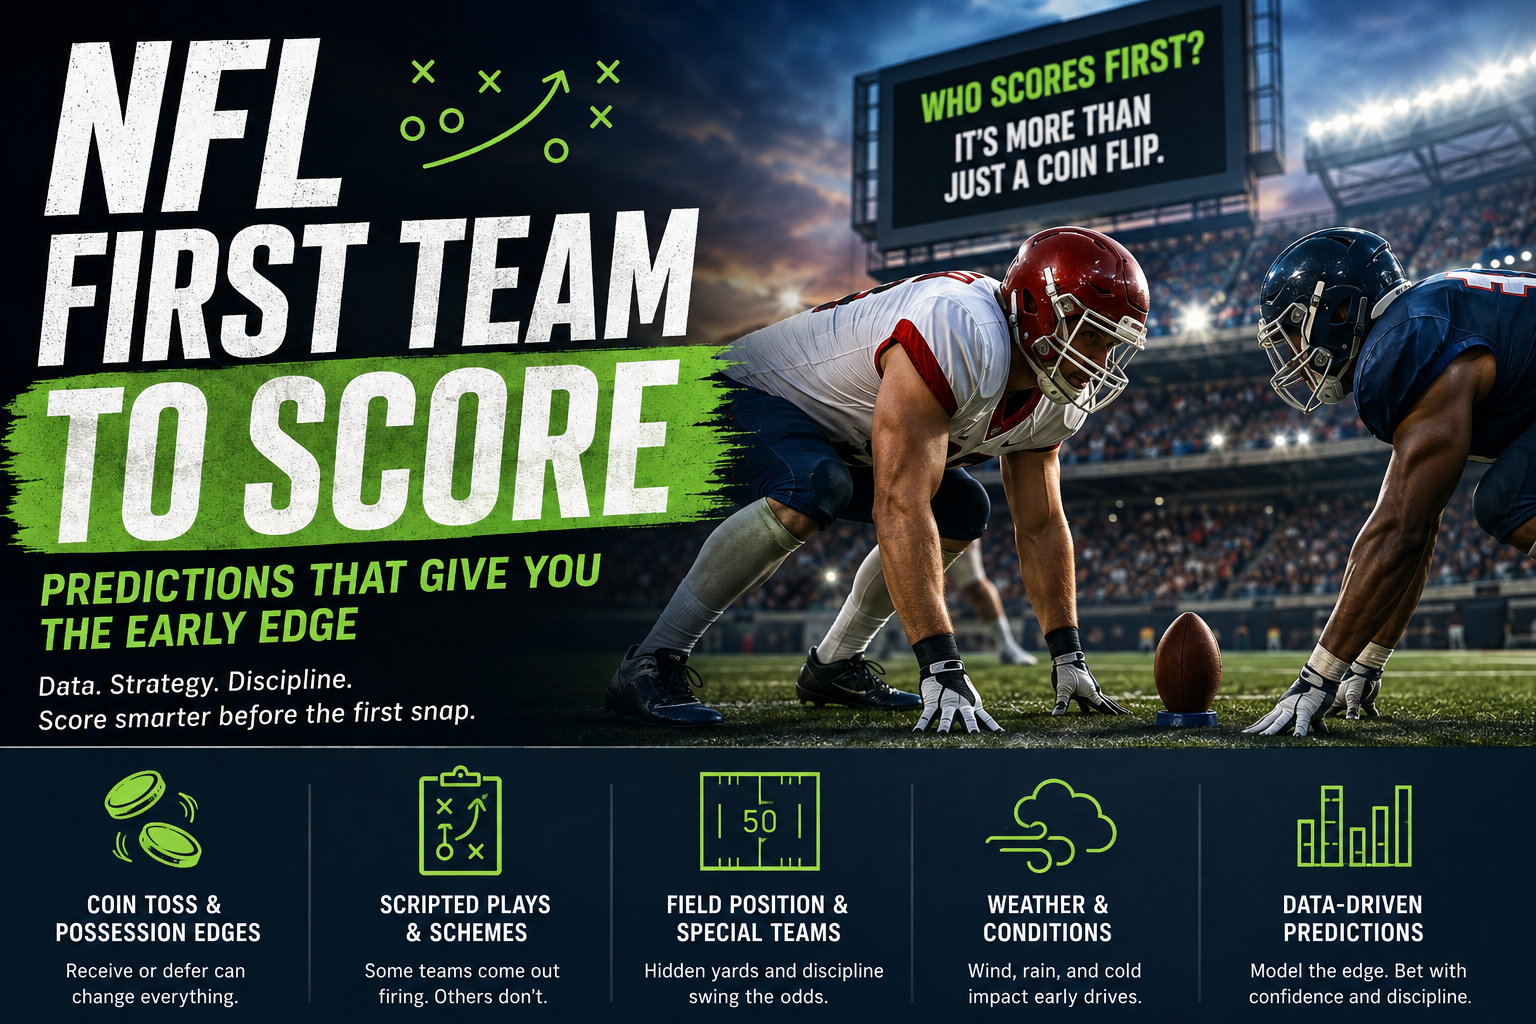
Want a smarter way to figure out which team scores first in an NFL game? This market looks simple because the question is literally just, "Who scores first?" But once you start digging into it, there is a lot more going on. The opening possession can be shaped by the coin toss, a coach's decision to receive or defer, the scripted opening plays, starting field position, offensive line health, quarterback rhythm, special teams, kicker range, and even the wind. I like this market because the result happens quickly, but that also means the variance can hit hard. The goal is not to pretend we can remove that variance. The goal is to price it better, recognize when the price is wrong, and keep the bet small enough that one weird opening drive does not wreck the bankroll. I build AI models and spend a lot of time looking at how small pieces of information fit together. For first-to-score bets, that means I care less about a flashy one-game trend and more about repeatable signals. A team that has scored on six of its last eight opening drives is interesting, but I still want to know who those opponents were, where those drives started, how efficient the offense was, whether the kicker was available, and whether the team is actually expected to get the ball first. That extra context is where a basic prediction can turn into a useful betting decision. This guide walks through that process in a practical way. It covers the market itself, the data I would track, how to build a simple probability model, how to validate it, how to react to late injury and weather news, and how I would manage the actual wager. Most importantly, the point is to stay realistic. A 58% projection is not a guarantee. It is a 58% projection, and that difference matters.
Key Takeaways
Early edge comes from the coin toss (receive or defer), scripted plays, starting field position & special teams; track first-drive scoring rate, opening-drive EPA, and first-quarter points for/against. Price the market like a pro: convert odds to implied %, simulate the toss + possession, adjust for weather, kicker and OL health; update after inactives. Small samples, be careful. Risk first, picks second-use fractional Kelly & unit caps, avoid stacking correlated early props, time entries around news, and log CLV so you know if your reads are sharp. Build a simple model and workflow: pull drive and Q1 splits from historical football data, add nflfastR, advanced player-tracking data & team-level statistical splits; calibrate, blend with market lines… then only bet clear edges. ATSwins is an AI-powered sports prediction platform offering data-driven picks, player props, betting splits, and profit tracking across nfl pass attempts projection model, NBA, MLB, NHL, and NCAA. Free and paid plans give bettors insights and guides to make smarter, more informed decisions.
Market basics and what bettors are really looking for
What “NFL first team to score predictions” actually means
The market is simple on the surface: which team puts points on the board first. Books post a price on Team A vs Team B to score first, and sometimes a third option for “no score” if offered live very early (pre-game it’s almost always A or B). A “score” means any points - touchdown, field goal, safety. Bettors come here for a few reasons:They want a quick, binary outcome with an edge that can be modeled around opening-drive tendencies. They’re angle-hunting a specific mismatch (e.g., elite scripted offense vs slow-start defense). They’re managing risk with smaller, short-duration exposures tied to pre-game information (injury inactives, wind, kicker health). The reality is that this is a thin market with a ton of variance, so I would not treat any single pick like a sure thing. But with the right data, you can make smart, repeatable decisions.
How sportsbooks are likely pricing it
Books begin with a near coin-flip once you set the coin toss, then layer in:Receive/defer tendencies: Teams differ in whether they prefer to receive the opening kickoff. That alone changes which side likely starts with the ball. Home/away bias: Slight shading toward home teams if home splits show higher early-drive efficiency or better special teams. Scripted first 15 plays: Coaching staffs that “script” strong openers get priced up, especially vs opponents who start slow. Baseline team quality: Superior offenses open as small favorites to score first even if they might kick first. Defensive turnover/generate havoc can tilt things too. Kicker strength and 4th-down tendencies: Some coaches grab early points; others pass on 50+ yard tries - that affects field goal likelihood on drive one. Trading teams also react to breaking news (QB/K status, OL downgrades) and weather updates shortly before inactives lock.
Why early-drive efficiency and special teams matter
Scoring first is often a function of:Who gets the ball first. Yes, but. Can that first drive be productive? Script strength, QB pre-snap rhythm, WR availability, and line cohesion matter. Starting field position. A 34-yard net punt or an aggressive kick return flips the edge by several percentage points. Penalties: A false start or hold on 1st-and-10 sinks the first series more than most think. Kicker range and confidence. Attempting a 55-yarder on 4th-and-5 vs punting from the 38 is a massive fork. Special teams - hidden yards, penalty discipline, and kick strategy - is the gray area bettors ignore and books shade with priors. That’s where you can find slivers of value.
Leaning on primary sources (since direct hits are sparse)
Our earlier search had no direct hits for full-blown “first team to score predictions” models, so I default to primary sources and standardized, reproducible data:official game logs (official drive and play logs) historical football data (drive results, first-quarter splits) advanced player-tracking data for alignment, time-to-snap, and pass rush indicators team-level statistical splits for pace and first-quarter scoring references. I’ll outline exactly which signals I track and how they flow into a model.
The data signals I actually care about
First-drive scoring percentage
What it is: The share of games where a team scores on its first possession. Why it matters: It’s the single cleanest signal for scripted success and early rhythm. How to use: Calculate 1-, 4-, and 8-game rolling windows to capture both trend and noise. Adjust for opponent strength by weighting by the opponent’s defensive DVOA/EPA allowed on opening drives. Split by home/away to capture cadence and communication noise on the road.First-quarter points for and against
Offense: First-quarter points per game tells you pace and aggression. If a team is top-5 here, it likely has a real script edge. Defense: First-quarter points allowed helps identify slow-start defenses, possibly due to soft zone coverage early, conservative fits, or poor tackling in space. Where to reference: Team-level first-quarter splits at team-level statistical splits first-quarter splits.EPA/play and success rate on opening drives
EPA/play on first drives: Better than raw points because it picks up sustained efficiency that may stall due to a single penalty or long field. Success rate: Measures staying on schedule (e.g., 40% of yards on 1st down, 60% on 2nd, 100% on 3rd/4th). A higher rate reduces 3rd-and-long and improves field-goal attempt probability. Practical step: Build drive labels (opening drive vs otherwise). Aggregate EPA/play and success rate for “first-team drives by game” to feed your model.Coin toss tendencies and receive/defer logic
Track coin toss win rate (it’s random long term) but more important: What the coach does with it. Some coaches receive to set tone, others defer to play for the halftime double. Team-level rules: If opponent always defers, your side likely starts with the ball when it wins the toss. If both teams defer, receiving team is set by toss outcome and standard rules. Simulation-ready: Estimate probability Team A starts with the ball by combining each team’s defer/receive rates and coin toss randomness. Feed that as a binary feature or average probability into your model.Special teams field position and penalty discipline
Average drive start: Kickoff depth, return rate, returner quality, and coverage unit strength shape short fields or long fields. Penalties: Holding and false start rates by down and distance matter on the first series where one setback kills the drive. Punt/kick tendencies: Teams that pooch or aim for corners risk short fields if it backfires. Aggressive return units create leverage. Where to find: official game logs for drive start yard lines, PFR for ST splits, and your own tracking for penalty rates by unit.QB and kicker health (and OL/RB context)
QB: Pre-snap processing (look at sacks taken vs time-to-throw; pressure-to-sack rate). WR cohesion: Injury clusters to WR/TE groups break opening scripts. Kicker: Historical make rates at 40-55 yards. Injury status or limited warm-up reports. OL/RB: If the run game is compromised, 3rd-and-long rates jump, stalling early drives.Weather and surface
Wind: Anything sustained above ~12-15 mph lowers deep passing and long field goals. Precipitation: Wet ball affects snap, kick, and option routes on early downs. Surface: Turf vs grass tinkers with speed and cutting; some offenses look sharper on fast tracks.Travel and rest (TNF/MNF and short weeks)
Thursday night: Condensed prep leads to heavier reliance on scripting. Experienced staffs benefit. Cross-country travel: West-to-East at 1 pm ET can start slow for the traveler. Bye weeks: More time for install - both a benefit for early offense and for defense to script counters.Coaching tendencies in the first series
Play-action rate on first two plays. Run/pass mix over last 6-8 games on opening drive. Early-down aggressiveness vs two-high shells; RPO usage to settle the QB. Fourth-down choice on fringe field-goal range.
Variance caveats with small samples
Small sample alerts: First-drive scoring % can swing wildly in 4-6 games. Special teams plays are lumpy. Mitigate by: Blending long-term priors with recent form. Calibrating uncertainty bands and not overreacting to one trick-play TD.
A simple way to think about the core signals When I put the main signals together, I am basically asking the same few questions every time. How often does each team score on its opening drive? How efficient is that drive when we look beyond the final score? Who is likely to have the ball first? Which team has the better field-position and special-teams setup? Can the kicker realistically finish a drive if the offense stalls? Then I layer in weather, injuries, travel, rest, and coaching tendencies. The important part is not finding one magical stat. It is combining several small signals so the final probability is more grounded than a gut feeling. First-drive scoring rate and opening-drive EPA are usually the backbone, while special teams, kicking, and weather can move the number around the edges. Those edges are often where a betting decision gets made.
How I would build and test the model
Framing the problem
Outcome: Team A scores first (yes/no). That’s a logistic regression (or gradient-boosted) task. Unit of observation: Game-level pair (A vs B) with features that describe who starts with the ball, expected early-drive efficiency, ST edges, and environment. Output: Probability that Team A scores first. Team B is 1 minus that.Possession probability: p_start_A from coin toss simulation and receive/defer rates. Offensive early-drive quality: A_open_EPA, A_open_SR (success rate), first-drive scoring %, last 4 and last 10 games; opponent-adjusted. Defensive early-drive quality: B_def_open_EPA_allowed, B_def_1Q_points_allowed, plus pass-rush win rate proxies (from advanced player-tracking data) to pressure opening scripts. Special teams field position: A_avg_start_1Q vs league, differential vs opponent. Penalty rates: A_off_first_series_penalty%, B_def_penalty_pressure. Kicking and fourth-down tendency: A_kicker_40-55_make%, A_coach_FG_attempt_rate_4th_and_medium_on_opp_35-40. Weather and surface: Wind_sustained, turf_flag, temp, precipitation indicator. Travel and rest: Short_week_flag, long_travel_flag, off_bye_flag. Coaching openers: A_script_PA_rate_first_two, A_early_RPO_rate, A_no_huddle_usage. You don’t need every feature if data is thin. Just ensure coverage of possession, early-drive efficiency, special teams, and environment.
For each game: Simulate coin toss: p = 0.5 each side. Conditional on winner: If winner (Team A) defers x% of time and loser (Team B) defers y%: Compute probability Team A receives: p_A_receives = 0.5*(1 - x) + 0.5*y (simplified; adjust based on rule details and historical behavior). Use p_A_receives as p_start_A in your features. In practice: If both teams typically defer, p_start_A moves toward 50/50. If Team A almost always receives, p_start_A rises accordingly.Simulating coin toss and receive/defer logic
Regularization to avoid overfitting
Use L2-regularized logistic regression as your baseline. It handles correlated features well and stays stable with moderate sample sizes. If you use tree-based models (XGBoost/LightGBM), cap depth and use learning-rate decay; apply monotonicity constraints if possible (e.g., higher kicker make% should not reduce scoring-first probability). Shrink recent-form features slightly more than long-term ones to avoid chasing noise.Backtesting across seasons and weeks
Split strategy: Rolling-origin evaluation: Train on Weeks 1-10, test on Weeks 11-13; slide the window forward. Cross-season: Train on 2019-2022, test on 2023-2024 early weeks, then incrementally update. Metrics: Log loss for calibration. Brier score for probability accuracy. ROI-to-closing (if you place simulated bets using a 1-2% Kelly fraction). Stress tests: Remove the coin toss feature and check drop in log loss - confirms signal strength. Remove special teams features - see if the model’s edges vanish on lines where books shade STs.Calibration with reliability plots
Group predictions into bins (e.g., 0.40-0.45, 0.45-0.50, etc.). Compare predicted vs actual frequency that Team A scored first in each bin. Apply isotonic regression or Platt scaling if bins show under/over-confidence.Blending market-implied priors with model outputs
Convert sportsbook price to implied probability (adjusting for hold). Blend: final_p = w_modelp_model + w_marketp_market, with w_market higher early season and decreasing as data quality improves. Cap how far you’ll stray from market in low-information cases; a 3-5 percentage point guardrail is reasonable.Maintain live updates when inactives drop
Auto-refresh QB/K/WR3/OL statuses 90-60 minutes before kickoff. Recompute: p_start_A if beat reports say a coach will receive or if weather shifts late. Kicker range if warm-ups show limitations. Push new probabilities to your bet queue and pull back stale prices. Speed matters.The workflow that keeps everything organized
Data collection
official game logs: Drive results, starting field position, scoring outcomes by drive. historical football data: First-quarter points for/against, penalties, special teams summaries, kicking logs. advanced player-tracking data: Pre-snap alignment, pass-rush metrics, time-to-snap; use carefully to infer early-drive pressure and rhythm. Pace and first-quarter scoring: team-level statistical splits first-quarter splits. Internal notes: Coach presser transcripts on receive/defer tendencies, kicker pre-game reports, and wind readings close to kickoff.Wrangling with R and Python
R packages: play-by-play data tools to pull play-by-play, joins to build drive-level tables, then compute opening-drive features. Python packages: pandas for joins and aggregations, scikit-learn for logistic regression and calibration, tree-based modeling alternatives for alternative models. Feature engineering steps: Tag opening drives (home and away separately). Aggregate EPA/play, success rate, first-drive scoring %, and penalty rates. Join weather data and ST metrics by week and venue. Create lagged windows (L4, L8, season-to-date) with exponential decay.Cross-validation that respects time
Don’t leak the future. Use time-aware folds (e.g., train on first 10 weeks, validate on next 2-3). Keep teams intact across folds so features derived from team histories don’t bleed across time.Compare model edge vs implied probability, then set thresholds
Steps: Convert book price to implied probability after removing hold. Compute edge = p_model - p_implied for each side. Filter to edge >= 2-3 percentage points as a soft floor; 4-6 points for stronger conviction depending on variance. If p_start_A is ~0.50 and model edge is narrow, pass. Coin-toss variance is brutal; protect the bankroll.Useful templates you can copy
Data notebook/checklist for each slate: Pull last update time for injuries. Check K and OL statuses. Weather snapshot at T-90 and T-45. ST differential report (avg start field position L4). Receive/defer matrix for both teams. Betting tracker columns: Game, Bet side, Odds, Implied probability (net), Model probability, Edge, Stake, Kelly fraction used, CLV result, Outcome (who scored first), Attribution notes (coin toss, ST penalty, long FG, turnover), Next action.
Example runbook for game day (step-by-step)
T-120 min: Refresh model priors and open preliminary numbers. Mark weather risk games (wind > 12 mph). T-90 min: Inactives incoming. Update QB/WR/K/OL flags. Recompute kicker range and 4th-down tendences if kicker is questionable. T-75 min: Re-blend with updated market prices. Identify edges > 3 p.p. T-60 min: Place initial positions at target books. Log prices in tracker. T-45 min: If meaningful line movement, re-check edge. Add or reduce positions if rules allow. T-15 min: Scan beat reports for toss intentions (rare, but occasionally mentioned). Final weather check. Kickoff: No chasing. Document next-day notes.