

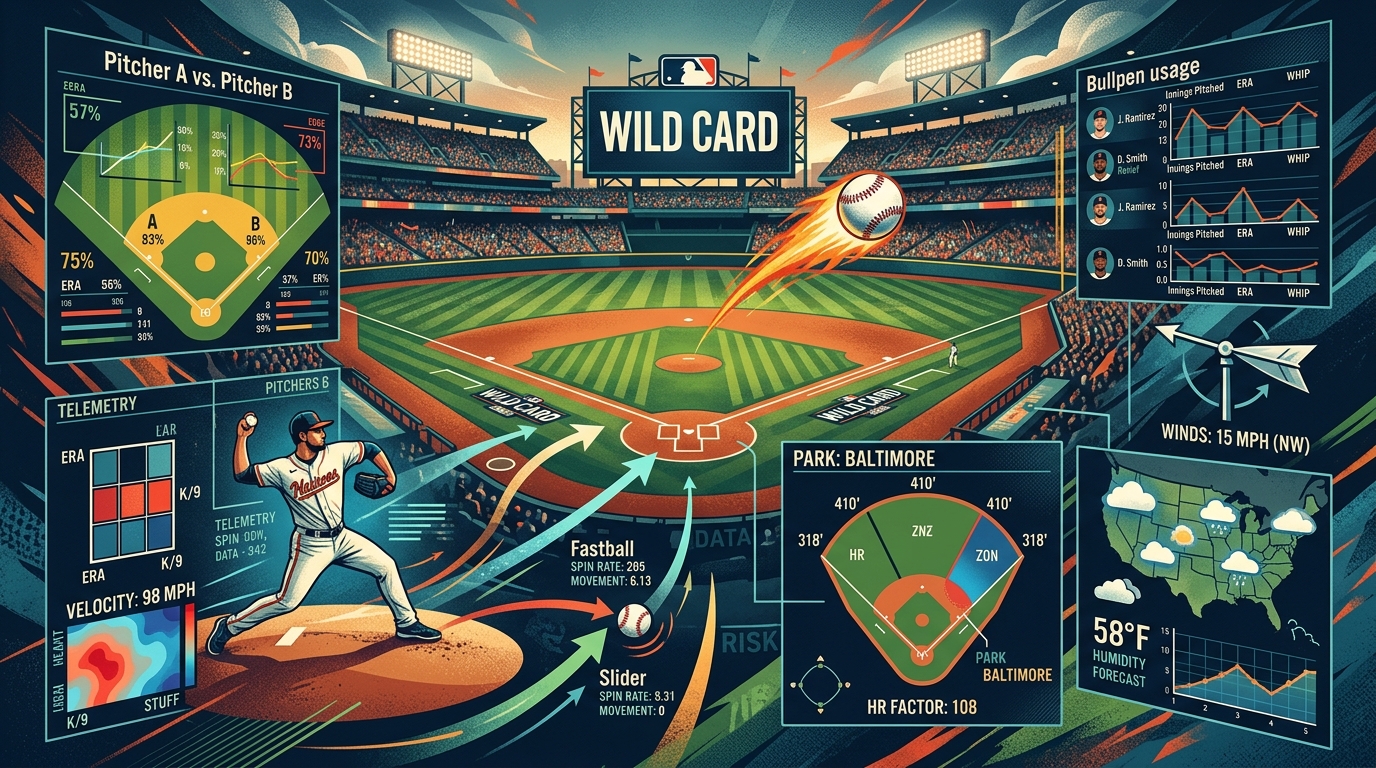
I’m a sports analyst who blends film, numbers, and machine learning to read games before they unfold. MLB is one of the most interesting sports to model because there are so many small variables working at the same time. A starting pitcher can dominate for five innings, a bullpen can completely change the game in the seventh, and one change in wind direction can turn a routine fly ball into a home run. When all of those things happen in a Wild Card game, the margin for error gets even smaller.
In this article, I’m going to walk through how I approach MLB Wild Card matchup analysis using pitching, offense, bullpen availability, park factors, weather, defense, baserunning, umpire tendencies, lineup construction, and game script. The goal is not to create some complicated formula that looks impressive but does not work in the real world. The goal is to build a repeatable process that turns raw information into probabilities.
AI can make that process much faster, especially when there are thousands of data points to consider. But AI should not be treated like a crystal ball. A model is only useful when the data is clean, the assumptions make sense, and the probabilities are properly calibrated. Baseball has too much randomness for anyone to eliminate uncertainty completely.
The best approach is to price the matchup instead of simply picking a team because it has a better record or a more recognizable lineup. A Wild Card game is a different environment from an ordinary regular-season game. Managers shorten their rotations, bullpens become more important, pinch-hitters can appear earlier, and every late-inning decision carries more weight.
That is what makes MLB Wild Card matchup analysis so interesting. You are not just asking who is better. You are trying to understand how the specific version of this game is likely to play out.
Table Of Contents
Wild Card Windows: A Practical MLB Matchup Analysis for Bettors Using AI
Pitching Matchup Breakdown
Bullpen and Leverage Strategy
Offense Splits and Park Factors
Defense and Baserunning Edges
Context, Umpire and Game Script Forecast
Quick Worksheets and Checklists
Example Workflow on Gameday
Putting the Pieces Together With Simple Math
Common Wild Card Wrinkles to Price In
Tools and Templates You Can Reuse
How to Validate and Avoid Overfitting
Bringing It Into a Wild Card Mindset
Practical Example Prompts for Yourself
Step-by-Step Final Pricing Flow You Can Reuse Nightly
Wild Card Betting Snapshots to Have Ready
Manager Patterns Worth a Note
Your Nightly Wild Card One-Pager
Conclusion
Frequently Asked Questions
Wild Card Windows: A Practical MLB Matchup Analysis for Bettors Using AI
The first thing I want to establish is that Wild Card analysis should not simply be a copy of regular-season analysis. The basic statistics still matter, obviously, but the way those statistics are used needs to change.
During a normal regular-season game, a manager may give a starting pitcher some room to work through trouble. If a pitcher gives up a couple of hard-hit balls in the fourth inning, there is usually no reason to panic. There are still plenty of games left on the schedule, and managers have to manage their pitching staff over a long season.
The Wild Card environment is different.
A manager can make a faster move because there is no tomorrow if the team loses. A high-leverage reliever who normally appears in the eighth inning might be used in the sixth if the heart of the opposing order is coming up. A starter who averaged six innings during the regular season might only be expected to face 18 or 20 batters.
That changes the entire run distribution of the game.
This is why I like thinking about Wild Card analysis as scenario pricing. Instead of asking one simple question, such as which team has the better starting pitcher, I want to understand several possible game paths.
What happens if the starter dominates through six innings? What happens if he exits after four? What happens if the game is tied in the seventh? What happens if one team's closer is unavailable? What happens if a key left-handed hitter gets pinch-hit for before facing the opposing team's best right-handed reliever?
These questions are where an AI model can become useful. It can process many different scenarios and estimate how much each one changes the overall probability.
The goal is not to pretend the model knows exactly what will happen. The goal is to understand the range of things that can happen and determine which variables matter most.
Pitching Matchup Breakdown
How I Profile the Expected Starters
Starting pitching is where I usually begin my MLB Wild Card matchup analysis.
The first step is confirming who is actually expected to start and which side of the plate that pitcher works from. It sounds basic, but this information needs to be accurate before anything else happens. If the starting pitcher changes, the entire matchup can change with him.
Once the starter is confirmed, I start with the surface statistics. ERA, innings pitched, WHIP, strikeout rate, and walk rate give me a basic understanding of the pitcher.
But I do not stop there.
ERA tells me what happened. I also want to understand why it happened.
That means looking at xERA, FIP, xFIP, strikeout percentage, walk percentage, hard-hit rate, barrel rate, ground-ball rate, and expected contact quality. These numbers can reveal whether the surface results are supported by underlying skills.
For example, imagine two pitchers both have a 3.20 ERA. One has excellent strikeout and walk numbers and consistently limits hard contact. The other has a much lower strikeout rate, a higher walk rate, and a rising barrel percentage.
The ERA makes them look almost identical.
The underlying profile does not.
That difference can become important in a one-game postseason matchup.
Pitch Mix and Matchup Fit
The next thing I want to understand is how the starter's pitch mix interacts with the opposing lineup.
A pitcher might rely heavily on a four-seam fastball and slider. Another might use a sinker, changeup, and sweeper. A third pitcher might be extremely dependent on a particular breaking ball.
The question is not simply whether those pitches are good.
The question is whether they are good against this particular lineup.
If a pitcher throws a slider 40 percent of the time and the opposing lineup has several hitters who consistently handle sliders well, I want the model to recognize that. That does not mean the pitcher suddenly becomes bad. It means the expected outcome should be adjusted because the matchup is less favorable than his general season numbers suggest.
The same thing works in reverse.
If a pitcher has a strong breaking ball and the opposing lineup has a high chase rate against that pitch, the strikeout projection may deserve a small increase.
This is one of the biggest reasons I prefer matchup analysis over simply ranking pitchers from best to worst.
A great pitcher can have a difficult matchup. An average pitcher can have a very favorable one.
Surface ERA Versus Underlying Skills
One of the easiest mistakes in MLB analysis is putting too much weight on ERA.
ERA is useful, but it can be influenced by defense, sequencing, home-run variance, strand rate, and other factors. That is why I like comparing ERA with xERA and FIP.
If a pitcher has a 2.80 ERA but a 4.00 xERA and his hard-hit rate has been rising, I do not automatically expect the ERA to continue.
Likewise, if another pitcher has a 4.10 ERA but strong strikeout-minus-walk numbers, good contact suppression, and a stable velocity profile, I may expect better future performance.
The important thing is not to blindly replace ERA with another statistic.
Instead, combine several indicators.
AI models are particularly useful here because they can consider many inputs at once. A human analyst might notice the ERA and FIP difference, while a model can also consider pitch usage, opponent splits, contact quality, park effects, and expected innings.
That creates a much more complete projection.
Recent Thirty-Day Trends
Recent form matters, but it should not completely replace long-term information.
I usually want the full-season profile to establish the foundation and then use recent performance as a modifier. The last 30 days can tell us whether something has changed.
Maybe a pitcher has added a new pitch.
Maybe his velocity has moved.
Maybe his strikeout rate has jumped.
Maybe his walk rate has suddenly increased.
Maybe the pitcher is allowing much harder contact than he was earlier in the season.
Those changes are worth investigating.
But a short sample can also contain random variation. A pitcher can give up three home runs in one game and suddenly look terrible in a 30-day sample even though nothing fundamental changed.
This is why recent form should have enough weight to identify potential changes without completely overwhelming the long-term baseline.
Times Through the Order
Times through the order becomes even more interesting during the Wild Card stage.
A starter might be excellent the first time through the lineup but become less effective when hitters have seen his pitches multiple times.
The third trip through the order can bring more hard contact, walks, and scoring opportunities.
However, the manager may not allow the starter to reach that point.
That creates an interesting modeling problem.
If a starter normally averages six innings but the manager has a rested bullpen and a short postseason leash, I may project fewer innings. If the bullpen is exhausted, the same manager may allow the starter to work deeper.
So the TTO penalty and the manager's expected hook have to be connected.
That is a good example of why MLB game prediction is not just about individual statistics. The statistics interact with decisions.
Bullpen and Leverage Strategy
Bullpen analysis is one of the biggest areas where I think people can miss the real Wild Card matchup.
A bullpen can have a strong season-long ERA and still be in a difficult situation if its best relievers have worked heavily during the previous few days.
The opposite can also happen.
A bullpen with an ordinary overall ERA can become much more effective when its highest-leverage arms are fully rested and available.
So instead of asking, “Which bullpen has the better ERA?” I want to ask, “Which important relievers can realistically pitch tonight?”
Last Seven Days Workload
For every major reliever, I want to know recent innings, pitch counts, appearances, and whether the pitcher has worked on consecutive days.
A reliever who threw 20 pitches yesterday might still be available. But availability and expected effectiveness are not exactly the same thing.
That is where a fatigue index can help.
The exact formula can vary, but the basic concept is simple. Start with recent innings and pitch counts, add extra weight for back-to-back appearances, and increase the fatigue score when a reliever has been used repeatedly over several days.
The number itself is less important than consistency.
If I use the same approach for every team, I can compare bullpen availability without relying on vague descriptions like “the bullpen looks tired.”
Leverage Roles
The next step is understanding which relievers are most likely to appear in the highest-leverage situations.
The closer is not always going to pitch the ninth.
If the opposing team's best hitters are due up in the seventh and the game is tied, the manager may use his best available reliever then.
This is why I prefer thinking in terms of leverage roles rather than inning labels.
The most important question is who the manager trusts when the game is actually on the line.
That can change the expected scoring distribution.
A strong reliever entering in the seventh may lower immediate scoring expectations, but it could also leave a weaker option for the eighth or ninth.
A good model should account for that.
Platoon Matchups
Platoon matchups are especially important in the late innings.
Suppose a team has three left-handed hitters coming up, but its opponent's best left-handed reliever is unavailable. That could change the expected scoring probability for that inning.
Now imagine the opposite situation. A team has several left-handed hitters, and the opposing manager has two rested high-quality left-handed relievers.
That creates a very different late-game environment.
This is also where pinch-hitting comes into play.
A hitter who has a great matchup against the starter may not have the same advantage against the bullpen. The model should therefore consider expected plate appearances rather than assuming every starter automatically gets four or five trips to the plate.
Offense Splits and Park Factors
Handedness Matters
When evaluating offense, I want to know how the lineup performs against the specific handedness of the opposing starter.
A team's overall offensive ranking can hide important differences.
A lineup might be excellent against right-handed pitching but much weaker against left-handed pitching. Another team may have a balanced lineup with fewer platoon weaknesses.
This becomes especially important when the opposing bullpen has multiple high-quality relievers from one side.
I look at production, strikeout rate, walk rate, chase rate, contact rate, hard-hit rate, barrel rate, and batted-ball distribution.
The goal is to understand the type of offense, not just the amount of offense.
Plate Discipline
Plate discipline can become extremely important against certain starters.
A patient offense can force a pitcher to throw more strikes. If that pitcher already has command problems, the result can be longer at-bats, higher pitch counts, and earlier bullpen exposure.
A high-chase offense may struggle against a pitcher who has a strong breaking-ball combination.
This creates a direct connection between offense and pitching.
Instead of saying that a pitcher has a high strikeout rate, I want to know whether the opposing lineup is actually likely to allow him to produce those strikeouts.
Park Factors
The stadium itself changes how contact becomes production.
Some parks reward home runs. Some suppress them. Some create more opportunities for doubles and triples. Some have larger outfields that make defense more important.
That means park factors should be part of the model.
However, I do not want to simply apply one generic park adjustment.
I want to connect the park to the specific teams.
If one offense has a lot of pull-side fly-ball power and the park has a short porch in that direction, that team may benefit more than a ground-ball-heavy offense.
The same park can therefore affect two teams differently.
Defense and Baserunning Edges
Defense is easy to overlook because it does not always appear in the most obvious box-score statistics.
But in a tight Wild Card game, a defensive play can be worth a lot.
An outfielder with excellent range can turn a hard-hit ball into an out. A strong defensive catcher can reduce extra bases and improve the effectiveness of a pitcher. An infielder with excellent range can prevent singles from becoming runners on base.
Statcast-style defensive measurements can help quantify some of this.
I also pay attention to catcher framing and blocking because those skills interact directly with pitching.
A pitcher who works around the edge of the zone may benefit more from a strong receiver than a pitcher who consistently attacks the middle.
Baserunning Pressure
Baserunning creates another layer of matchup value.
A fast team facing a pitcher with a slow delivery and a catcher with weaker throwing results may have more stolen-base opportunities.
That does not mean a steal will automatically happen.
The score, inning, count, manager, runner, pitcher, and catcher all matter.
But if several of those factors line up, the model can increase the expected value of baserunning events.
This can also affect totals because stolen bases move runners into scoring position without requiring a hit.
Context, Umpire and Game Script Forecast
Rest and Schedule Context
Schedule context matters, especially during postseason play.
A team that has been using its bullpen heavily may have fewer options available.
The most important part is to quantify that usage instead of relying on vague fatigue narratives.
If the top relievers have had two days off, they may be in excellent position to handle high-leverage innings.
If the same relievers have appeared three times in four days, their expected availability may be lower.
That can change the late-game projection.
Umpire Tendencies
The plate umpire can influence the shape of a game through strike-zone tendencies.
A tighter zone can increase walks and pitch counts. A wider zone can help pitchers who attack the edges.
This can have an indirect effect on bullpen usage.
If starters are forced into deeper counts, they may reach their pitch limit earlier.
That can bring the bullpen into the game sooner.
Again, the adjustment should be conservative. The umpire is one variable, not the entire game.
Managerial Tendencies
Manager behavior is another piece of the puzzle.
Some managers have historically been quicker to remove starters. Others allow their best pitchers to work through difficult situations.
In a Wild Card game, those tendencies may become even more important.
A manager with a rested bullpen may remove a starter after a difficult matchup appears. A manager with fewer options may allow the starter to continue.
This is why projected innings should be based on the situation rather than simply the pitcher's season average.
Quick Worksheets and Checklists
Pre-Game Analysis
Before the game, I want to have the starting pitchers, handedness, ERA, xERA, FIP, recent strikeout-minus-walk percentage, hard-hit rate, barrel rate, pitch mix, and expected innings available.
I then move to the bullpen and record recent usage, back-to-back appearances, expected availability, and likely high-leverage arms.
For offense, I record handedness-specific production, strikeout and walk rates, chase behavior, contact quality, and pinch-hit exposure.
Then I add park and weather information.
Finally, I review defense, baserunning, schedule context, umpire tendencies, and managerial behavior.
This process sounds long, but after enough repetition it becomes fairly quick.
The point is to create a consistent routine.
Live Game Triggers
Live analysis should focus on meaningful changes.
A noticeable velocity decline combined with worsening command can be important.
A starter who suddenly cannot locate his secondary pitches can also create a meaningful change.
A high-leverage reliever warming earlier than expected can tell us something about the manager's plan.
A lineup change can alter the expected matchup.
The key is not to react to every pitch.
Baseball is full of random events. A single hard-hit ball does not necessarily indicate that a pitcher has suddenly become ineffective.
Live modeling works best when it identifies persistent changes rather than isolated events.
Example Workflow on Gameday
Morning
The morning process begins with the probable starters.
I establish the long-term pitching baseline, review recent form, and identify any major changes in velocity, pitch usage, or command.
Then I create an initial bullpen availability estimate.
At this point, I do not want the model to be overly specific because lineups and weather may still change.
Midday
Next, I add park and weather conditions.
I look at the expected wind, temperature, and other environmental factors and then connect those conditions to the offensive profiles.
The same wind does not affect every lineup equally.
A fly-ball-heavy offense may receive more benefit from wind blowing out than a ground-ball-heavy offense.
Two Hours Before First Pitch
Once lineups become available, I update the offensive projection.
This is one of the most important updates of the day because lineup changes can affect both team production and player opportunities.
I also incorporate the expected umpire tendencies.
One Hour Before First Pitch
Now the model has most of the major inputs.
I run thousands of simulations using the expected starters, lineups, bullpen availability, park, weather, and managerial assumptions.
The result is a probability distribution rather than one predicted score.
That is important.
A game may have a projected average of seven runs, but that does not mean seven runs is the most likely exact final score.
The model should show how often the game lands in different scoring ranges.
Putting the Pieces Together With Simple Math
The math does not have to be complicated to be useful.
Imagine a starting pitcher with an effective RA9 of 3.90 after combining his season baseline with recent form.
Suppose the matchup creates a favorable pitch-fit adjustment of negative 0.10 runs. Then suppose park and weather create a positive 0.10 adjustment.
The final projection returns to approximately 3.90 RA9.
Now assume the expected workload is 5.1 innings.
The expected runs allowed are approximately:
3.90 divided by 9, multiplied by 5.1.
That gives roughly 2.21 expected runs.
The calculation is simple.
The difficult part is estimating the inputs correctly.
The same idea applies to the bullpen.
Instead of taking the bullpen's overall ERA, I estimate which relievers are likely to pitch and how many innings each one is expected to cover.
Then I adjust for workload, platoon matchups, and leverage.
Offensive projections work similarly.
Start with the team's production against the relevant handedness, then adjust for starting pitcher quality, bullpen quality, park, weather, defense, and expected lineup availability.
The final result is an estimate of expected runs.
Common Wild Card Wrinkles to Price In
Early Hooks
One of the biggest postseason adjustments is the possibility of an early starting pitcher hook.
A starter who would normally be projected for six innings might only be expected to pitch five in an elimination game.
That changes everything.
If the bullpen is rested, the manager may be comfortable making the change earlier.
If the bullpen is exhausted, the manager may have to leave the starter in longer.
The model should understand that difference.
Piggybacks
Some teams may use an opener or bulk-relief strategy.
The pitcher listed as the starter may not actually be the pitcher expected to handle most of the innings.
This means the model should focus on expected pitcher exposure instead of simply looking at the official starter.
Pinch-Hitting
Pinch-hitting can create major changes in player opportunities.
A left-handed hitter may have a great matchup against the starter but a poor matchup against a late-game left-handed reliever.
That means expected plate appearances should account for potential substitutions.
This is particularly important when modeling player props.
Tools and Templates You Can Reuse
A simple starter and bullpen worksheet can keep the process organized.
For each starting pitcher, record the ERA, xERA, FIP, recent strikeout-minus-walk percentage, hard-hit rate, barrel rate, pitch mix, pitch-fit assessment, and expected innings.
For each bullpen, record the top available relievers, recent pitch counts, consecutive-day usage, handedness, and expected leverage roles.
For offense, record handedness-specific production, recent discipline numbers, contact quality, and pinch-hit exposure.
Then add park and weather information.
The goal is not to make the worksheet complicated.
The goal is to make sure the same important information gets checked every time.
How to Validate and Avoid Overfitting
Overfitting is one of the biggest problems in sports prediction.
It is incredibly easy to discover a relationship in historical data that looks powerful but does not actually hold up in the future.
That is why model validation has to respect time.
If you are predicting games from October, you cannot use information from those games to build the model that supposedly predicted them.
Walk-forward validation is much more useful because it recreates the way the model would have operated in real life.
Calibration is also important.
If a model says an outcome has a 70 percent probability, that event should happen close to 70 percent of the time over a sufficiently large sample.
That is much more meaningful than simply looking at how many games the model predicted correctly.
A model can have a good win rate while still producing poorly calibrated probabilities.
I also want to know which variables actually drive the model.
If a tiny change in weather completely changes the output, the model may be overreacting.
If removing one minor feature destroys the projection, that feature may have too much influence.
The best models are usually not the ones with the most complexity.
They are the ones that remain useful when the conditions change.
Bringing It Into a Wild Card Mindset
The biggest adjustment I make for Wild Card games is thinking about leverage.
Regular-season innings distributions are useful starting points, but they should not automatically determine postseason expectations.
The best relievers can appear earlier.
Starters can be removed sooner.
Pinch-hitters can appear earlier.
Defensive replacements can become more important.
All of these decisions change the expected game script.
That means Wild Card analysis should be built around the specific situation.
A team's regular-season bullpen ERA is not enough.
A starter's average innings are not enough.
A hitter's season-long plate appearances are not enough.
Everything needs context.
Practical Example Prompts for Yourself
When looking at the starting pitchers, ask which pitch is most likely to determine the matchup.
Then ask whether the opposing lineup handles that pitch well.
For the bullpen, ask what happens if the closer is unavailable.
Then ask who is likely to handle the seventh, eighth, and ninth innings.
For offense, ask whether the top hitters are likely to face the starter three times.
Then ask which hitters could be removed against late-game specialists.
For park and weather, ask which team has the batted-ball profile that benefits most from the conditions.
For the umpire, ask whether the expected zone could increase walks, strikeouts, or pitch counts.
For game script, ask what happens if the starter leaves in the fourth inning.
Then ask what happens if the game is tied entering the seventh.
These questions help turn a basic prediction into a complete matchup analysis.
Step-by-Step Final Pricing Flow You Can Reuse Nightly
Start with the baseline ratings for the starting pitchers.
Then establish the offensive strength against each pitcher's handedness.
Next, apply pitch-fit adjustments.
Add park and weather.
Then evaluate bullpen availability and expected leverage deployment.
Add expected umpire effects.
Estimate the starting pitchers' workloads and possible early hooks.
Run the simulation.
Convert the probability into a fair price.
Then compare that fair price with the market.
This is where probability becomes useful.
A prediction alone is not necessarily valuable. The probability has to be compared with the available price.
After the game, record what happened and compare it with the original assumptions.
Did the starter last as long as expected?
Was the bullpen used as projected?
Did the weather behave as expected?
Did the lineup create the expected platoon matchups?
Did the model overreact to something?
That post-game review is how the process improves.
Wild Card Betting Snapshots to Have Ready
If two starting pitchers project similarly but one bullpen is much more rested, the full-game projection may be different from the first-five projection.
If one offense has excellent plate discipline and the game environment creates more opportunities for walks, that can increase its scoring expectation.
If a team has several left-handed hitters and the opposing bullpen has strong left-handed options, late-game production may be lower than the full-season offensive numbers suggest.
If a lineup produces a lot of hard contact but mostly on the ground, a home-run-friendly environment may not help as much as it would help a fly-ball-heavy offense.
This is why player props and team markets should be connected to actual player profiles.
Manager Patterns Worth a Note
Managers can change the shape of a Wild Card game without changing a single player on the roster.
An aggressive manager may use a pinch-hitter earlier.
Another manager may allow the starter to face the lineup a third time.
One manager may use the closer for four outs.
Another may save him strictly for the ninth.
Defensive replacements can also change late-game scoring expectations.
These tendencies are not about labeling one manager as better than another. They are simply inputs that help estimate what is likely to happen.
Your Nightly Wild Card One-Pager
For the starters, record the expected RA9, projected innings, pitch-fit assessment, and volatility.
For the bullpen, record the top available arms, fatigue levels, handedness, and expected leverage roles.
For offense, record production against the relevant handedness, strikeout-minus-walk percentage, hard-hit rate, barrel rate, and pinch-hit risk.
For park and weather, record the relevant environmental conditions and how they interact with each offense.
For the umpire, record the expected strike-zone profile and the impact on strikeouts and walks.
For game script, record the expected starter hook point and the likely bullpen sequence.
For pricing, record the model's fair probability and compare it with the available market price.
After the game, record which assumptions were supported and which ones were wrong.
This creates a useful history of your analysis.
Over time, you can identify which inputs consistently help and which ones create unnecessary noise.
Conclusion
MLB Wild Card matchup analysis is much more than comparing two team records or choosing the starting pitcher with the lowest ERA.
The strongest analysis starts with pitching but goes much deeper. You want to understand underlying pitcher quality, pitch mix, recent form, velocity, command, contact quality, handedness, and expected workload.
Then you move into the bullpen.
Who is available?
Who is rested?
Who can handle the highest-leverage situation?
Which platoon matchups are likely to appear?
Those questions can have a major impact on a one-game postseason environment.
Offense needs the same level of context.
A team's overall offensive ranking is useful, but handedness splits, chase rate, contact quality, hard-hit rate, barrel rate, and pinch-hit risk can tell you much more about the specific matchup.
Then come park and weather.
These factors should not dominate the model, but they can create important differences when they interact with a team's batted-ball profile.
Defense and baserunning add another layer.
Catcher performance, outfield range, infield defense, runner speed, pitcher delivery, and catcher throwing ability can all influence close games.
Finally, bring everything together through simulation and probability.
The goal is not to predict every event perfectly. Baseball is too random for that.
The goal is to create a fair estimate of what is likely to happen, understand the uncertainty around that estimate, and identify which assumptions matter most.
That is also where AI can be useful.
ATSwins is built around an AI-driven sports analytics approach that turns game information into projections, probabilities, market analysis, player props, and tracking tools. The platform is designed to help users evaluate games through numbers rather than relying entirely on intuition.
The most important mindset is simple: price scenarios, not vibes.
A Wild Card game can change in one pitch, one managerial decision, one bullpen matchup, or one defensive play. A good model does not pretend those events can be eliminated. It accounts for their probability and keeps the analysis grounded in measurable information.
That is what makes MLB Wild Card matchup analysis useful.
It gives you a structured way to think about the game before it starts, update the projection when important information changes, and review the process after the final out.
Frequently Asked Questions
What Is MLB Wild Card Matchup Analysis and Why Does It Matter?
MLB Wild Card matchup analysis is the process of evaluating a postseason game through starting pitching, bullpen availability, offensive splits, defense, baserunning, park conditions, weather, umpire tendencies, lineups, and managerial strategy.
It matters because a Wild Card game is not managed exactly like an ordinary regular-season game.
A manager may shorten the starting pitcher's leash, use a high-leverage reliever earlier, pinch-hit more aggressively, or make defensive substitutions sooner.
That means season-long statistics alone may not fully describe the expected game.
When I build an MLB Wild Card projection, I want to know the starting pitchers' underlying skills, how their pitch arsenals match the opposing lineups, how many innings they are realistically expected to work, and which bullpen arms are available.
I then look at the offense.
How does each team perform against the starter's handedness?
How often does the lineup chase?
How well does it make contact?
Does the team rely on pulled fly balls or ground balls?
Could several hitters be replaced later in the game?
After that, I add the park, weather, defense, baserunning, umpire, and managerial context.
The goal is to turn all of those factors into probabilities rather than relying on one statistic.
Which Stats Matter Most in MLB Wild Card Matchup Analysis?
There is no single statistic that explains a Wild Card matchup.
For pitchers, I pay close attention to xERA, FIP, strikeout percentage, walk percentage, strikeout-minus-walk percentage, hard-hit rate, barrel rate, ground-ball rate, pitch mix, velocity, and expected contact quality.
ERA still matters, but it should be interpreted alongside those indicators.
For hitters and offenses, I look at production against the relevant handedness, strikeout rate, walk rate, chase rate, contact rate, hard-hit rate, barrel rate, and batted-ball profile.
For bullpens, recent usage is extremely important.
A reliever's season-long numbers tell me about his general ability. His workload over the previous few days tells me whether that ability is likely to be available tonight.
Park and weather information then helps determine how contact may translate into actual scoring.
Defense and baserunning provide additional context.
The important thing is to combine these statistics instead of treating one number as the answer.
How Do You Actually Model MLB Wild Card Matchups Without Overfitting?
The process begins with information that would have been available before the game.
I establish long-term baselines first.
Then I add recent information without allowing a short sample to completely override the larger history.
The model can then incorporate pitch-mix fit, handedness, bullpen fatigue, park conditions, weather, lineup changes, expected starter workload, and managerial behavior.
From there, thousands of simulations can be run to create a distribution of possible outcomes.
The simulations should account for different starting pitcher exit points, bullpen sequences, scoring environments, pinch-hit situations, and late-game scenarios.
Validation is critical.
The model should be tested on future games rather than simply measuring how well it explains the historical data used to build it.
Calibration also matters.
If the model gives an event a 60 percent probability, that event should occur close to 60 percent of the time over a sufficiently large sample.
The goal is not to create a model that looks perfect in a historical test.
The goal is to create a model that remains useful when it encounters new games.
How Do Weather, Park, and the Umpire Shift MLB Wild Card Matchup Analysis?
Weather, park, and umpire conditions can influence the game, but they should generally be treated as modifiers rather than the foundation of the projection.
Weather can influence ball carry, especially when wind and temperature interact with a team's batted-ball profile.
Park dimensions can influence home runs, doubles, triples, and defensive positioning.
The same environment can affect two teams differently because their offensive profiles are different.
A fly-ball-heavy lineup with strong pull power may benefit more from favorable conditions than a ground-ball-oriented offense.
The umpire can influence the strike zone.
A tighter zone may create more walks and longer plate appearances. A wider zone may increase the effectiveness of pitchers who attack the edges.
Those changes can also affect starting pitcher workload and bullpen timing.
The important part is not to exaggerate these factors.
They should influence the model when the evidence supports the adjustment, but they should not completely overwhelm stronger inputs such as pitcher skill, lineup quality, and bullpen availability.
How Does ATSwins Help With MLB Wild Card Matchup Analysis?
ATSwins uses an AI-driven sports analytics approach to produce projections, probabilities, market analysis, player prop information, and other data-driven outputs. The platform covers MLB along with several other major sports.
For MLB Wild Card matchup analysis, the value is in bringing different pieces of information into one analytical workflow.
Instead of looking at a starting pitcher in isolation, the broader process can consider the matchup, projected game environment, market information, and expected outcomes.
Player props can also be viewed through the context of the expected game script.
A strikeout projection should consider the pitcher's strikeout ability, the opposing lineup's contact and chase profile, expected innings, and potential early hooks.
A total-bases projection should consider expected plate appearances, quality of contact, opposing pitcher characteristics, and park conditions.
The same idea applies to team-level projections.
ATSwins is designed around decision support rather than pretending that sports outcomes are guaranteed. The broader purpose is to turn complicated sports data into probabilities and market information that can be evaluated consistently.
That is ultimately what good MLB Wild Card matchup analysis should do.
It should not promise certainty.
It should provide a clearer way to understand the game.