

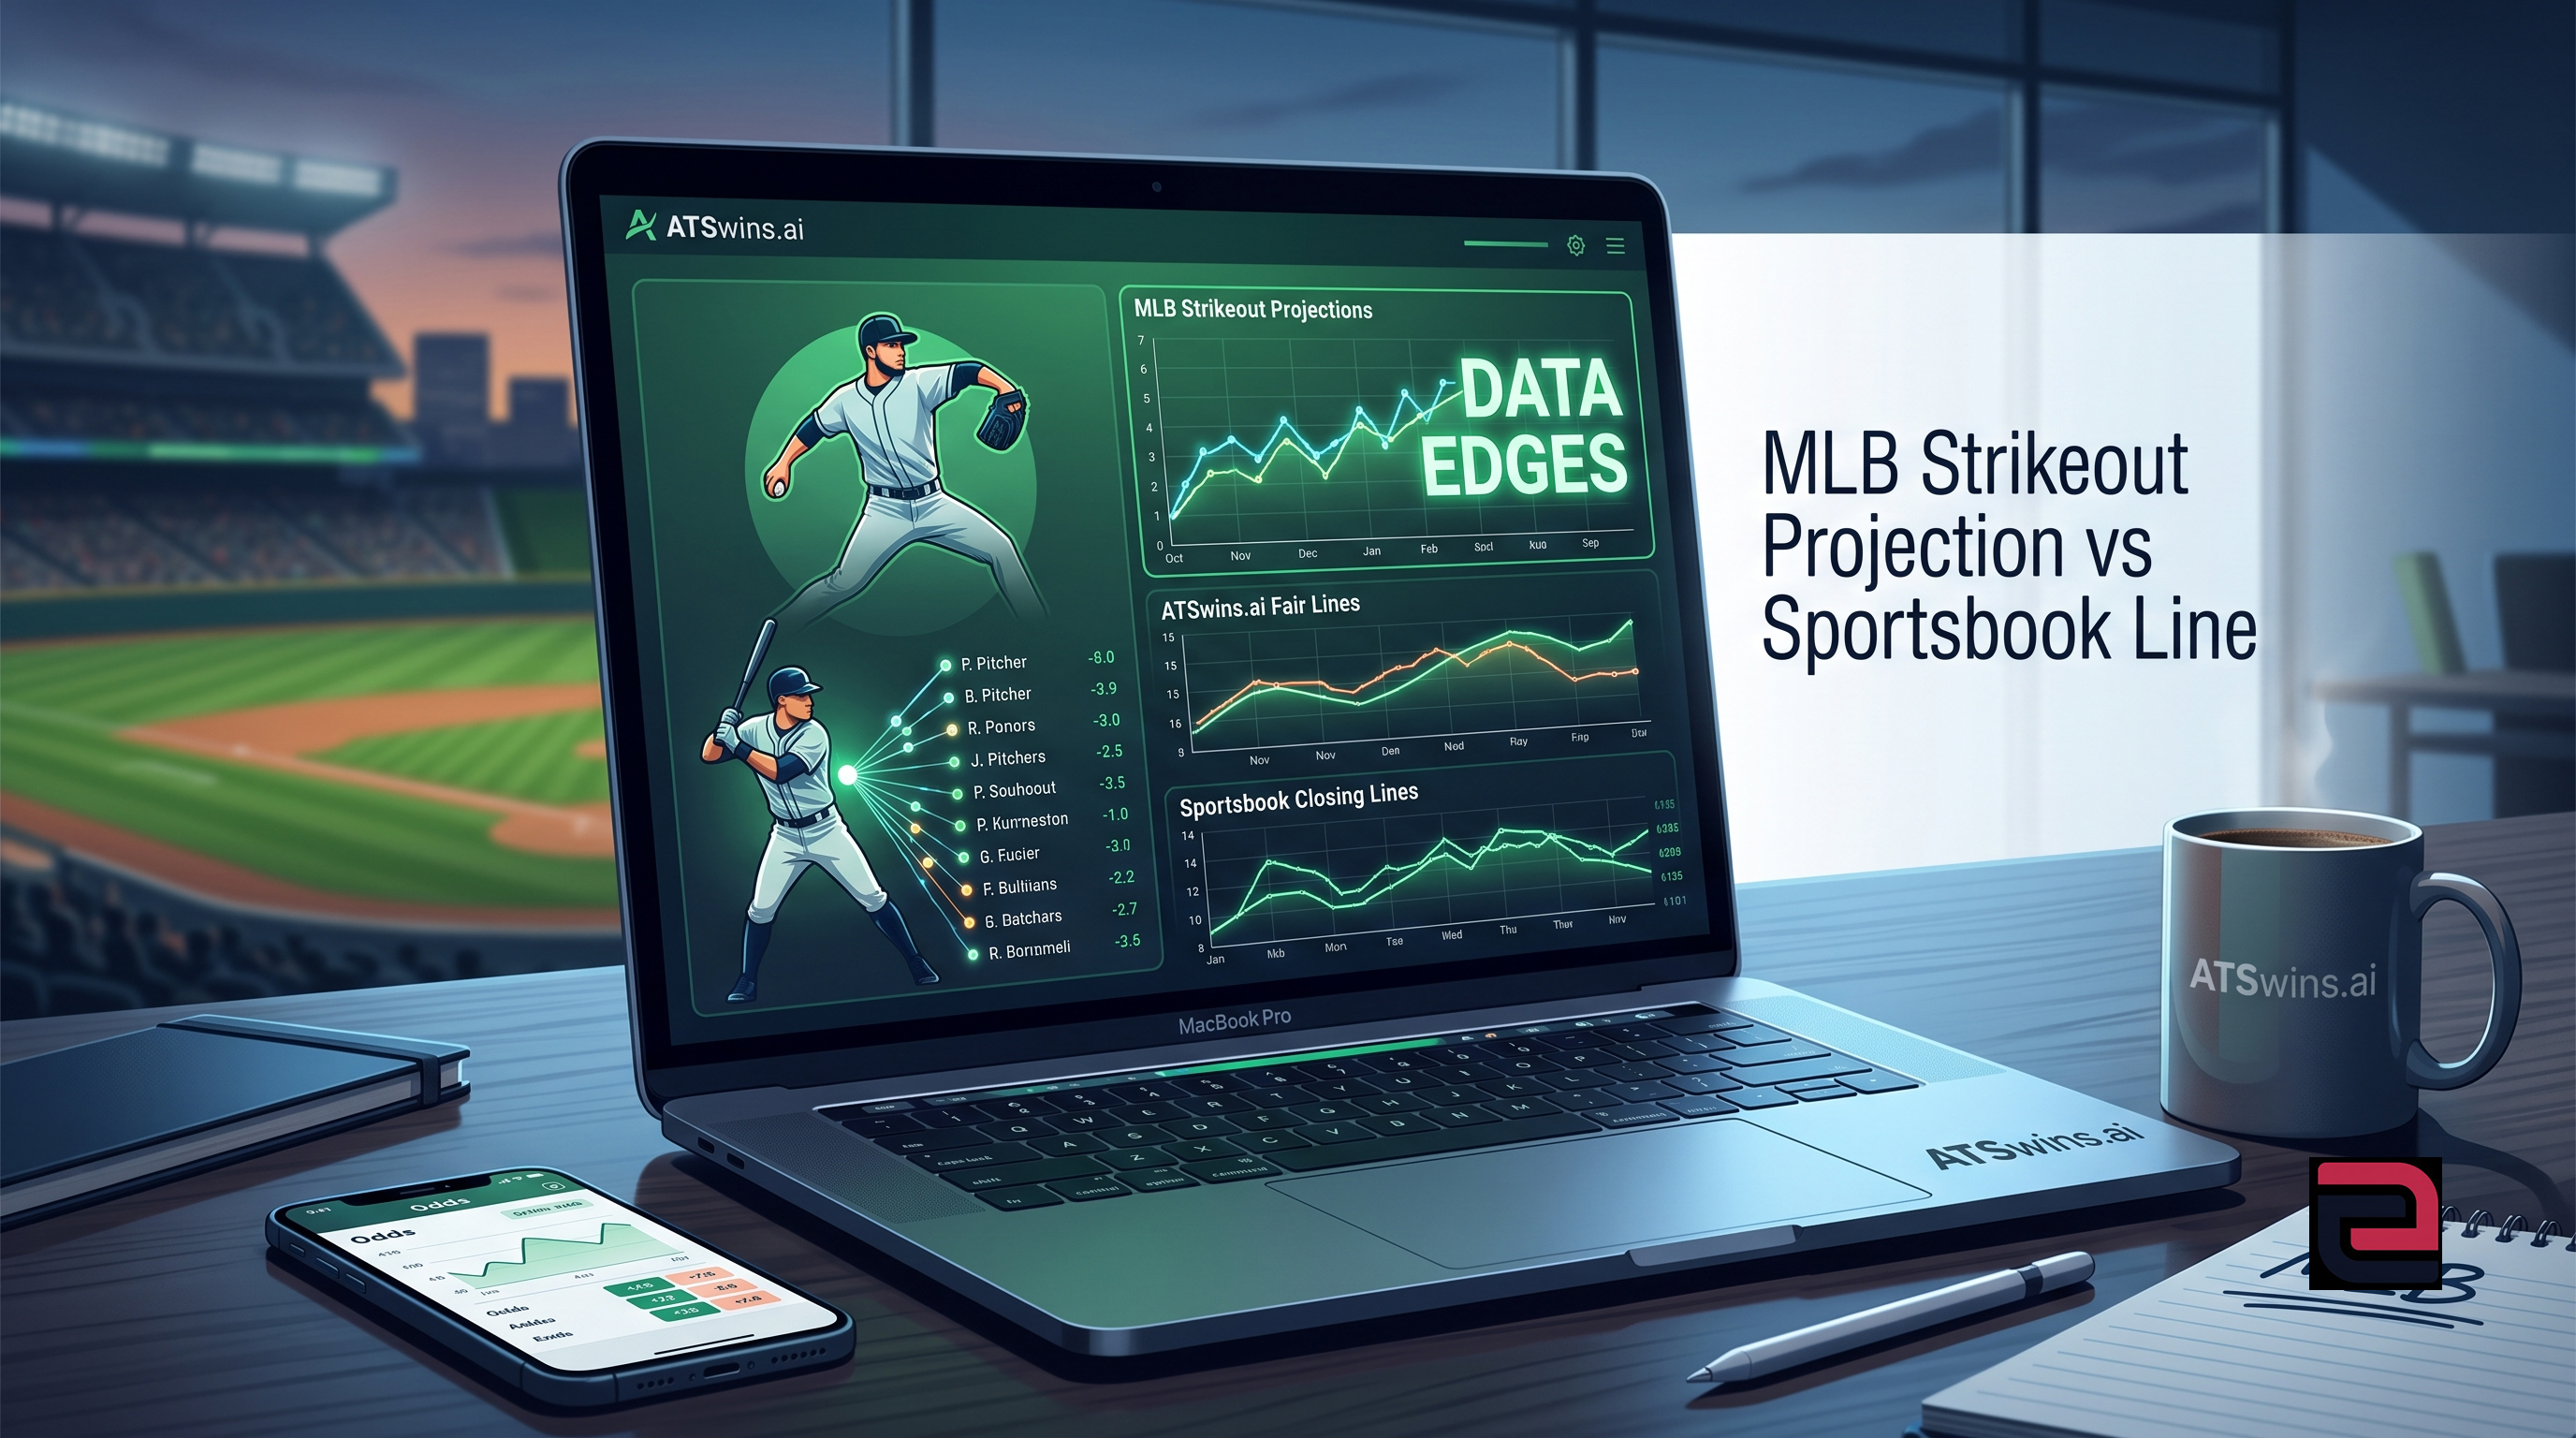
If you have ever spent a summer afternoon looking at starting pitcher props, you know the feeling of staring at a board and wondering why a line feels off. You see a dominant starter posted at 5.5 strikeouts with heavy juice on the over, while your favorite projection model swears he should easily reach seven or eight. That exact gap between an MLB strikeout projection vs sportsbook line is where the entire game of prop betting is played. Understanding why that gap exists, how oddsmakers construct those lines, and whether a projection actually holds real statistical value is what separates a disciplined analyst from someone guessing over their lunch break.
Setting strikeout lines is one of the most intricate challenges oddsmakers face because pitcher strikeout totals are tied to a web of fast-changing variables. Unlike full-game money lines or totals, where team-wide performance can mask individual mistakes, a player prop focuses on one single human being throwing seventy-five to one hundred pitches over two hours. When you compare a raw statistical projection against a posted market number, you are comparing two distinct methodologies. The sportsbook is setting a price designed to balance risk and manage market action, while a pure projection model is attempting to estimate the mean outcome based on historical performance, matchups, and environmental variables.
To turn a strikeout projection into something actionable, you have to break down how both sides reach their conclusions. You need to know which pitch-level metrics actually drive strikeout rates, how opponent lineup structures impact swings and misses, how weather and umpires tilt outcomes, and how to convert a single projected number into an actual probability. Once you master that process, comparing an MLB strikeout projection vs sportsbook line stops being a guessing game and becomes a clear exercise in probabilities and expected value.
At its most fundamental level, an MLB strikeout projection is an algorithmic estimate of how many batters a starting pitcher will strike out in a specific upcoming game. A sportsbook line, by contrast, is a two-way market proposition offered to the public, typically set as a main number such as 5.5 or 6.5 with attached odds on both the over and the under. When you see an entry like over 5.5 at minus 125 and under 5.5 at plus 105, the oddsmaker is stating that the most balanced threshold for action sits right between five and six strikeouts, with a slight market bias toward six or more.
The critical distinction between a statistical projection and a sportsbook line lies in their primary objectives. A data projection is built purely to solve for the mathematical expected value, aiming to predict the average result across thousands of simulated game runs under identical conditions. A sportsbook line is built within a commercial ecosystem where line movement is influenced by public betting habits, liability management, and sharp market signals. Because oddsmakers must account for public perception and risk tolerance across thousands of daily props, market lines can occasionally lag behind sudden shifts in a pitcher's underlying profile.
When you analyze an MLB strikeout projection vs sportsbook line, your goal is not simply to find where a model's raw output differs from the posted total by a full strikeout. A projection of 6.2 strikeouts against a posted line of 5.5 might look like an automatic green light, but without knowing the distribution of outcomes around that median, you cannot evaluate the actual edge. True analytical evaluation requires looking past the surface total and measuring the exact probability of reaching at least six strikeouts given the pitcher's projected volume, workload limits, and matchup characteristics.
Oddsmakers do not generate player props in a vacuum using simple seasonal averages. Modern sportsbooks rely on sophisticated internal quantitative models, baseline market consensus, and historical player databases to establish opening lines. When setting a starting pitcher's strikeout line, oddsmakers begin with a baseline projection anchored in the pitcher's recent strikeout rate per inning, expected workload, and opponent profile. From there, they adjust the number to reflect market expectations and historical betting flows on that specific pitcher.
Public betting patterns play a massive role in where sportsbook lines land and how they move throughout the day. Popular ace pitchers with high national profiles frequently draw heavy public action on over bets, regardless of whether their recent underlying metrics justify the price. To counter this structural bias, sportsbooks often inflate line totals or adjust the juice on popular starters, forcing over bettors to pay a premium. Conversely, lesser-known middle-of-the-rotation starters who quietly possess elite swing-and-miss stuff often open with conservative strikeout lines that understate their true ceiling.
Another factor in sportsbook line construction is risk shading. Oddsmakers know that strikeout props carry significant variance because a single early-inning injury or an unexpected high-pitch inning can destroy an over bet instantly. As a result, books price their lines with built-in vigorish, ensuring that even if public action is split, the house maintains a mathematical advantage. Identifying spots where a sportsbook line has been artificially adjusted for public sentiment rather than objective pitch data is one of the primary ways to discover long-term market value.
To construct a reliable strikeout projection, traditional box-score statistics like earned run average or total seasonal strikeouts are virtually useless. Experienced analysts focus on rate metrics and pitch-level mechanics that isolate a pitcher's ability to generate swings and misses independent of defense or luck. The foundational metric for any serious strikeout evaluation is strikeout rate percentage, which measures the proportion of total batters faced who strike out, rather than strikeouts per nine innings, which can be heavily distorted by high pitch counts and walks.
Swinging strike rate is another indispensable metric when comparing an MLB strikeout projection vs sportsbook line. Swinging strike rate tracks the percentage of total pitches thrown that result in a miss by the batter. A pitcher who maintains a swinging strike rate above twelve percent routinely demonstrates top-tier strikeout capabilities, while a pitcher hovering below eight percent relies heavily on contact and defensive positioning. When a starter's overall strikeout total appears low despite a rising swinging strike rate, it often signals an impending positive regression that sportsbook lines have not yet fully priced in.
Called strikes plus whiffs percentage provides an even broader view of a pitcher's command and pitch efficiency. This metric captures both pitches that deceive batters into taking called strikes and pitches that generate outright misses. Pitchers who consistently achieve a called strikes plus whiffs rate above thirty percent maintain high control over at-bats, allowing them to accumulate strikeouts while keeping their pitch counts manageable enough to remain in the game through six or seven innings. Analyzing these pitch-level metrics gives you a massive advantage over casual observers who rely solely on last week's basic box score.
A pitcher does not generate strikeouts in isolation, every strikeout requires a willing partner at the plate. Evaluating the opposing lineup's plate discipline profile is just as critical as assessing the starting pitcher. Team-level strikeout rates against right-handed or left-handed pitching offer a solid starting point, but deep analysis requires breaking down the expected nine-man starting order individually. Lineups filled with high-chase, high-whiff hitters present vastly different target environments than disciplined lineups that choke up with two strikes and force high pitch counts.
Plate discipline metrics such as chase rate, which tracks how often hitters swing at pitches outside the strike zone, and contact rate inside the strike zone tell you exactly how a lineup will approach a given pitcher. Facing an opposing lineup with an overall chase rate exceeding thirty-two percent allows a high-spin breaking ball pitcher to expand the strike zone freely when ahead in the count. If that same pitcher faces a disciplined lineup that lays off borderline pitches, his pitch count will inflate quickly, leading to fewer total innings pitched and fewer overall strikeout opportunities.
Batter splits against specific pitch types also reveal crucial matchup edges that sportsbook lines regularly overlook. If a starting pitcher relies heavily on a high-velocity four-seam fastball and a sweeping slider, examining how the opposing lineup performs against those specific pitch shapes provides unmatched clarity. When six or seven hitters in an opposing batting order demonstrate high whiff rates against right-handed sliders, the pitcher's projected strikeout floor rises significantly, creating a compelling reason to evaluate the over side of the prop line.
External factors can alter a pitcher's strikeout output just as dramatically as the opposing lineup's skill set. Ballpark dimensions, visual backdrops, ambient temperature, humidity, and atmospheric pressure all influence pitch movement and batter perception. High-altitude venues or hot, dry weather conditions reduce air resistance, causing pitches to break slightly less, which can lead to higher contact rates. Conversely, cooler evening games in marine environments create denser air, allowing pitchers to generate sharper break on secondary pitches and increasing overall swing-and-miss rates.
The home plate umpire assigned to a game represents another variable that directly impacts strikeout totals. Umpire strike zones vary measurably across Major League Baseball, with certain umpires calling wide lateral zones that reward edge-pitchers and others enforcing tight vertical zones that force pitchers back over the middle of the plate. An expansive strike zone adds called strikes on pitch counts that would otherwise turn into walks, directly extending a pitcher's outing and accelerating his strikeout accumulation. Incorporating home plate umpire tendencies into your evaluation process helps refine raw projections before comparing them to market lines.
Ballpark visibility and batter's eye configurations also play a quiet but significant role in strikeout rates. Certain stadiums feature challenging lighting shifts during early evening games or visual backdrops that make picking up pitch spin exceptionally difficult for hitters during specific innings. When a high-velocity pitcher with an elite pitch mix starts in a venue known for suppressing offensive contact under twilight conditions, the statistical environment heavily favors an elevated strikeout ceiling.
No matter how dominant a pitcher's pitch-level metrics might be, he cannot strike out batters from the dugout. Pitch volume is the absolute prerequisite for strikeout accumulation, making workload management and managerial habits essential components of any projection model. A starter who averages six strikeouts over eighty-five pitches has a completely different projection profile than a workhorse who is routinely allowed to throw one hundred and five pitches across seven innings.
Managerial tendencies regarding pitch count caps and lineup rotations directly shape a pitcher's ceiling. Modern analytics departments frequently pull starting pitchers before they face an opposing batting order for the third time in a game, known industry-wide as the third-time-through-the-order penalty. If a manager strictly limits his starting pitcher to two passes through the lineup or imposes a hard cap around eighty-five pitches, that pitcher's realistic ceiling is hard-capped regardless of how well he is pitching on a given night.
When assessing an MLB strikeout projection vs sportsbook line, always verify whether recent workload restrictions are factored into the model. Pitchers coming off injury IL stints, young prospects on strict seasonal inning limits, or starters pitching on short rest present elevated under risk because their volume is artificially curtailed. Conversely, veteran starters pitching for teams with overtaxed bullpens are often given longer leashes to complete six or seven full innings, providing the necessary pitch volume required to hit higher strikeout totals.
Comparing a projected raw strikeout total directly against a sportsbook line without converting it into a probability is the most common mistake made by recreational analysts. If a model projects a pitcher for 5.8 strikeouts and the sportsbook sets the line at 5.5, it is tempting to assume that the over is an automatic play. However, because strikeout events occur in discrete whole integers, a mean projection of 5.8 simply represents the average outcome across a distribution curve. To establish whether true value exists, you must calculate the exact fair probability of the pitcher recording six or more strikeouts.
Because strikeout totals in a single game represent count data over a fixed number of opportunities, statistical models commonly employ Poisson or binomial distribution functions to calculate outcome probabilities. By taking a pitcher's expected batters faced and multiplying by his projected strikeout rate per batter, a model generates the expected value lambda. Feeding that value into a distribution function yields the precise likelihood of every possible strikeout total, from zero all the way up to fifteen or more.
Once you have the probability of the pitcher reaching at least six strikeouts, you convert that percentage into fair American odds. For example, if your probability calculation shows a sixty percent chance of the pitcher recording over 5.5 strikeouts, the fair line without vigorish is minus 150. If the sportsbook offers the over 5.5 at minus 120, which carries an implied probability of fifty-four point five percent, you have identified a clear mathematical edge where the true probability exceeds the market price. This mathematical conversion process forms the core foundation of quantitative sports forecasting on ATSwins.
In the world of quantitative sports modeling, short-term outcomes are heavily influenced by random variance. A perfectly modeled pitcher prop can lose because of an early rain delay, a sudden groin strain, or an unexpected blown call by an umpire. Because individual outcomes are noisy, serious sports analysts measure their long-term performance through closing line value, which compares the price you locked in against the final price established by the market right before the first pitch.
Consistently securing better odds than the closing market line is the clearest indicator of a successful analytical methodology. When your projections identify an underpriced strikeout total early in the day and the market subsequently moves toward your position, you have captured positive closing line value. Over hundreds of games across an AI MLB run projection model season, consistently beating the closing market line correlates directly with long-term analytical success because it proves that your model is detecting real structural edges before the broader market adjusts.
At ATSwins, our statistical modeling framework and prediction engines are designed specifically to evaluate fair lines and isolate mispriced prop markets. By combining advanced pitch-level metrics, real-time lineup updates, park conditions, and probability distributions, ATSwins empowers users to approach pitcher props with the same analytical discipline used by professional quantitative trading teams. Rather than chasing short-term trends or emotional gut feelings, utilizing structured data projections allows you to navigate daily MLB slates with clarity and precision.
What is the difference between a strikeout projection and a sportsbook line?
A strikeout projection is an algorithmic calculation of a pitcher's expected mean strikeout total based purely on statistics, matchups, pitch metrics, and projected volume. A sportsbook line is a commercial proposition set by oddsmakers with attached odds, designed to balance market betting action and manage risk while incorporating vigorish.
Why does a pitcher with a high projection sometimes have a low sportsbook line?
Sportsbooks adjust lines based on expected betting flows, recent workload limitations, subtle bullpen usage patterns, or public perception. If a pitcher is on a strict pitch count cap coming off an injury, oddsmakers will suppress the line even if his rate stats are elite.
Which statistical metric is best for evaluating pitcher strikeout props?
Strikeout rate percentage per batter faced, swinging strike rate, and called strikes plus whiffs percentage are far superior to standard strikeout totals or strikeouts per nine innings. These metrics isolate true swing-and-miss ability from pitch count variance and defensive luck.
How do you calculate fair odds for a strikeout prop over or under?
You take the pitcher's projected strikeout rate and expected batters faced to determine the mean expectation, then run those parameters through a discrete probability distribution such as a Poisson model. The resulting probability is then mathematically converted into fair American odds to compare against the sportsbook price.
How do weather and umpires affect MLB strikeout totals?
Cooler temperatures and dense air increase pitch movement, leading to higher whiff rates. Similarly, home plate umpires with wide strike zones expand pitch counts in favor of pitchers, reducing walks and allowing starters to stay deeper in games to record more strikeouts.
Navigating the daily MLB slate requires respecting both the complexity of baseball data and the efficiency of modern sports markets. Comparing an MLB strikeout projection vs sportsbook line is never as simple as blind picking every over that looks a fraction of a strikeout too low. It demands a systematic workflow that accounts for pitch-level swing-and-miss mechanics, individual lineup discipline, pitch count caps, atmospheric factors, and probability distribution modeling.
By anchoring your daily routine in objective quantitative principles and measuring your success through closing line value rather than raw single-game variance, you remove emotion and guesswork from your analysis. Whether you are breaking down morning starter announcements or refining your personal probability models, relying on structured analytics provides a grounded, sustainable path forward. Explore the player projections, predictive models, and fair-line analytics available on ATSwins to bring real mathematical discipline to your sports forecasting workflow today.