

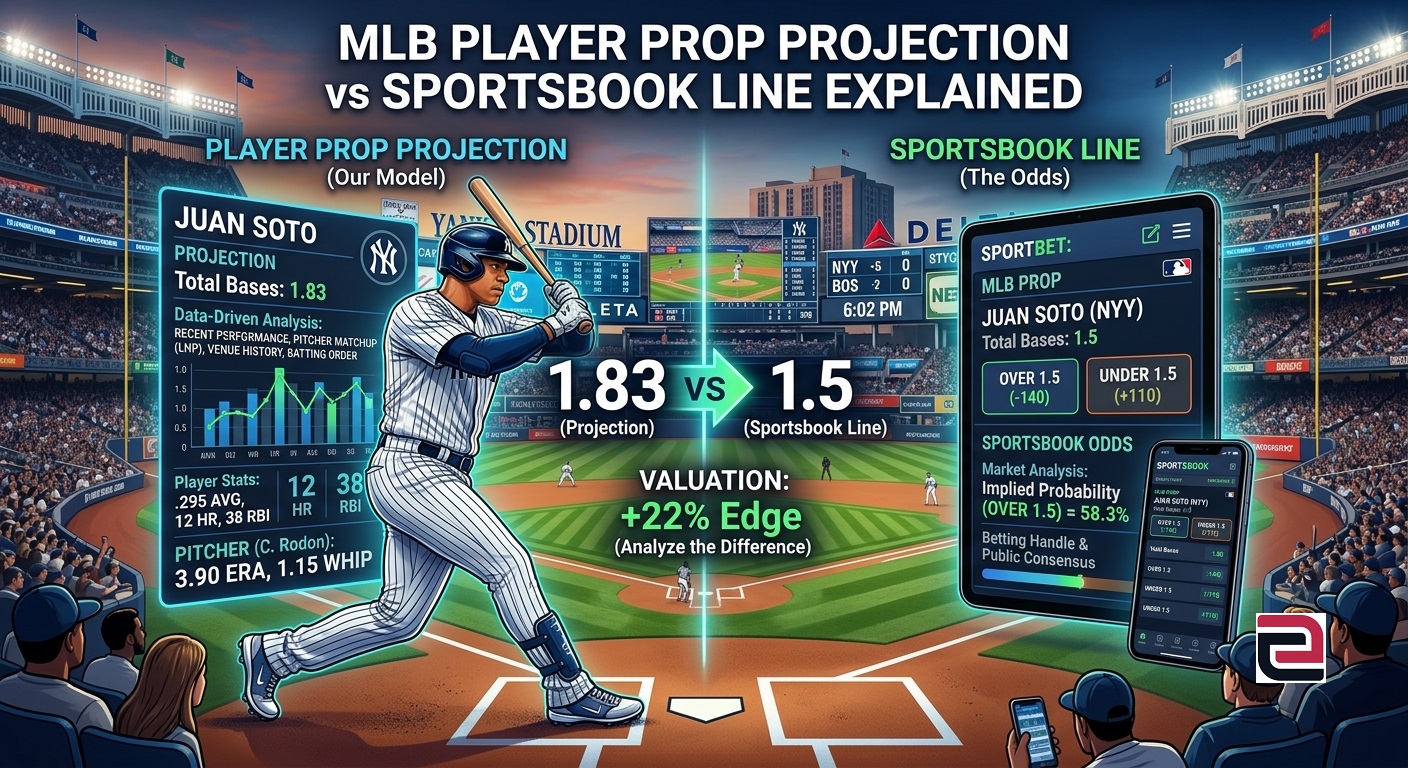
MLB Player Prop Projection vs Sportsbook Line: What the Difference Really Means
If you’ve ever compared an MLB player prop projection to a sportsbook line, you’ve probably noticed they rarely match exactly. That difference isn’t an error—it’s where the most meaningful analysis begins. A projection estimates expected performance based on data and modeling, while a sportsbook line reflects a market price shaped by probabilities, risk management, and betting behavior.
Understanding how and why these numbers differ is essential if you want to interpret player props through an analytical lens rather than treating them as guesses or opinions. This article breaks down how projections are built, how sportsbooks set lines, and what it means when the two don’t align.
- What Is an MLB Player Prop Projection?
- How Sportsbooks Set Player Prop Lines
- Projection vs Sportsbook Line: Key Differences
- Strikeout Prop Example with Probability
- Why Projections and Lines Diverge
- How to Evaluate Projection vs Line Gaps
- Where Models and Markets Both Fall Short
What Is an MLB Player Prop Projection?
An MLB player prop projection is a statistical estimate of how a player is expected to perform in a specific category—such as strikeouts, hits, or total bases—in a given game.
These projections are typically generated using models that incorporate:
- Historical performance data
- Opponent strength
- Pitcher vs batter matchups
- Ballpark effects
- Recent form and usage patterns
For example, a projection might estimate that a starting pitcher will record 6.4 strikeouts in a game. That number is not a prediction that the pitcher will get exactly six or seven strikeouts—it represents the center of a probability distribution.
Modern forecasting tools, including simulation-based systems like those used on ATSwins.ai, often go further by modeling the full range of outcomes. Instead of only producing a single number, they estimate probabilities for outcomes like:
- Over 5.5 strikeouts
- Under 5.5 strikeouts
- Exactly 6 strikeouts
This distinction matters because decisions are made on probabilities, not averages.
How Sportsbooks Set Player Prop Lines
A sportsbook line is not simply a reflection of expected performance. It’s a price designed to balance action and manage risk.
When sportsbooks post a player prop—say, 5.5 strikeouts with -110 odds on both sides—they are implicitly stating a probability. After accounting for margin (vig), each side may represent something close to a 50% outcome in the market’s eyes.
However, sportsbooks consider more than raw projections:
- Betting demand and public perception
- Market movement across other books
- Injury news and lineup changes
- Risk exposure across multiple wagers
Lines are often adjusted after release as money enters the market. A projection might stay constant, while the sportsbook line moves from 5.5 to 6.5 due to betting pressure.
This is why sportsbook lines are better understood as market prices, not pure forecasts.
Projection vs Sportsbook Line: Key Differences
At a glance, a projection and a sportsbook line might look similar, but they serve different purposes:
| Element | Projection | Sportsbook Line |
|---|---|---|
| Purpose | Estimate expected performance | Set a betting market price |
| Output Type | Mean or distribution | Threshold with odds |
| Influenced By | Data and modeling assumptions | Market behavior and risk |
| Adjustments | Changes with new data | Moves with betting action |
| Interpretation | Expected outcome | Implied probability |
Strikeout Prop Example with Probability
Consider a pitcher with a projection of 6.4 strikeouts.
A sportsbook sets the line at 5.5 strikeouts (-115 over / -105 under).
At first glance, it may seem obvious that the “over” is favorable. But the projection alone doesn’t tell the full story.
A simulation-based model might estimate:
- Probability of 6+ strikeouts: 58%
- Probability of 5 or fewer: 42%
Now compare that to the implied probability of the odds:
- Over (-115) ≈ 53.5%
- Under (-105) ≈ 51.2%
This is where the concept of a fair line comes in. If the model estimates the true probability of the over at 58%, but the market prices it around 53–54%, there is a gap between projection and price.
That gap does not guarantee a correct outcome in a single game. It simply indicates a difference between model expectation and market pricing.
Why Projections and Lines Diverge
Differences between projections and sportsbook lines are normal and expected. Several factors contribute to these gaps.
Market Behavior
Sportsbooks react to betting patterns. If a popular pitcher attracts heavy “over” action, the line may move upward even if underlying projections haven’t changed.
Model Assumptions
Different models weigh inputs differently. One system might emphasize recent performance, while another leans more heavily on long-term averages.
Data Limitations
No model captures everything. Defensive alignment shifts, catcher framing, or subtle mechanical changes may not be fully reflected in projections.
Timing Differences
Projections may update at fixed intervals, while sportsbooks adjust continuously throughout the day.
Risk Management
Sportsbooks are not trying to predict outcomes perfectly. They are trying to manage exposure across a wide set of markets.
How to Evaluate Projection vs Line Gaps
Not every difference between a projection and a sportsbook line is meaningful. The challenge is determining which gaps matter.
A disciplined approach focuses on probability rather than raw numbers.
Look Beyond the Mean
A projection of 6.4 strikeouts does not automatically justify betting over 5.5. What matters is the probability of exceeding that threshold.
Convert Odds to Implied Probability
Understanding the implied probability of a line allows for direct comparison with model output. This is essential when evaluating whether a discrepancy is significant.
Consider Market Movement
If a line has already moved from 5.5 to 6.5, the initial edge implied by the projection may no longer exist.
Account for Context
Weather, lineup changes, and pitch count expectations can all shift the distribution of outcomes.
Focus on Repeatability
Short-term results are noisy. What matters is whether a process consistently identifies situations where model probabilities differ from market pricing.
Tools such as MLB player projections and simulation outputs can help quantify these probabilities rather than relying on surface-level comparisons. For a related look at the next step in the process, read How to Find Mispriced MLB Player Props Using Data, which explains how data-driven analysis can be used to identify potential differences between estimated probabilities and market prices.
Where Models and Markets Both Fall Short
Neither projections nor sportsbook lines are perfect representations of reality.
Model Limitations
- Small sample sizes can distort recent trends
- Role changes may not be captured immediately
- Injury effects are difficult to quantify precisely
Market Limitations
- Public bias can influence lines
- Early lines may be less efficient
- Lower-volume props may receive less attention from bookmakers
Even sophisticated models cannot eliminate variance. A pitcher projected for six strikeouts can finish with two or ten due to randomness in game events.
Recognizing this uncertainty is central to interpreting both projections and lines correctly.
Putting It All Together in Practice
The comparison between an MLB player prop projection and a sportsbook line is not about finding certainty—it’s about identifying differences in probability.
A projection provides a data-driven expectation. A sportsbook line reflects how that expectation is priced in a market environment.
The most useful approach is to:
- Translate projections into probabilities
- Compare those probabilities to implied odds
- Evaluate whether the gap is meaningful
- Understand the context behind both numbers
Platforms that combine projections with simulation outputs can help clarify this relationship by showing how often different outcomes occur under varying conditions.
FAQ
How do MLB player prop projections differ from sportsbook odds?
Projections estimate expected performance using statistical models, while sportsbook odds represent market prices influenced by both probability and betting activity. A projection might suggest an average outcome, but odds reflect how that outcome is priced for wagering.
Does a higher projection always mean the over is correct?
No. A higher projection does not automatically imply value on the over. The key factor is the probability of exceeding the line compared to the implied probability of the odds. The distribution of outcomes matters more than the average.
What is a fair line in player props?
A fair line represents the odds that would exist without sportsbook margin. It is derived from the true probability of an outcome. Comparing a fair line to a sportsbook line helps identify differences between model estimates and market pricing.
Why do sportsbook lines move after being posted?
Lines move due to betting activity, new information, and market alignment across sportsbooks. These adjustments help manage risk and balance exposure rather than purely reflecting updated projections.
Can projections consistently outperform sportsbook lines?
Projections can highlight differences in expected outcomes, but they do not guarantee results. Success depends on model quality, disciplined interpretation, and long-term evaluation rather than individual outcomes.
A Data-Driven Perspective on Player Props
Understanding the gap between MLB player prop projections and sportsbook lines shifts the focus from guessing outcomes to evaluating probabilities. Projections estimate what is likely, while lines reflect how that likelihood is priced in a dynamic market.
The most effective approach is not to treat either number as definitive. Instead, use projections to understand expected performance, convert sportsbook odds into probabilities, and assess where meaningful differences exist.
For readers interested in exploring this process further, tools that combine projections with simulation-based probability distributions—such as those available through ATSwins.ai—offer a clearer view of how individual outcomes translate into long-term expectations.