

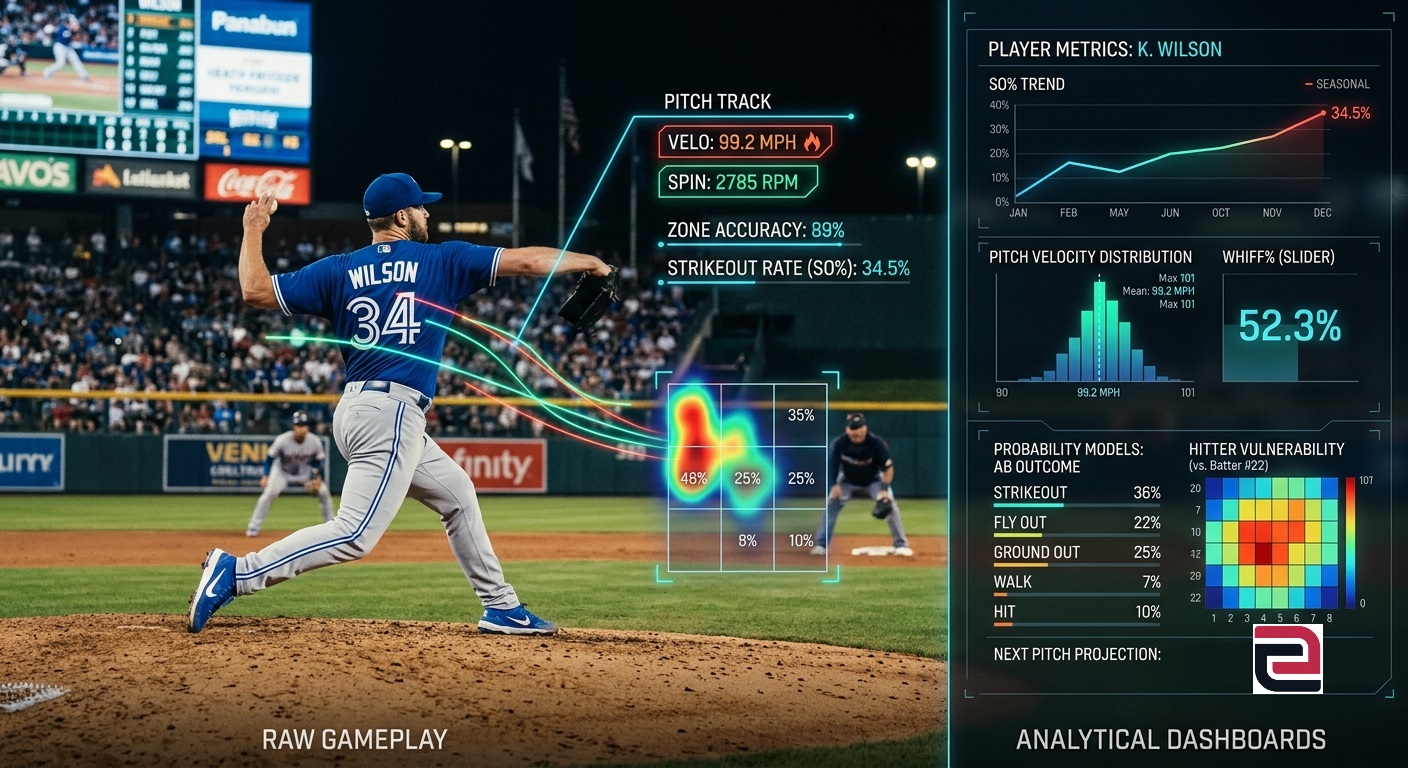
MLB pitcher strikeout prop projections estimate how many batters a pitcher is likely to strike out in a given game. These projections are not guesses, they are derived from statistical models that combine pitcher skill, opponent tendencies, expected workload, and game context. Understanding how these projections are built helps you evaluate whether a posted strikeout line reflects realistic expectations or simply market sentiment.
This article breaks down how strikeout projections are created, how they translate into probabilities, and where differences between model outputs and betting lines can emerge.
Table of Contents
What Are Strikeout Prop Projections?
A strikeout prop projection is a model-based estimate of how many strikeouts a pitcher will record in a specific game. Rather than predicting a single outcome with certainty, projections typically produce an expected value, such as 6.4 strikeouts, along with a probability distribution around that number.
Sportsbooks usually post strikeout props as half-integer lines (for example, 5.5 or 6.5). The projection itself is only part of the analysis. What matters is how often a pitcher is expected to go over or under that line.
For example:
- Projection: 6.4 strikeouts
- Market line: 5.5 strikeouts
The key question becomes: how often does the pitcher reach 6 or more strikeouts?
That probability, not the raw projection, is what drives decision-making.
Core Inputs Behind Strikeout Models
Strikeout projections rely on several layers of data. No single metric determines the outcome. Instead, models combine multiple inputs to capture both skill and context.
Pitcher Strikeout Ability
- Swinging-strike rate
- Called strike percentage
- Pitch mix and velocity
- Historical performance against similar lineups
Strikeout rate is more stable than many other pitching stats, but it still varies based on role and health.
Opponent Strikeout Tendencies
Not all lineups are equal. Some teams strike out far more often than others. Models typically adjust projections based on:
- Team strikeout rate vs. handedness
- Individual batter tendencies
- Projected lineup composition
A pitcher facing a high-strikeout lineup may see a meaningful boost in projection compared to facing a contact-heavy team.
Expected Innings and Pitch Count
Strikeouts depend heavily on opportunity. A pitcher projected for 7 innings has far more chances than one expected to throw 5.
Key factors include:
- Recent pitch counts
- Manager tendencies
- Bullpen usage
- Game importance
Even strong strikeout pitchers can fall short if their workload is limited.
Game Context
External factors also influence strikeout projections:
- Ballpark effects
- Weather conditions (especially wind and humidity)
- Umpire tendencies
- Opponent offensive strength
While these factors are smaller than core skill metrics, they still shift probabilities at the margins.
How a Strikeout Projection Is Calculated
At a high level, strikeout projections combine expected batters faced with strikeout probability per batter.
A simplified version looks like this:
- Estimate innings pitched (e.g., 6.2 innings)
- Convert innings to batters faced (typically 4.2–4.4 per inning)
- Apply strikeout rate adjusted for opponent
Example Projection
- Expected innings: 6.0
- Batters faced: 25
- Adjusted strikeout rate: 26%
Projected strikeouts:
25 × 0.26 = 6.5 strikeouts
This produces the baseline projection. From there, models simulate variation around that number to estimate probabilities.
Simulation Layer
Rather than relying on a single calculation, many models simulate thousands of possible game outcomes. Each simulation varies:
- Pitcher performance
- Opponent results
- Game flow
The result is a distribution of outcomes, such as:
| Strikeouts | Probability |
|---|---|
| 4 or fewer | 18% |
| 5 | 20% |
| 6 | 22% |
| 7 | 18% |
| 8+ | 22% |
This distribution is what allows analysts to evaluate prop lines.
From Projection to Betting Line
A projection becomes actionable only when compared to a market line.
Example
- Projection: 6.5 strikeouts
- Line: 5.5 strikeouts
From the simulated distribution:
- Probability of 6+ strikeouts: 62%
This implies a fair price for the over.
Fair Probability vs. Market Odds
If the probability of going over is 62%, the implied fair odds would be roughly:
- Over 5.5: -163
- Under 5.5: +163
If the market is offering a different price, that difference reflects disagreement between model and market.
Why the Market May Differ
Sportsbooks incorporate additional factors:
- Public betting patterns
- Injury uncertainty
- Late lineup changes
- Risk management
As a result, the posted line is not always identical to a purely statistical projection.
Where Strikeout Models Can Miss
Even well-built models have limitations. Strikeout projections are sensitive to several unpredictable elements.
Pitch Count Volatility
A pitcher may exit early due to:
- Inefficiency
- Injury
- Manager decisions
A small change in workload can significantly impact strikeout totals.
Lineup Changes
Late scratches or rest days can alter opponent strikeout tendencies. A lineup missing high-strikeout hitters reduces upside for the pitcher.
Game Flow
Pitchers facing early trouble may leave before reaching their expected innings. Conversely, efficient outings can extend workloads.
Small Sample Noise
Short-term trends, such as a pitcher’s last two starts, can be misleading. Models attempt to balance recent performance with long-term data, but variance remains.
Environmental Factors
Weather shifts, especially wind direction, can subtly influence how aggressively hitters approach at-bats, which in turn affects strikeout rates.
How ATSwins Approaches Pitcher Projections
ATSwins applies a modeling framework that integrates multiple data layers rather than relying on a single statistic. Strikeout projections are built through:
- Historical pitcher performance adjusted for context
- Opponent-specific strikeout tendencies
- Expected workload modeling
- Simulation-based outcome distributions
The key output is not just a projection number, but a probability range. This distinction matters because two pitchers with the same projected strikeouts can have very different distributions of outcomes.
For example:
- Pitcher A: Consistent, narrow distribution
- Pitcher B: Volatile, wide distribution
Even if both project for 6.5 strikeouts, their probabilities of clearing 5.5 may differ.
This probabilistic approach aligns with how markets operate, focusing on likelihood rather than certainty.
How to Evaluate a Strikeout Prop
Evaluating a strikeout prop involves comparing your projection to the market and understanding the sources of disagreement.
Key Questions to Ask
- Is the pitcher’s expected workload realistic?
- Does the opponent lineup increase or decrease strikeout potential?
- Has the line moved due to new information?
- Does the projection align with long-term performance metrics?
Practical Example
If a pitcher projects for 5.8 strikeouts and the line is 6.5, the raw projection suggests the under may be more likely. But that alone is not enough.
You still need to consider:
- Distribution shape
- Probability of reaching 7+ strikeouts
- Contextual risks
This is why probability estimates are more useful than single-number projections.
Interpreting Projection Differences
Disagreements between projections and market lines are common. They often stem from:
- Different assumptions about innings pitched
- Varying opponent adjustments
- Timing of information (lineups, injuries)
- Market behavior
Not every difference represents a meaningful edge. Some are simply within the expected range of model variation.
A disciplined approach focuses on consistent evaluation rather than isolated outcomes.
When evaluating projection gaps, it’s important to remember that no single model captures the full picture; each system weighs variables like pitch mix, opponent tendencies, and recent performance differently. This is why identifying discrepancies between projections can reveal potential edges rather than confusion. If you want a deeper breakdown of how these edges translate into actionable bets, check out our related guide, Positive EV MLB Player Props: How Analytics Finds Value, where we explain how projection differences directly tie into long-term profitability in player prop betting.
Practical Takeaways for Strikeout Analysis
Strikeout prop projections are most useful when treated as part of a structured process:
- Use projections to estimate probabilities, not outcomes
- Compare projections to market lines carefully
- Account for uncertainty in workload and context
- Avoid overreacting to small sample trends
Over time, consistent application of these principles leads to better interpretation of both projections and market behavior.
Applying Data-Driven Projections in MLB Props
Strikeout props are one of the more model-friendly MLB markets because they rely on measurable pitcher and hitter tendencies. Still, outcomes vary from game to game, and even strong projections will not be correct every time.
The value of projections lies in their ability to provide a structured expectation. When paired with probability analysis, they offer a clearer picture of how likely different outcomes are, not a guarantee of what will happen.
For readers interested in exploring projection-based analysis in more depth, ATSwins provides tools that model player outcomes and simulate game scenarios using data-driven inputs. These tools are designed to support disciplined evaluation rather than shortcut decision-making.
FAQ
How accurate are MLB strikeout projections?
Strikeout projections are generally more stable than many other baseball metrics because strikeout rates are relatively consistent over time. However, accuracy still depends on workload assumptions and opponent context. Even strong models produce a range of outcomes rather than a single correct prediction.
Why do projections and sportsbook lines differ?
Sportsbook lines reflect both statistical expectations and market behavior. They may adjust for betting volume, uncertainty, or late information. Projections focus on expected outcomes based on data, which can lead to differences between model estimates and posted lines.
Do weather and ballpark affect strikeout props?
Yes, but usually to a smaller degree than pitcher skill or opponent tendencies. Extreme weather conditions or specific ballpark characteristics can slightly shift strikeout expectations, especially when they influence hitter behavior.
What matters more: projection or probability?
Probability is more important. A projection gives a central estimate, but the probability distribution shows how often different outcomes occur. Betting decisions depend on how likely a pitcher is to go over or under a specific line.