

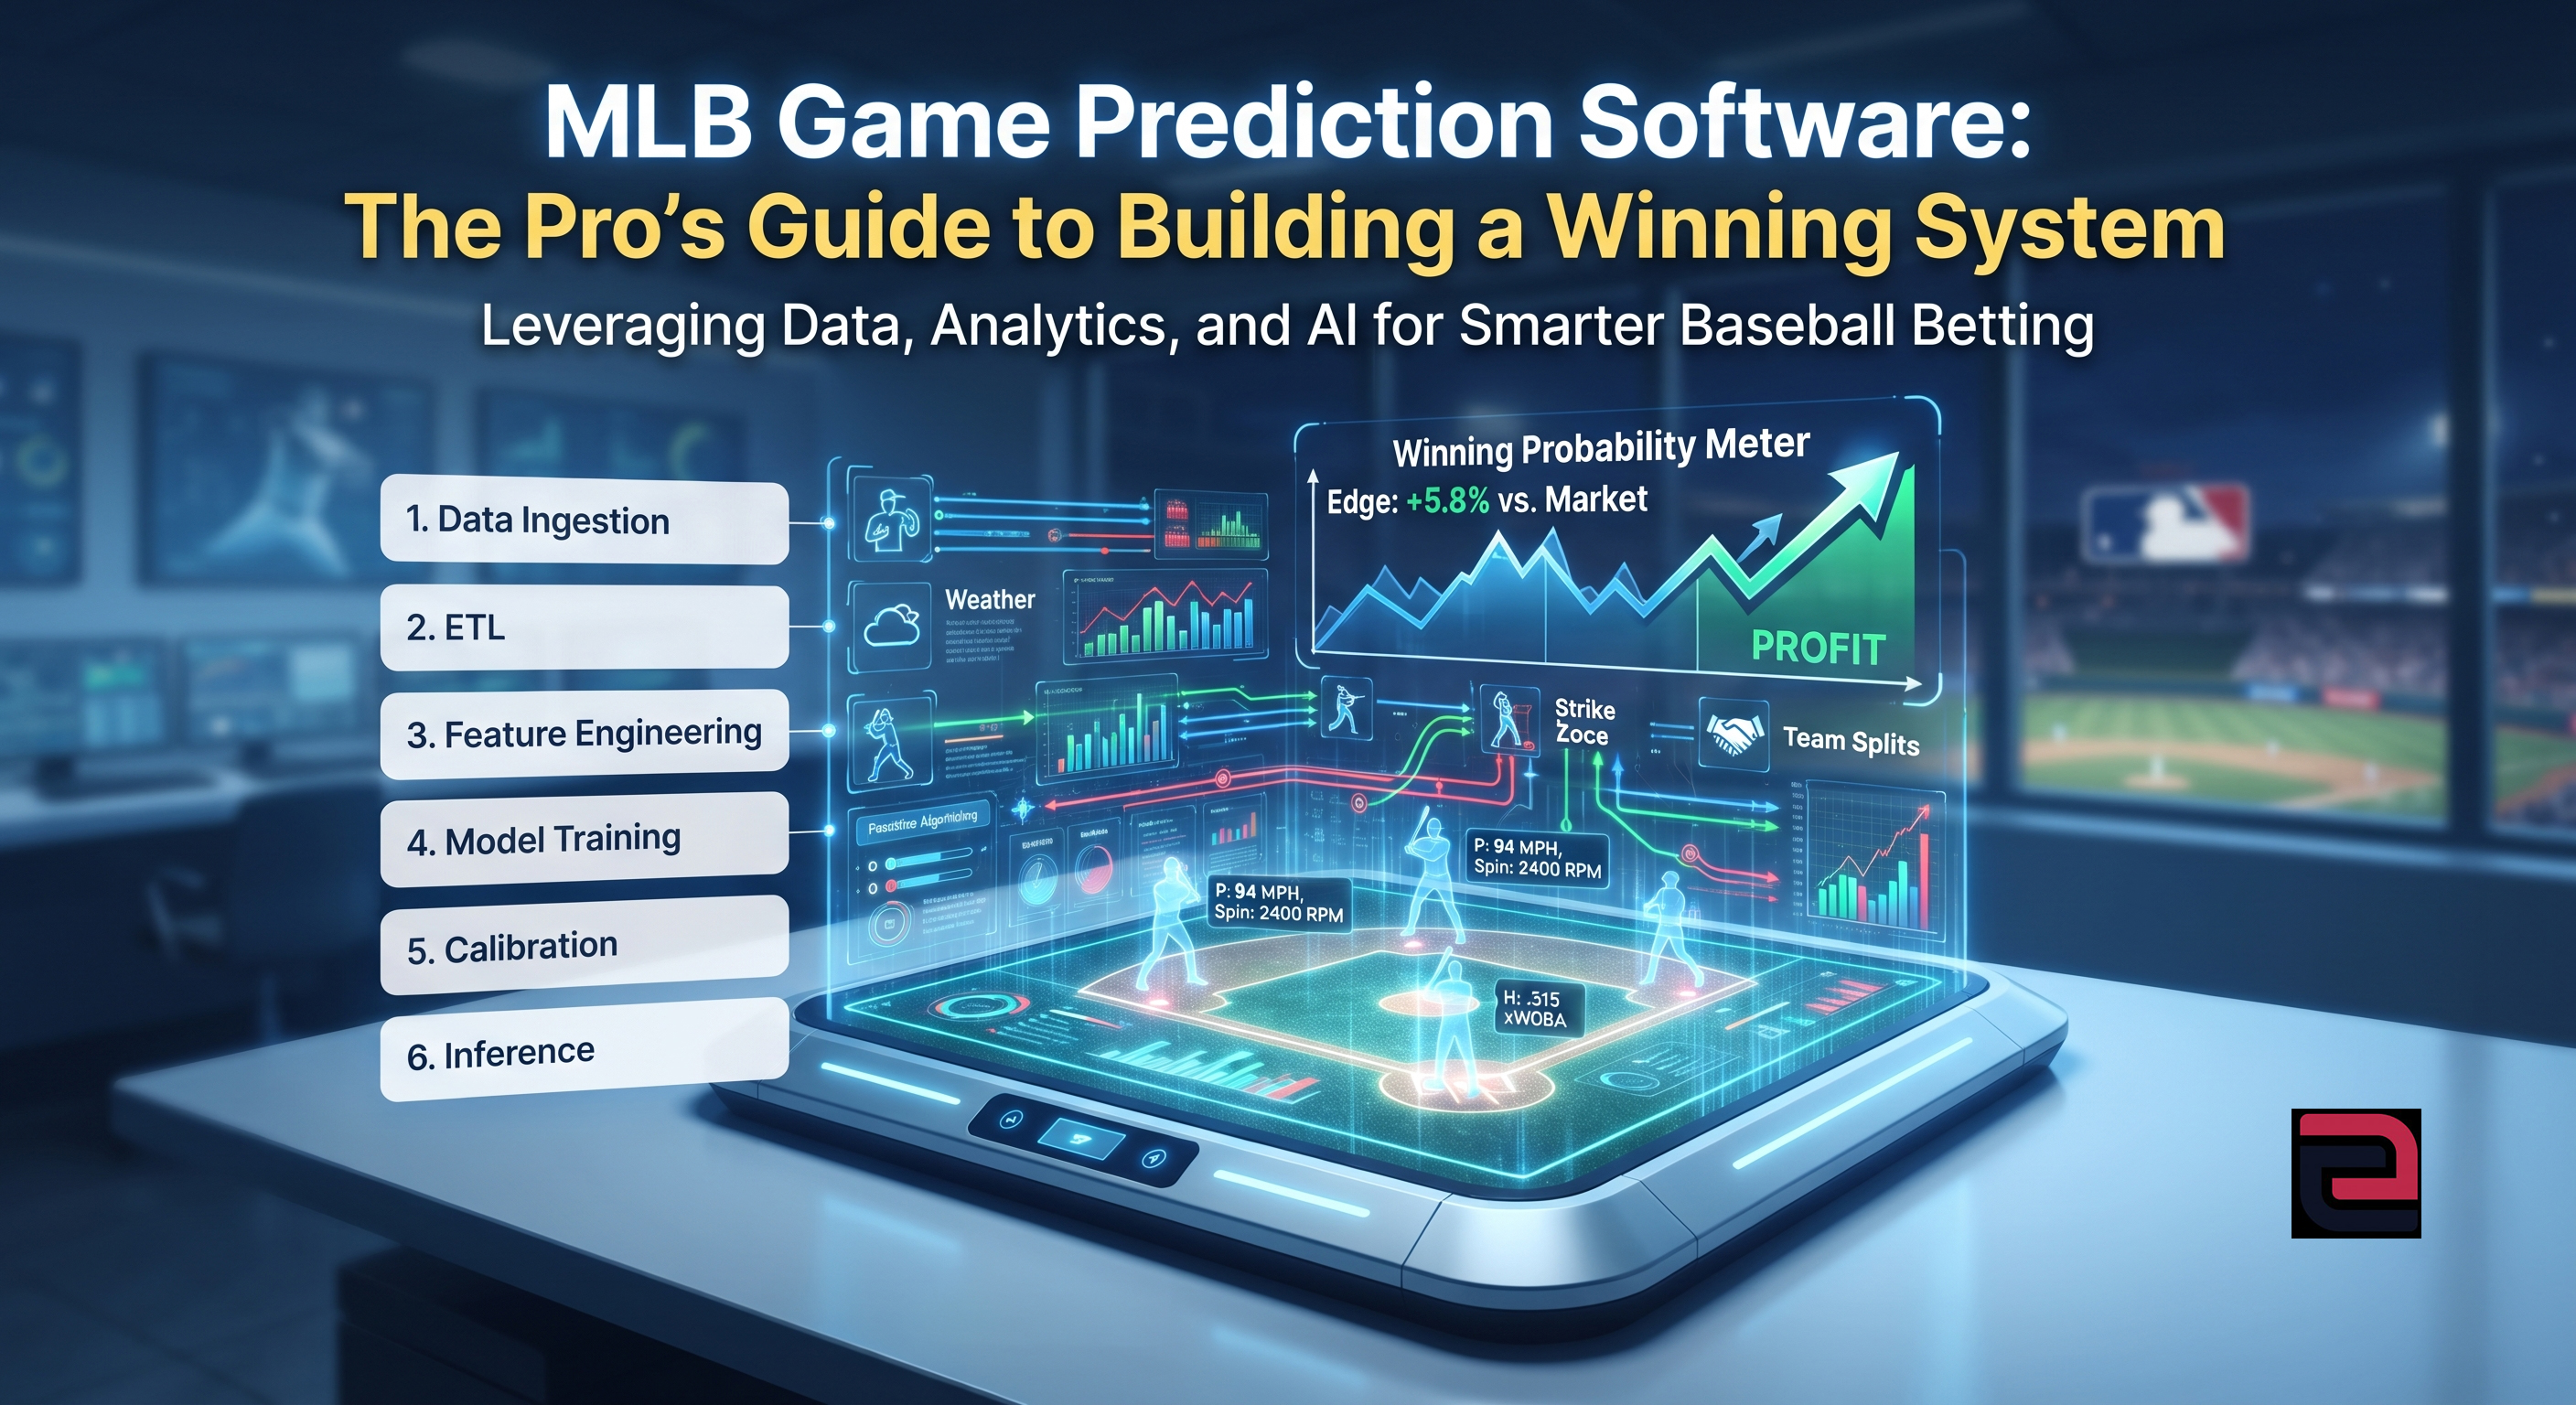
If you’re looking to dominate the 2026 baseball season, you’ve probably realized that "gut feelings" won’t cut it anymore. As a pro analyst, I’ve seen the evolution of the game, and today, success hinges on your ability to leverage a high-fidelity sports betting forecasting system to find value before the rest of the market catches up. We’re talking about moving beyond simple box scores and building a pipeline that respects the chaotic, lightning-fast nature of MLB news cycles. Whether you’re a hobbyist or looking to scale your own operation, the philosophy remains the same: garbage in, garbage out. If your inputs aren't as sharp as the data used by major syndicates, you are fighting a losing battle.
Building MLB Game Prediction Software Pros Trust in 2026
Role and scope of MLB game prediction software
I build and run models for a living, and in 2026 the bar is simple: reliable inputs, transparent probabilities, and speed that matches the cadence of MLB news. Bettors, quants, and trading teams don’t want black-box locks. They want calibrated win probabilities with context and knobs they can turn when a lineup flips at 3:40 p.m. What matters most to a pro analyst today is data quality and coverage, which means seamless ingestion of Statcast, lineups, weather, and park factors. You need zero gaps and verifiable timestamps. Latency is the silent killer, so you must update slates within a few minutes of lineup drops, bullpen news, and weather shifts. Day-of edges decay fast, and if your software can’t handle that, you’re dead in the water. Interpretability is also key. You need tools like SHAP so you can tell a coach, trader, or your own skeptical self why a number moved. Calibration is the final piece of the puzzle. A 58% probability should win about 58% over time. If not, fix the calibration layer before scaling stakes. Backtesting that holds up is essential, too. We use rolling, leakage-controlled backtests that mimic real decision timing rather than random cross-validation tricks. Robustness to roster churn is another requirement. Call-ups, rehab starts, and bullpen games can wreck brittle models, so shrinkage and hierarchy help keep things stable. Repeatable workflows, versioned data, and scenarios like late scratches and weather risk bands already need to be priced into your outputs. ATSwins users expect those same qualities day to day—data-driven picks, player props, betting splits, and transparent profit tracking—so the MLB engine needs to play nice with that environment, not fight it.
Data sourcing, ETL and feature engineering
For core data, you absolutely need Statcast tracking data from Baseball Savant. This is your pitcher skills backbone and batted-ball context, including pitch velocity and movement, spin, release height, swing-miss rates, and expected stats. Next, pull historical game logs from Retrosheet for line scores, play-by-play, substitutions, and seasonal rhythm. Park factors and platoon splits from FanGraphs are vital for filling gaps on small samples, especially for base running and defensive grades. Live lineups are non-negotiable. If your stack cannot re-score when a lineup posts, you’re behind. Finally, weather data including temperature, dew point, wind speed, and precipitation risk is essential. For your ETL blueprint, keep it minimal but solid. Ingest data by pulling Statcast game-by-game, scrape lineups, and fetch weather snapshots at 8AM, 12PM, and 3PM local to the park. Store everything in columnar files like Parquet, partitioned by date. Normalize team, player, and park IDs across all your sources, and build a versioned ID map. Construct your rolling windows with strict cutoffs: 7, 14, 30, and 90-day splits for hitters, starters, and bullpens. Always exclude future data relative to the game to prevent leakage. Use tools like Cron or Airflow for orchestration, ensuring that if you miss an ingest, you have alerts and fallbacks to the last known state. Your feature engineering should focus on things that move the needle. Monitor pitcher form through rolling pitch counts and velocity slopes. Track hitter quality using expected measures like xwOBA and line-drive rates. Factor in umpire tendencies by using strike zone heat maps and called-strike rates. Bullpen leverage and freshness are critical; track days since last appearance and rest-adjusted xFIP. Don't forget travel and schedule friction, especially for teams coming off long cross-country flights or playing day-games after night-games. For leakage control, the rule is simple: if the data wasn’t available before the lineup lock, it cannot be in the training set. You must publish your cutoff times so that audits are fast and honest.
Modeling approaches and evaluation
Start simple with logistic regression to create a clean baseline for win probability. It’s easy to interpret and perfect for quick calibration checks. From there, move to gradient boosting with libraries like XGBoost, LightGBM, or CatBoost, which handle non-linear interactions between weather, park, and batted-ball types beautifully. You must calibrate early. Even a decent raw model needs a calibration layer, like Platt scaling or isotonic regression, to tighten your Brier score immediately. Use hierarchical effects by partially pooling data across similar pitchers and clubs to reduce variance when dealing with rookies or rehab starts. Your calibration must survive the season, so split your training and validation by time, not random folds. Monitor reliability with Hosmer-Lemeshow bins and focus on the operational bands you actually stake, like the 52% to 54% range. Account for structural quirks like doubleheaders or bullpen games by introducing game-level correlation terms. If you don’t beat the market close consistently, narrow your focus to pre-lineup windows where model latency gives you a distinct edge. Your validation protocol must mimic reality through rolling backtests that slide forward week by week. Score your predictions against the Brier score for accuracy and log loss to punish overconfidence. Always watch for drift. If your SHAP values shift or if call-ups are causing error spikes, you need to be ready to retrain or blend in better priors. Maintaining a compact reference table for your metrics is a great way to stay organized, tracking things like calibration curves and drift alongside your predictive performance.
Workflow, MLOps and explainability
You need to version everything. Use Git for code and DVC or Parquet versioning for data to ensure every model run is reproducible. Serialize your training metadata, including feature lists, hashing seeds, and calibration fits. Track your experiments like a pro with tools like Weights & Biases to log runs, hyperparams, and calibration plots. Your inference pipeline should be fast and flexible, performing batch scoring every morning and event-driven rescoring whenever a lineup drops or weather flips. Explainability is what earns the trust of the stakeholders in your operation. Use SHAP values to show exactly why a game moved from 53% to 57%—whether it was an umpire’s zone or a sudden wind shift. This is where a robust sports betting data platform becomes invaluable, allowing you to bridge the gap between complex model outputs and actionable betting insights. You should produce global reports every week to see which features are driving the most movement and look for potential leakage. Monitoring and alerting are essential for keeping your system running smoothly. You need to know immediately if a data source goes stale or if your predictions suddenly compress into a narrow, unrealistic band. Scenario analysis is also part of the workflow. You need "what-if" switches that allow you to flip a starter, change the roof status, or remove a player to see how the numbers react instantly. Finally, your risk controls should be tied to confidence bands, widening those bands for high-variance situations like bullpen games or extreme weather.
Practical build steps and daily use
A minimal, effective pipeline follows a standard ingest, clean, feature-build, train, calibrate, and score cycle. Start your day by pulling the previous night’s data and refreshing your season-to-date tables. Clean the data by harmonizing IDs and recording timestamps for every single row. Once the features are built and cached, run your logistic and gradient-boosted models. Use scikit-learn pipelines to keep transformations consistent and reliable. Once scored, your outputs should be ready for trade decisions. Your weekly rhythm should look something like a full retrain on Mondays, light daily updates for news and weather, and a Saturday audit to check for drift and perform post-mortems on your worst misses. This is the definition of professional sports betting market intelligence. When publishing outputs, give your traders the calibrated probability, the fair price, the edge vs. the market, and the top three SHAP drivers. For dashboards, show edges binned by probability and track realized win rates to ensure your PnL matches your theory. If lineups aren’t confirmed within 90 minutes of the first pitch, mark the projection as provisional. Keep a strict decision log that records exactly what you saw and why you made the bet. This allows you to perform post-mortems that identify whether a miss was a data issue, a modeling flaw, or just a bad beat. Always be prepared for the day-of surprises, like the sudden announcement of a bullpen game or a massive wind shift. If you have the right infrastructure, these moments are opportunities, not emergencies.
Example feature sets, by role
For starting pitchers, focus on recent velocity trends—specifically the slope over the last three starts—spin stability, and release height variance. Include first-time-through vs. third-time-through penalties and platoon-specific whiff rates. For the bullpen, track relievers by rest, rolling xFIP with rest weights, and leverage-adjusted ERA. For hitters, look at rolling EV and xwOBA, changes in contact rates, and lineup slot stability. Game-level features should capture environmental factors like temperature, wind vector, humidity, and even the "get-away day" effect of a team playing after a long road trip. Always try to keep your feature set focused on what is actually predictive rather than just noisy or granular.
Tying modeling to betting edges: a simple workflow
The workflow begins in the pre-market, where you publish early, wide-band probabilities. Once pitchers are confirmed, narrow the bands and give more weight to pitcher-specific features. After the lineup drops, rescore everything and transition from soft estimates to firm, actionable recommendations. In the final hour before the first pitch, lock in your weather data and publish your final numbers. Post-game, you must log the results and compare them against your predicted probabilities. If your 60% bins are consistently hitting at 50%, you need to stop and recalibrate. This cycle of prediction, outcome logging, and adjustment is what differentiates a serious modeler from a casual observer.
Notes on interpretability and communication
When explaining your model, speak in human terms. Don't tell a teammate that "feature_42 had a 0.02 impact on the win probability." Instead, say "the drop in velocity over the last two starts suggests the pitcher is fatigued, which lowered our win probability by 2%." Keep a glossary of terms like Brier score and calibration so everyone is on the same page. Tracking "why we bet" at the exact time of the decision is one of the most powerful things you can do. It creates a historical record of your thought process that allows you to spot patterns in your own biases or blind spots over time.
Common failure modes and fixes
The most common failure is leakage, where your model seems perfect in testing but loses money in the real world. This is almost always due to using future information—like post-game weather—in your training set. Fix this by enforcing strict cutoffs. Another common issue is overconfidence. Gradient-boosted models love to output extreme probabilities. Use an isotonic calibrator to pull those probabilities back to reality. If you see volatility with rookies, use hierarchical priors that shrink their performance toward league-average projections until they have enough data to prove otherwise. If your metrics drift during the summer, it's likely a change in the run environment; update your weather-to-run mappings and recalibrate more frequently.
Lightly opinionated tips for 2026
Don’t overload your model with micro-features that look great in April split reports; you will overfit every single time. Start with 30 to 50 features you truly trust and only add more if you have a rock-solid reason. Keep your live system boring. A system that is easy to maintain is a system that won’t break when you are under pressure. Always explain your edges in baseball terms, not just as mathematical outputs. Your job as a modeler is to provide context so the person placing the bet understands the "why." Finally, maintain a public changelog. If you update the way you model bullpen rest, tell your team. Transparency is the bedrock of a professional operation.
A short checklist for daily readiness
Check your data freshness first: is Statcast up to date? Are lineups ingested within five minutes? Is the weather snapshot accurate? Run your leakage tests: did you enforce that all features were available before the game started? Check your calibration: is the reliability within tolerance for the last two weeks? Ensure reproducibility by saving your model binary and feature schema for every single run. Make sure your risk controls, like confidence bands and scenario toggles, are ready to go. Finally, log your PnL by probability bin. This is the only way to know if your edge is real or just a mirage.
With these pieces in place—reliable pipelines, calibrated models, interpretable outputs, and practical workflows—you have a system that can compete with the best. Building and maintaining this kind of sports betting forecasting system isn't just about math; it’s about having a repeatable process that turns massive amounts of baseball data into a clear view of where the market has made a mistake. When you integrate this with a professional-grade sports betting data platform, you aren't just betting; you are operating an analytical business that can scale from a single person to a full-scale operation that lives on precision, speed, and consistency.
Conclusion
Data and timing win in MLB predictions; clean feeds, live lineups, weather, and calibrated odds matter most. Keep roll-forward tests, simple features, and clear risk rules. The takeaway: build trustable numbers then act fast—repeat daily. Our team at ATSwins brings AI-powered picks, player props, betting splits, and profit tracking across NFL, NBA, MLB, NHL, and NCAA. Try the free or paid plans, learn the workflows, and start making smarter bets.
Frequently Asked Questions (FAQs)
What is MLB game prediction software and how does it work?
MLB game prediction software uses baseball data to estimate win probabilities, totals, and sometimes props. It ingests things like starting pitcher stats, bullpen usage, confirmed lineups, park factors, weather, travel, and injuries. Then models—often logistic regression or gradient boosting—turn those inputs into probabilities. Good software also calibrates its outputs so a 60% line really wins about 60% over time, not just on paper. The result: clear, time-stamped estimates you can compare to market odds for value.
Which data matters most for mlb game prediction software?
The big rocks first are starting pitchers, including their recent form, pitch mix, velocity changes, and rest days. You also need the bullpen state, which includes the leverage used over the last three days and role clarity. Confirmed lineups are critical because of handedness splits and injuries. Park and weather conditions like altitude, wind, and temperature can move edges fast. Umpire tendencies regarding zone size and called-strike bias can also tilt run totals. Finally, travel and schedule factors like back-to-backs and doubleheaders matter. Timing is everything; the best software respects information cutoffs to avoid leakage.
How do I know if MLB game prediction software is actually accurate?
Look for calibration, where the predictions are grouped into bins and the realized win rates match the predicted probability. Proper scoring like Brier score and log loss is much better than a simple win-loss record because they reward honest probability estimates. Use roll-forward backtests that walk through seasons chronologically. Benchmark against a simple baseline like the closing line to ensure you have consistent lift. Always monitor the sample size and recognize that baseball variance means you will have cold spells. If a tool doesn’t publish calibration or only shows cherry-picked streaks, be skeptical.
How should I use MLB game prediction software with my own betting plan?
Keep it simple: set thresholds and only bet when your model edge clears, for example, 2% or 3% vs the best available price. Always compare your number to the live odds; if there’s no price, there’s no play. Use a small Kelly fraction or flat stakes to manage your bankroll. Avoid chasing market steam late unless the lineup or weather has changed in your favor. Log your results and segment them by probability bins to see if your edges are actually holding up. Your daily routine should be boring and repeatable.
How does ATSwins.ai help with MLB game prediction software users?
ATSwins.ai is an AI-powered sports prediction platform offering data-driven picks, player props, betting splits, and profit tracking across NFL, NBA, MLB, NHL, and NCAA. Free and paid plans give bettors insights and clear how-tos to make smarter, more informed decisions. For MLB specifically, it surfaces transparent probabilities, props, and context, then logs outcomes so you can see what’s working. It pairs well with the tools you already use by adding market-aware insights and performance tracking, not replacing your process. You can learn more at https://atswins.ai and start with a free plan, then scale if it fits your workflow.