

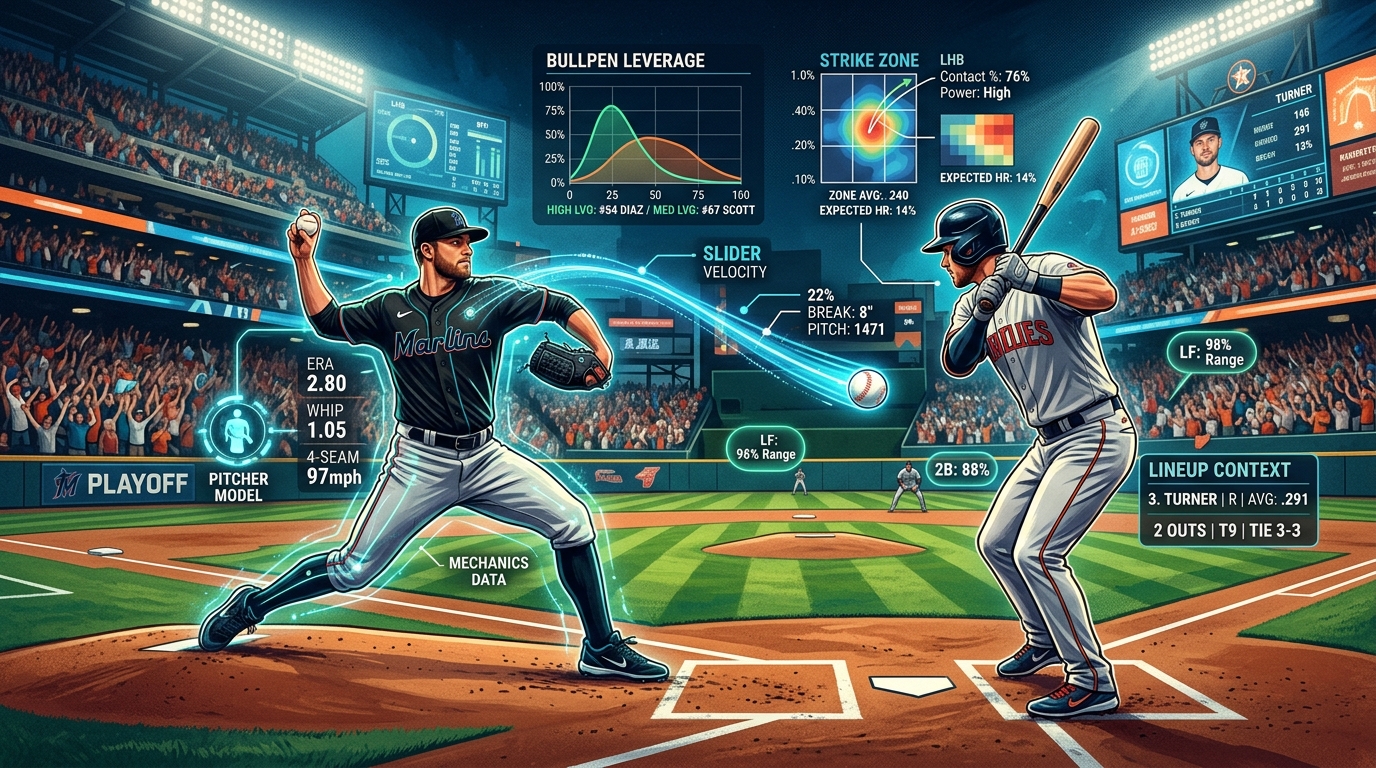
I’m a sports analyst who leans heavily on data and AI because baseball can make a simple matchup look way more obvious than it really is. A pitcher can have great surface numbers and still be a bad matchup for a certain lineup. A team can have a strong offense and still struggle because the opposing bullpen is perfectly built to attack its best hitters. Weather, rest, defensive positioning, catcher skills, and even the order of the hitters can move a projection.
That is why I prefer building a matchup from several connected pieces instead of looking at one stat and calling it an edge. The goal is not to predict every pitch perfectly. Nobody can do that. The goal is to create a better estimate of what is likely to happen, understand where the uncertainty comes from, and know when the market may be giving you a number that is different from your own fair price.
For postseason baseball, that process becomes even more important. Managers shorten starter leashes, high leverage relievers become available earlier, and small lineup decisions can change the shape of a game. In this guide, I’ll walk through the way I approach those situations, how I organize the information, and how I use ATSwins to turn the research into a practical betting workflow.
Table Of Contents
Pitching matchups and leverage
Hitting context
Run prevention edges: defense and framing
Game scripts and variance
Modeling workflow for ATS bets and props
Step-by-step checklists and shortcuts
Templates you can reuse
Practical betting angles with AI support
Useful tools and references
Putting it all together: an example workflow for a Game 1
Common pitfalls to avoid
Quick explainer: the metrics you’ll reference most
Light scenario planning: if the series flips
Final checklist you can keep near your keyboard
Conclusion
Pitching Matchups and Leverage
Projected Rotations and Rest
The first thing I want locked down is the starting pitching situation. Probable starters are not always final starters, and postseason managers can be creative when a pitcher is dealing with fatigue, an injury concern, or a workload restriction. I start with the most likely starter and then give realistic weight to the alternatives when there is uncertainty.
For a projected starter, I track rest days, recent pitch counts, recent innings, velocity, and any signs that his role has changed. A pitcher coming off a normal five day rest cycle should not automatically receive the same workload projection as a pitcher who has been stretched out differently or has recently shown a velocity decline.
I also care about what happened in the pitcher’s previous two appearances. A simple innings total can hide a lot. A starter who threw 95 pitches but worked through several long counts may be in a different position than someone who threw 95 efficient pitches. The same idea applies to relievers.
Extra rest can help command for some pitchers, especially those who rely heavily on velocity and breaking ball quality, but I would not treat it as a guaranteed boost. A longer break can also affect timing. The safer approach is to make a modest adjustment and widen the range of possible outcomes instead of forcing a dramatic projection.
Postseason baseball makes workload even more important because managers are generally less patient. A regular season starter might be allowed to work through a bad inning because the bullpen needs rest. In October, that same starter can be removed after one or two dangerous at bats if the manager believes the matchup has turned.
That means I do not only project innings based on the pitcher's season average. I also ask what the manager is likely to do if traffic appears early. A pitcher with a strong bullpen behind him may have less room for mistakes than his regular season workload suggests.
Starter Form, K-BB%, Pitch Mix, and Attack Plans
K-BB% is one of the first pitching metrics I look at because it combines two outcomes that directly affect run prevention. Strikeouts remove balls in play, while walks create free baserunners. A pitcher who consistently misses bats and avoids walks usually has a stronger foundation than one living on weak contact alone.
Recent form matters, but small samples can be dangerous. I prefer blending the full season with recent starts and a smaller component for longer term ability. That keeps one hot or cold week from dominating the model.
Pitch mix is where the analysis gets more interesting. I want to know what the starter throws most often to right handed and left handed hitters, how often those pitches generate whiffs, and whether the movement or velocity has changed. A small change can be meaningful when it reflects a deliberate adjustment that the pitcher has maintained for several starts.
The next step is matching those pitches to the lineup. Suppose a starter relies heavily on a slider against right handed hitters and the opponent has several right handed bats who perform well against sliders. That does not automatically mean the pitcher will fail. It does mean the matchup deserves a different projection than the generic season long numbers suggest.
I like identifying two or three major collision points. These are situations where the starter’s most important pitch meets a hitter or group of hitters that either handles it extremely well or struggles badly against it. Those collision points can influence strikeout projections, expected contact, and the chance of the starter getting through the order a third time.
Pitch shape matters here too. Two pitchers can both throw sliders, but they may not be throwing the same pitch. One might have a short, hard slider that produces weak contact, while another relies on a larger sweeping version that generates chase. Treating every pitch under one broad category can hide important matchup differences.
The same thing applies to four seam fastballs. Velocity is important, but location, vertical movement, release height, and the hitter's swing path all influence whether that fastball becomes a strikeout pitch, a fly ball, or a hard line drive.
When I build a matchup, I want to understand not just what the pitcher throws, but why he throws it. That gives the model a much better chance of identifying whether the matchup is genuinely favorable or just looks favorable because of a basic stat.
Platoon Splits and Lineup Fit
Raw left right splits are still useful, but they should not be the final answer. Baseball hitters are not simply good or bad against left handed or right handed pitching. Their performance can depend heavily on the actual pitch shapes they face.
I usually build a mental lineup map from the top six hitters first. For each player, I want to understand handedness, contact quality, chase behavior, and performance against the starter’s primary weapons. Then I think about the bottom third because those hitters can determine whether a starter reaches the next inning efficiently or is forced into long counts.
The top of the lineup gets most of the attention, and that makes sense. If hitters one through four have a strong matchup against the starter’s main pitch, the manager may have to go to the bullpen earlier. If the lower part of the order is extremely patient, the starter can also reach a pitch count problem before getting back to the top.
That is one of the reasons I do not like evaluating a starting pitcher against a lineup using only overall team batting average. A lineup can look average overall while having three or four hitters who are almost perfectly positioned to attack that specific pitcher.
On the other side, a team can have a strong overall offense while still having a weak matchup because its best hitters are vulnerable to the starter's primary pitch. The individual matchup matters more than the reputation.
Bullpen Pecking Order With Rest
October changes bullpen strategy. A closer is not necessarily a ninth inning pitcher anymore. If the heart of the opposing lineup is due in the eighth inning of a tie game, the best reliever may be used there.
That means I build a leverage ladder rather than a simple closer list. I separate the elite high leverage arms from secondary setup options and lower leverage depth. Then I check which pitchers are actually available.
Recent workload is critical. I look at the previous several games and track pitches, appearances, and back to back usage. A reliever who threw 25 pitches the night before may technically be available, but that does not mean I should project him the same way as a fully rested arm.
I also assign rough availability probabilities. A rested top reliever may be close to fully available, while a pitcher used heavily on consecutive days may have a much lower chance of taking a normal workload. These probabilities are especially useful in simulations because they prevent the model from assuming that every elite arm is available in every scenario.
Bullpen roles also change depending on the score. A team trailing by four runs is unlikely to use its best reliever in the same way it would if the game were tied. A model should recognize those different game states rather than giving every reliever the same appearance probability.
The upcoming hitters matter too. If the opponent's best three hitters are coming up, a manager might use an elite reliever earlier than expected. If the bottom of the lineup is coming up with a three run lead, a lower leverage pitcher might be used.
This is one of the biggest areas where postseason baseball differs from the regular season. The manager is not simply trying to distribute innings evenly. The goal is to win the most important situations.
Opener and Piggyback Situations
A postseason team may also use an opener or piggyback arrangement when it does not trust a traditional starter to handle a lineup multiple times. In that situation, I do not treat the first pitcher as a normal starter.
Instead, I think about the combined pitching plan. If one pitcher is expected to face the lineup twice and another is expected to provide several bulk innings, the run environment may be closer to facing two average starters than one traditional starter.
Manager comments, recent usage, and workload patterns can provide clues. If a team has recently used a pitcher for two or three innings in a similar role, that is more useful than simply assuming the listed starter will work five or six innings.
An opener can also change the matchup for the first trip through the order. If the regular bulk pitcher struggles badly against a certain group of hitters, an opener with a different handedness or pitch mix can temporarily protect him.
That is another reason to simulate multiple pitching paths rather than assuming the announced starter controls the entire game.
Hitting Context
Platoon Plans and Bench Bats
The lineup is not finished when the first nine names are announced. I also want to know which hitters are vulnerable to a late substitution.
A player with a major same side weakness can have his plate appearance count reduced if the opposing manager has a strong matchup available. That matters a lot for player props. A hitter projected for four plate appearances has a completely different probability distribution from one who may only receive three.
Bench players also have different roles. Some are used because they control the strike zone, while others are power bats who are saved for one specific matchup. Understanding those roles helps determine how likely a substitution is when the game reaches the later innings.
A player who starts the game does not necessarily have a guaranteed path to four plate appearances. That is a common mistake when evaluating hits, runs, RBI, and total base props.
If the player is likely to be removed in the seventh or eighth inning against a difficult same handed reliever, the model should lower his expected opportunity before calculating his statistical production.
Chase and Contact Rates
Two useful lineup characteristics are chase rate and zone contact. A patient team can create problems for a starter even without hitting many home runs. Long at bats increase pitch counts, expose secondary pitches, and can force a manager to make a bullpen decision earlier than planned.
On the other hand, high contact teams can reduce strikeout expectations even when facing a pitcher with a strong strikeout reputation. They may foul off the putaway pitch, extend at bats, and force the pitcher into the zone.
For player props, I pay special attention to hitters who combine low chase with strong contact. Those players can be difficult to project as easy strikeout targets because they tend to keep plate appearances alive.
Contact quality also matters. A hitter can have a high contact rate without producing much damage. Another hitter can strike out more often but create significant power when he connects. The matchup should account for both sides of that equation.
Batted Ball Quality and Park Environment
Home run totals can be noisy in small samples. Hard hit rate and exit velocity provide a better way to judge whether an offensive change is supported by underlying contact quality.
I also consider where the game is being played. Ballpark dimensions, wall heights, altitude, temperature, and wind can all influence how batted balls turn into extra base hits or home runs.
The key is not to overreact. A weather adjustment should modify a projection rather than completely rewrite it. If a hitter has strong contact quality and the park supports that contact, I may increase the expected power slightly. I would not suddenly project a career power hitter to double his normal home run probability because of one favorable wind reading.
Weather is especially important for totals. Wind blowing out can increase the carry of well struck balls, while cold conditions can suppress some types of power. Still, the starting pitching and lineup quality should remain the foundation.
Lineup Stability and Pinch Hit Risk
Stable lineups make player projections easier. When the manager is likely to keep the top of the order intact, the expected plate appearance range is narrower.
Pinch hit risk is more important for certain role players and platoon bats. If a hitter has a poor split against the likely late inning reliever and the team has a strong bench option, his fourth plate appearance may not be as safe as the pregame lineup suggests.
That is one reason I like adjusting plate appearance projections instead of simply adjusting a player's batting average. The substitution decision changes opportunity first, and opportunity changes the distribution of outcomes.
A player with a projected 3.5 plate appearances and a player with a projected 4.2 plate appearances should not have the same expectation for a hits over or total bases over, even if their underlying offensive skill is identical.
xwOBA by Pitch Type
Expected production against specific pitch types can reveal matchup opportunities that basic splits miss. If several hitters are strong against the starter’s favorite pitch, the lineup may have a real advantage even if its overall numbers are only average.
I use this information to create a matchup map. I want to know which hitters are likely to see their preferred pitches and which hitters are most vulnerable to the starter’s best weapon.
The same process works for relievers. A setup pitcher who relies heavily on a splitter may be a poor matchup for one hitter and an excellent matchup for another. That becomes especially important when the game reaches the highest leverage innings.
The more specific the matchup, the more useful the analysis becomes. Instead of saying that a hitter is good against right handed pitching, I want to know whether he is good against the exact pitch family that the opposing right hander throws most frequently.
Run Prevention Edges: Defense and Framing
Defense is easy to overlook because it does not always show up in the basic box score. In a low scoring postseason game, though, one defensive play can change the entire inning.
Outs Above Average is useful for understanding range and difficult plays. I pay particular attention to the middle infield and center field because those positions can have a large effect on how many balls become outs.
The pitcher’s batted ball profile matters here. A ground ball pitcher benefits more from strong infield defense, while a fly ball pitcher benefits from good outfield range and positioning.
Catcher framing can also matter when the pitcher has good command around the edges of the zone. If a pitcher already works close to the strike zone boundary, framing skill can help turn borderline pitches into called strikes. I treat this as a modest adjustment rather than a giant advantage.
Baserunning is another small edge. Catcher exchange time, pitcher delivery time, and defensive awareness can influence stolen base attempts and first to third opportunities. These factors are rarely enough to decide a game by themselves, but they can matter in close run environments.
Double play potential is especially interesting with runners on first. A sinker heavy pitcher facing a ground ball hitter with a strong middle infield behind him can create a meaningful reduction in expected runs for that specific state.
Defensive positioning can also matter. Teams know which hitters pull the ball and which hitters tend to use the opposite field. If a defense consistently positions itself correctly, the expected value of certain types of contact can change.
Again, I do not want to overstate the effect. Defense should usually be a supporting adjustment rather than the central reason for a projection.
Game Scripts and Variance
Umpire Zones
Umpire tendencies can influence both totals and strikeout projections. A consistently wider zone can help pitchers with command, while a tighter zone can increase walks, pitch counts, and traffic.
I keep the adjustment conservative. Umpire data is noisy, and one game should never cause a major projection swing. If the pitcher already has strong command and the expected zone supports his approach, I may lower the run expectation slightly and raise the strikeout expectation modestly.
The biggest mistake is treating an umpire as the entire explanation for a game. The zone should influence a projection, not replace the pitching and hitting analysis.
Off Days and Bullpen Aggression
Postseason scheduling gives managers opportunities to use their best relievers aggressively. When there is an off day coming, a manager may be more comfortable asking a top reliever for more than one inning or using him earlier than usual.
That matters for totals. A game that reaches the sixth inning tied may not be a normal bullpen environment. The best arms may be waiting, especially if the opposing lineup is about to reach its best hitters.
This is one reason why postseason totals can sometimes be lower than casual bettors expect. The market knows the teams are good, but the real difference comes from how quickly managers can move to their strongest pitchers.
Home Field and Environment
Home field effects are real, but they are often overstated. I am more interested in specific environmental details such as communication, weather, sightlines, and travel.
A road team arriving after a long trip may not suddenly become a bad offensive club, but small effects can influence the first few innings. I treat those factors as minor adjustments, not major reasons to fade a team.
The same applies to crowd noise. It can affect communication and comfort, but I would not build a large mathematical adjustment around it unless there is strong evidence supporting one.
Sequencing Luck and Strand Rate
Postseason narratives often focus on clutch hitting and pitchers who supposedly know how to escape trouble. Sometimes there is real skill underneath the result, but strand rate can move quickly.
If a team has stranded an unusually high percentage of runners over a short stretch, I want to know why. A high strikeout rate and strong walk prevention can support a high strand rate. If those underlying skills are not present, I expect some regression.
This is where a model can prevent emotional reactions. A team that has won three straight games by constantly escaping bases loaded situations may not be as dominant as the scoreboard suggests.
Sequencing can also create the opposite effect. A team may hit the ball hard directly at defenders, leave runners stranded, and look terrible in the box score. If the underlying contact is strong, I do not want to automatically downgrade the offense because the recent results were poor.
Modeling Workflow for ATS Bets and Props
I start with a pre series baseline. For offense, I blend season long performance with recent form and a projection component when appropriate. The exact weights depend on the situation, but the basic idea is to keep the model stable while still recognizing meaningful changes.
For starters, I give the most weight to established skill indicators such as strikeout and walk rates, then layer in recent pitch quality, velocity, pitch mix, and expected workload. Bullpen projections are role adjusted because a team's best reliever and its lowest leverage arm should not be treated as interchangeable.
Then I adjust for confirmed information. Rest, travel, weather, lineup changes, and bullpen availability can all move the baseline.
The next step is simulation. Instead of asking only whether Team A is better than Team B, I want to know what happens across many possible game states. What if the starter leaves after four innings? What if the favorite leads by one run in the sixth? What if the game is tied when the opposing heart of the order comes up?
Those scenarios allow the model to represent bullpen strategy instead of pretending the game follows a fixed script.
For each late inning state, I consider which reliever is most likely to be used based on availability, handedness, leverage, and the upcoming hitters. I also account for the possibility that a reliever gets used earlier and becomes unavailable later.
This is where AI can be helpful. It can organize a large amount of information, identify unusual combinations, and help compare scenarios quickly. But the model still needs sensible inputs. AI cannot rescue a projection built on incorrect lineups or outdated pitcher availability.
I also compare the projected run environment against reasonable historical postseason conditions. I am not trying to force the model toward a historical average. I am checking whether the result makes sense.
If my projected total is dramatically different from what a reasonable postseason environment would suggest, I want to understand why. Maybe the starting pitchers are unusually weak. Maybe both bullpens are exhausted. Maybe the weather is extreme. There should be an explanation for a major deviation.
Finally, I publish ranges instead of pretending there is certainty. A fair price should be treated as a distribution. If my model gives a team a 57 percent win probability, that does not mean the team will win 57 percent of this specific game. It means that across many comparable situations, that probability would be the appropriate expectation.
That distinction is important because sports betting is not about knowing what will happen. It is about estimating probabilities better than the price being offered.
ATSwins can be used to organize this process by keeping projections, betting angles, player props, and performance tracking in one workflow. The biggest benefit is consistency. If I can track why I made a bet and what the model expected, I can later determine which types of edges actually perform.
Step-by-Step Checklists and Shortcuts
A starter versus lineup review can be done quickly once the process becomes familiar. I begin with the starter's pitch mix, split by hitter handedness. Then I focus on the top six hitters and compare their strengths to those pitches. After that, I check chase and contact tendencies and estimate how difficult the lineup will be to navigate.
For the bullpen, I review recent appearances, pitch counts, and back to back usage. I then separate the relievers into roughly three availability groups. The first group is fully available, the second is usable with limitations, and the third should only be considered in a lower leverage situation.
The defensive pass comes next. I look at the most important defensive positions for the expected batted ball profile and consider catcher and baserunning factors when they are relevant.
The final quick pass is environmental. I check weather, park conditions, umpire tendencies, and travel. If all of those inputs point in the same direction, I have more confidence in the adjustment. If they conflict, I keep the adjustment small.
The whole process becomes much faster once the same framework is used every day. The point is not to spend hours looking at every possible stat. It is to make sure the important variables are consistently reviewed.
Templates You Can Reuse
For a pitch type matchup template, I keep a simple written profile for each team. I record the team's expected production against the starter's main fastball, slider, changeup, curveball, cutter, or sinker usage. I then write down which hitters create the strongest matchup and which hitters are most vulnerable.
For example, if three important hitters have above average production against sliders and the starter throws a slider nearly half the time to that side of the plate, that becomes a major matchup note. It does not guarantee success, but it tells me where to look.
For a bullpen template, I write the top three or four relievers in order of leverage, then record rest status, handedness, primary pitch, and likely lineup pocket. This is more useful than simply listing the closer and setup man because it gives me a plan for different game states.
For a player prop template, I record expected plate appearances, likely batting order position, starting pitcher matchup, likely late relievers, pinch hit risk, and the range of possible outcomes. That makes it easier to identify when a prop is being priced from an unrealistic opportunity assumption.
I also like keeping a short note explaining why the model likes the prop. If the reason cannot be explained clearly, the edge may not be strong enough to act on.
Practical Betting Angles With AI Support
For sides, I pay close attention to teams that can create a major leverage advantage in the middle innings. A team with an average starting pitcher but a rested group of elite relievers can be more attractive than a team with a small starting pitching edge and a tired bullpen.
For totals, I become more interested in unders when both teams have rested high leverage arms, strong command oriented starters, and a favorable pitching environment. I become more interested in overs when starters are likely to exit early and the best relievers have limited availability.
For strikeout props, the key is balancing strikeout skill with workload. A pitcher can have a huge matchup advantage and still fail to clear his strikeout number if the manager plans to remove him early.
For hits, runs, RBI, and total base props, plate appearance opportunity is just as important as player skill. A hitter projected for four or five opportunities has more room for production than a platoon player who may lose his final plate appearance.
Steal props can also become interesting when a pitcher is slow to the plate and the opposing catcher has average or below average throwing characteristics. These are situational edges, but they can be useful when the market does not fully account for the matchup.
The important part is that AI should support the process rather than dictate it. I use AI to organize data, compare scenarios, summarize changes, and identify questions that deserve a closer look. The final decision should still be based on the quality of the underlying evidence.
One of the best uses for AI is scenario testing. Instead of asking whether a team is going to win, I can ask what happens if the starter works five innings, what happens if he only works four, and what happens if the game stays tied into the eighth.
That produces a much more useful picture of risk.
Useful Tools and References
For a strong MLB matchup workflow, I want access to official league information, reliable pitch level data, advanced team and player statistics, lineup announcements, weather information, and game logs.
The most important thing is not using the largest number of sources. It is using reliable information consistently. If I use one source for pitching data, another for weather, and a third for lineup news, I want to know when those sources update and whether their definitions are consistent.
The goal is to reduce uncertainty, not create a giant pile of information that is impossible to process.
ATSwins can then serve as the place where the research is translated into projections, betting angles, and performance tracking. That final step matters because research without a record of results makes it difficult to know what is actually working.
If a certain type of pitch matchup consistently produces profitable results, that is useful information. If another angle sounds smart but loses over a large sample, the tracking process should reveal that too.
Putting It All Together: An Example Workflow for a Game 1
Several hours before the game, I establish the starting pitcher baseline. I confirm the likely starters, estimate their workloads, and identify the pitches that should shape the matchup.
Next, I study the top portion of each lineup. I am looking for obvious pitch type advantages and major weaknesses. I also identify hitters who could be removed later because of platoon concerns.
After that, I build the bullpen map. I want to know who is fully rested, who is limited, and which pitchers are most likely to face the heart of the lineup in a close game.
Around lineup confirmation, I update the plate appearance projections. A lineup change can affect several players at once, so I do not only adjust the player who was added or removed. I reconsider the entire batting order environment.
The final pregame step is comparing my numbers to the market. I am not looking for a prediction that sounds good. I am looking for a price difference large enough to justify the uncertainty.
Suppose my model makes a team a 56 percent favorite while the market price implies 51 percent. That difference might be interesting, but I still need to understand the uncertainty around the 56 percent estimate.
If the probability range is wide because the bullpen situation is unclear, I may decide the apparent edge is not large enough. If the probability is supported by confirmed starters, strong lineup fit, and rested high leverage arms, I may have more confidence.
Once the game starts, I watch for information that can materially change the projection. A meaningful velocity drop, repeated inability to land a key secondary pitch, an unexpectedly short starter leash, or an elite reliever warming early can all matter.
The key is reacting to information, not emotion. A first inning home run does not automatically make the over a better bet. A favorite falling behind does not automatically make its live price attractive. I want to know whether the event changed the underlying probability.
For example, if a team falls behind 2-0 after an error and a bloop hit, that may not be nearly as damaging as a pitcher losing velocity and command. The score is the same, but the information is completely different.
That distinction is one of the biggest advantages of a structured live betting process.
Common Pitfalls to Avoid
One of the biggest mistakes is overrating tiny samples. A hitter can go five for ten against a certain pitch and still not have a meaningful long term edge. The same applies to clutch hitting and short postseason stretches.
Another mistake is ignoring pinch hit risk. A player prop can look attractive because the player has a great matchup, but if the manager is likely to remove him before his fourth plate appearance, the projection may be too optimistic.
Travel is another factor that gets forgotten. It should not become an excuse for every poor performance, but unusual travel and scheduling can be included as a small environmental adjustment.
I also avoid assuming that closers always pitch the ninth. In postseason baseball, the highest leverage inning can happen earlier. If the opposing two, three, and four hitters are coming up in the eighth inning of a tie game, that may be the most important moment of the night.
Another common mistake is treating recent results as a direct representation of true talent. A team can score 12 runs one night and two runs the next without its underlying offensive ability changing much.
I also avoid forcing the model to agree with my opinion. If the data says an attractive looking team has a poor matchup, I want the model to say so. The entire point of using a model is to challenge my first impression.
Finally, I avoid adding too many tiny adjustments. If every variable gets a large weight, the model becomes unstable. Most environmental factors should move a projection only modestly unless there is strong evidence that the effect is meaningful.
Quick Explainer: The Metrics You’ll Reference Most
K-BB% is strikeout rate minus walk rate. It is a useful summary of a pitcher's ability to miss bats while limiting free baserunners.
Expected wOBA by pitch type estimates offensive production against a specific pitch based on the quality and type of outcomes. It is useful for connecting a hitter to the arsenal he is likely to see.
Hard hit rate measures the percentage of batted balls hit at 95 miles per hour or harder. It is useful for judging contact quality without relying only on home run totals.
Outs Above Average estimates defensive value based on the difficulty and likelihood of making plays. It helps identify teams that can turn more balls in play into outs.
Catcher framing metrics estimate how much value a catcher creates by receiving pitches near the edge of the strike zone. The effect is most interesting when paired with pitchers who consistently attack the edges.
Baserunning metrics measure more than stolen bases. They can capture advancement, reads, and other ways a runner creates value.
These metrics work best together. No single statistic should decide a postseason matchup.
I also like keeping an eye on workload indicators. Pitch count, innings per appearance, recent rest, and third time through the order expectations can be just as important as a pitcher's raw strikeout rate when evaluating player props.
Light Scenario Planning: If the Series Flips
Scenario planning becomes especially useful after an unexpected result. If a Game 1 starter exits early and forces the bullpen to cover several extra innings, the effect may carry into Game 2.
I would not automatically bet the next game's over because the bullpen was used heavily. I would first determine which relievers are actually affected. Losing one low leverage arm is very different from losing the top two setup pitchers.
If an offense struggles badly because it faced a pitcher whose arsenal was a terrible fit, I also avoid assuming that the offense is suddenly broken. A different starter with a completely different pitch mix can produce a very different projection.
The same principle applies to winning streaks. If a team has won several games because of unsustainably high sequencing luck, I want the model to recognize that before the market narrative catches up.
A series can also change quickly because of bullpen fatigue. If a team loses a close game but uses four of its best relievers, the result may be more important for the next matchup than the loss itself.
That is why I track usage rather than just wins and losses.
Final Checklist You Can Keep Near Your Keyboard
Before the game, I want the starters, rest, recent pitch counts, velocity, pitch mix, and expected workload accounted for. I want the top hitters mapped to those pitches, along with chase rate, contact ability, and pinch hit risk.
I want the bullpen organized by leverage and availability. I want to know which arms can realistically cover the sixth, seventh, eighth, and ninth innings in a close game.
I want the defense evaluated according to the expected batted ball profile. I want weather, park conditions, travel, and umpire tendencies considered without letting any single factor dominate.
Finally, I want my side, total, and player prop projections expressed as ranges. If the market is inside my uncertainty band, there may be no reason to act. If the market moves well outside the range supported by my model and the underlying information remains valid, that is when the situation becomes more interesting.
Keep the process simple. Update it when confirmed information arrives. Do not chase every piece of news. Do not change the projection just because a previous game produced a surprising result.
The best workflow is usually the one you can repeat every day.
Conclusion
The best MLB matchup analysis is not about finding one magic statistic. It is about connecting the pieces.
Pitching skill matters, but so does pitch selection. Lineup quality matters, but so does pitch type fit. Bullpen strength matters, but availability and leverage matter even more. Defense, framing, baserunning, weather, travel, and umpire tendencies can all create smaller adjustments that become meaningful when they point in the same direction.
The biggest improvement most bettors can make is simply becoming more systematic. Start with a baseline. Add confirmed information. Think about the game as a collection of possible states. Simulate those states. Compare your fair price with the market. Then track the result honestly.
That last part is huge. You will have bad beats, wrong reads, and games where a great process produces a terrible result. That does not automatically mean the model failed. Over time, the goal is to find out which inputs consistently improve your decisions and which ones only sounded useful because they worked once.
That is where ATSwins can fit into the workflow. It gives you a place to work with data driven sports predictions, player props, betting splits, and performance tracking while keeping the focus on probabilities instead of certainty.
Baseball is always going to have randomness. A perfectly hit ball can find a glove. A weak fly ball can leave the park. A reliever can lose his command for one inning. You cannot remove that variance.
What you can do is build a process that understands it.
For me, that means trusting the numbers while still respecting uncertainty. I want to know why the model likes a matchup, what could make it wrong, and how much of the edge is actually reflected in the price. That mindset keeps the focus on finding better decisions instead of trying to predict every game perfectly.
When the postseason gets tighter, the details matter more. A rested bullpen, one lineup change, a pitch type mismatch, or a small workload adjustment can be enough to change the fair number. The goal is to catch those changes before they become obvious, keep the analysis grounded, and let the model do what it is supposed to do: help turn a complicated matchup into a clearer decision.