Beating MLB betting markets is not about guessing winners. It is about understanding price. Every line you see is just a probability in disguise, and the only way to consistently win is by comparing that implied probability to your own projection. If your number is better, you have value. If not, you pass.
As someone who builds AI-driven projections and tracks betting performance daily, the entire edge comes from discipline and math. This guide walks through how to convert odds into probabilities, remove the vig, build reliable win percentages, and turn all of that into smart bet sizing. Over a long baseball season, that process matters way more than hot streaks or gut feel.
Table Of Contents
- MLB betting probability vs implied odds: turning prices into edges
- Model inputs and calibration for MLB win probabilities
- Comparing probability to implied odds: a repeatable workflow
- Practical example and common pitfalls to avoid
- Tools, templates, and references you will actually use
- Conclusion
- Frequently Asked Questions (FAQs)
MLB betting probability vs implied odds: turning prices into edges
At its core, MLB betting probability vs implied odds is just a comparison between two numbers. One is what the sportsbook says the probability is, and the other is what your model says the probability should be. The difference between those two numbers is your edge.
Sportsbooks build lines that include their margin. That means even accurate prices are slightly inflated. Your job is to strip that margin out and compare the clean probability to your own projection. If your model says a team wins more often than the market suggests, that price is worth betting. If not, it is noise.
The key shift here is mindset. You are not trying to be right about games. You are trying to be right about prices. That sounds small, but it changes everything. Over time, betting good prices leads to profit even if individual results swing wildly.
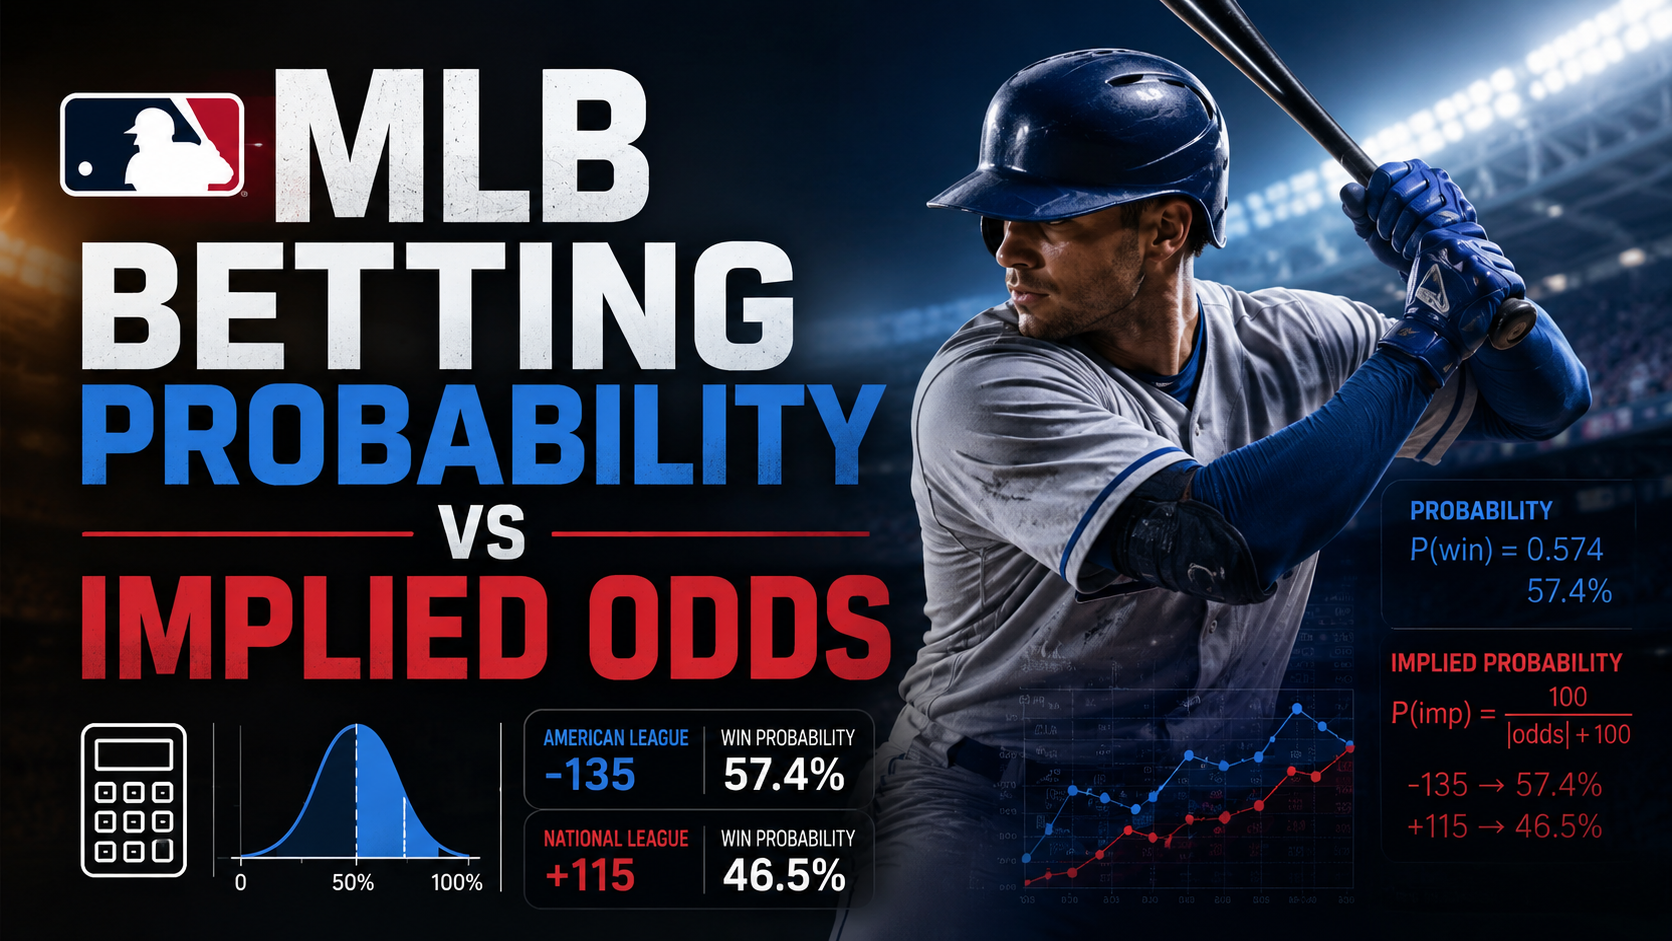
To do this, you need a few simple formulas. Converting American odds into implied probability is step one. For positive odds, divide 100 by the odds plus 100. For negative odds, divide the absolute value by that number plus 100. That gives you the break-even percentage.
From there, you can convert your own probability into fair odds. If your model gives a team a 55 percent chance, the fair decimal price is 1 divided by 0.55. That translates to a slightly better number than what the book might be offering.
Once you understand both sides, you calculate edge. That is simply your probability minus the market’s de-vigged probability. If the difference is meaningful, you have a bet.
Expected value is what matters. If your bets consistently have positive expected value, the results will follow over time. This is the exact approach used by serious bettors and data-driven platforms like ATSwins, where every play is rooted in probability rather than opinion.
Model inputs and calibration for MLB win probabilities
Building a reliable MLB model is not about throwing in every stat you can find. It is about focusing on inputs that actually move win probability.
Starting pitchers are the biggest driver. Strikeout rate, walk rate, pitch mix, and recent workload all matter. A pitcher coming off a high pitch count or short rest is not the same as one fully fresh. Matchups also matter, especially how a pitcher’s arsenal lines up against the opposing lineup.
Bullpens are often underrated but extremely important. Availability changes daily. If a team used three high-leverage relievers the night before, their late-game probability drops. That kind of detail is where edges often come from.
Lineups add another layer. You want to look at projected hitters, not just season averages. Missing a key bat or inserting a weak platoon player can shift probabilities more than people think. For example, checking a current lineup or player performance page like this detailed breakdown on a hitter’s recent form from ESPN player stats page example gives you context beyond raw numbers.
Ballpark and weather are also huge factors. Wind direction alone can change run environments. A strong wind blowing out can increase scoring and shift win probability toward power-heavy teams. You can see how teams perform in different conditions by reviewing updated team trends such as this breakdown of standings and splits on MLB standings and team trends.
Schedule factors matter too. Travel, rest, and game timing all impact performance. A team flying across time zones for an early game is not operating at peak efficiency.
Once you build your model, calibration is critical. If your model says 55 percent, it should actually win around 55 percent over time. That is where backtesting comes in. You simulate past games using only information available before first pitch. This avoids bias and keeps your model honest.
Tracking results is key. Many bettors skip this part, but it is where improvement happens. Reviewing outcomes and comparing them against projections helps refine your process. Looking at game summaries and recaps from sources like CBS Sports MLB game recaps can help identify where your assumptions were off.
A well-calibrated model is not perfect. It just needs to be slightly better than the market. That small edge compounds over hundreds of bets.
Comparing probability to implied odds: a repeatable workflow
The process should be consistent every day. That is how you remove emotion and stay disciplined.
Start by converting sportsbook odds into implied probabilities. This gives you the baseline number you are betting against. Then remove the vig by normalizing both sides so they add up to 100 percent. This step is crucial because raw implied probabilities always include the sportsbook’s margin.
Next, compare your model probability to the de-vigged market number. If your model is higher, you have a positive edge. If it is lower, you stay away.
After that, convert your model probability into a fair price. This helps you understand how far off the current line is. If the sportsbook is offering a better price than your fair number, that is where value exists.
Then comes bet sizing. This is where many bettors fail. Even with an edge, poor sizing can ruin your bankroll. The Kelly Criterion is the standard approach. It tells you how much of your bankroll to risk based on your edge and the odds.
Most bettors use a fractional version of Kelly to reduce volatility. Betting a smaller percentage keeps swings manageable while still capitalizing on value.
Finally, track everything. Closing line value is one of the best indicators of long-term success. If your bets consistently beat the closing line, your process is working.
You can also follow market movement and analysis from reliable sources like Fox Sports MLB odds and betting insights to understand how lines shift throughout the day. This helps with timing your bets and recognizing where the market is moving.
Practical example and common pitfalls to avoid
Let’s walk through a realistic example. Say a team is listed at -120. That implies a probability of about 54.5 percent. After removing the vig, the market might be closer to 53.8 percent.
Your model comes in at 57 percent. That gives you an edge of just over 3 percent. It might not look like much, but that is a strong edge in baseball betting.
You convert your probability into a fair price and get something closer to -135. Since the sportsbook is offering -120, you are getting a better deal than your model suggests. That is a bet.
Now comes sizing. Using a conservative fraction of Kelly, you might risk around 1 to 2 percent of your bankroll. That keeps things stable while still leveraging your edge.
Common mistakes show up quickly in this process. One of the biggest is double counting factors. If your model already accounts for bullpen fatigue, do not manually adjust for it again. That inflates your edge artificially.
Another issue is reacting too heavily to small samples. A hot streak does not necessarily mean a player or team has improved. You need to balance recent performance with long-term data.
Ignoring market movement is also a mistake. If the line shifts significantly after you place a bet, it can indicate new information. Tracking this helps you refine your timing.
For deeper analysis, reading structured breakdowns like this detailed team performance and news coverage from ESPN MLB team news page can give context behind line moves and player updates.
Tools, templates, and references you will actually use
Having the right tools makes this process faster and more consistent. You do not need anything overly complex, just reliable data and a clean workflow.
Statcast data is one of the best resources for understanding player performance. It provides advanced metrics that go beyond traditional stats. You can explore pitch data, exit velocity, and more through resources like MLB Statcast data portal.
Pair that with projection systems and historical data to build a well-rounded model. Then organize everything in a spreadsheet or tracking system where you can log bets, probabilities, and outcomes.
A simple workflow looks like this. First, gather inputs such as starting pitchers, lineups, and weather. Then generate your model probabilities. After that, compare them to current market odds and calculate edges. Finally, size your bets and log everything.
Bankroll management is what keeps you in the game long enough for your edge to matter. Flat betting works for beginners, but scaling with edge through fractional Kelly is more efficient. Just keep your exposure controlled and avoid overcommitting on any single game.
Using ATSwins alongside your own process can help streamline this. It gives you quick access to projections, betting splits, and performance tracking so you can focus on decision-making rather than data collection.
Conclusion
MLB betting probability vs implied odds is the foundation of smart betting. Once you understand how to convert odds into probabilities, remove the vig, and compare those numbers to your own model, everything becomes clearer.
The goal is not perfection. It is consistency. Find small edges, size your bets correctly, and track your results. Over time, that approach compounds into real profit.
ATSwins makes it easier to apply this process by combining AI projections with real-time data and tracking tools. Instead of guessing, you are working with numbers that actually mean something.
Stick to the process, trust the math, and let the long season work in your favor.
Frequently Asked Questions (FAQs)
What does MLB betting probability vs implied odds really mean?
It is the comparison between your projected win probability and the sportsbook’s implied probability. If your number is higher, you have value. That difference is your edge, and it is what drives long-term profitability.
How do I convert American odds into implied probability to compare vs my MLB model?
For positive odds, divide 100 by the odds plus 100. For negative odds, divide the absolute value by that number plus 100. This gives you the break-even percentage. Once you have that, compare it directly to your model’s probability to identify value.
Why remove the vig when using MLB betting probability vs implied odds, and how?
Sportsbooks include a margin in their odds, which inflates implied probabilities. To remove it, convert both sides into probabilities, add them together, and divide each by the total. This gives you a fair probability that you can compare to your model.
How can ATSwins.ai help me apply MLB betting probability vs implied odds, day to day?
ATSwins is built to simplify the entire process. It provides AI-driven projections, betting splits, and tracking tools so you can quickly identify edges and monitor performance. Instead of manually gathering data, you can focus on making informed decisions based on real probabilities.
Common mistakes when comparing MLB betting probability vs implied odds?
The most common mistakes include forgetting to remove the vig, overreacting to small sample sizes, double counting variables, and betting too aggressively. Another major issue is not tracking results. Without data, you cannot improve your model or your decision-making process.