

Understanding Fair Value in NFL Player Props
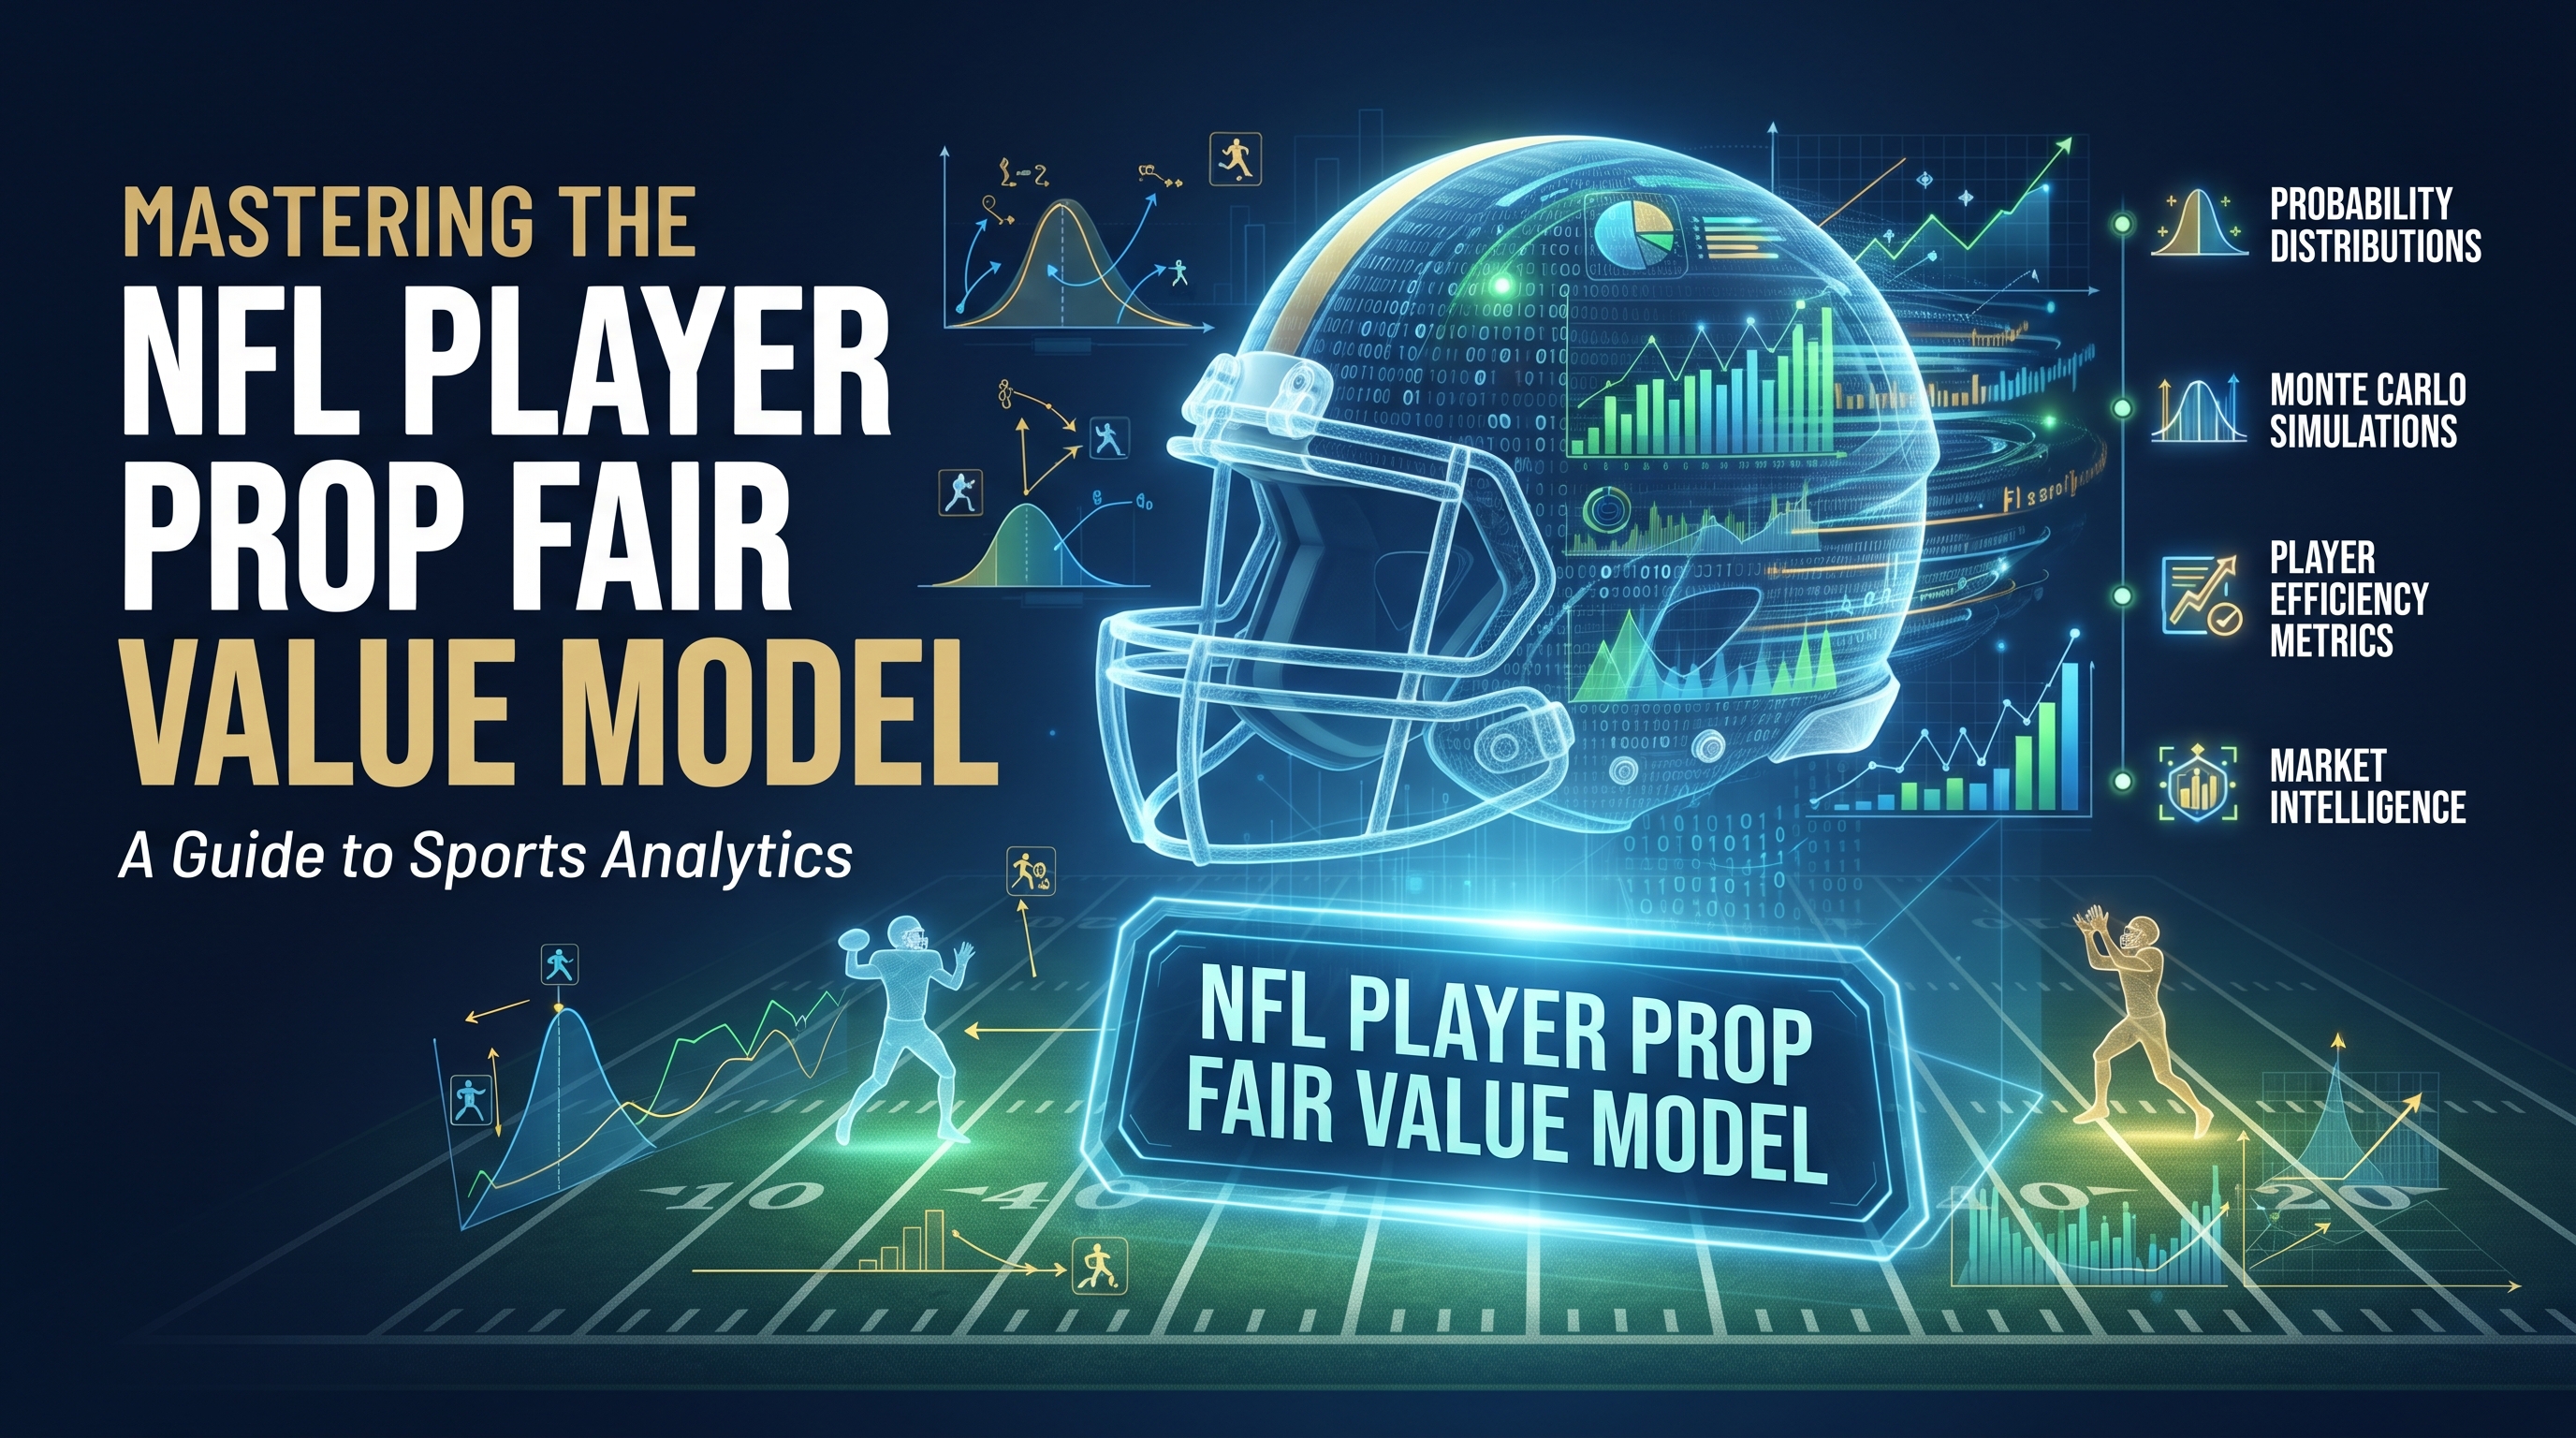
When football fans and data enthusiasts look at weekly matchups, the conversation usually centers around who is going to win or lose. But for anyone diving deep into sports analytics, the real fascination lies in the micro-market of individual player performance. Building a reliable nfl player prop fair value model is about stripping away the noise of casual hype and getting down to the mathematical brass tacks of what an athlete is actually expected to accomplish on any given Sunday. Instead of guessing whether a star wide receiver will clear his yardage total, a quantitative approach looks at distribution curves, historical snap counts, defensive tendencies, and pacing metrics to establish a true baseline probability. This baseline is what we call fair value.
At ATSwins, we spend a lot of time looking at how these numbers interact with the broader market. When you scan the board for a running back rushing yards line or a quarterback passing touchdown prop, you are seeing a price set by oddsmakers who balance sharp action, public bias, and risk management. A proper modeling framework does not care about your gut feeling or whether a player is due for a big game. It calculates the median outcome across thousands of simulated game scripts and turns that output into a probability percentage. If a sportsbook implies a fifty percent chance for an over outcome, but your statistical engine pegs the true probability significantly higher, you have identified a discrepancy worth noting. That gap between the market price and your calculated fair value forms the bedrock of modern sports analytics.
How the Modeling Process Actually Works
Creating a robust forecasting framework requires moving far beyond basic box scores. If you only look at a player's season averages, you are missing the context of game script, opponent strength, and situational usage. A comprehensive nfl player prop fair value model starts by breaking down individual player metrics into granular rate statistics. For instance, evaluating a pass catcher means looking at targets per route run rather than just total targets, because a team that runs a slow, run-heavy offense will naturally limit total opportunities compared to a pass-happy spread scheme.
Once you isolate these efficiency metrics, the next step involves simulation. Rather than spitting out a single static prediction, like saying a quarterback will throw for exactly 265.5 yards, sophisticated platforms run Monte Carlo simulations for the entire contest. By simulating the game thousands of times under varying conditions, the model generates a full distribution of possible outcomes. This distribution tells you not just the most likely median yardage, but the probability of outliers, such as a multi-touchdown game or an early blowout that forces a team to abandon the passing game entirely. This probabilistic output is infinitely more useful than a flat projection because football is inherently volatile, and understanding the range of outcomes is just as important as knowing the average. Powered by an advanced AI sports betting probability model, these simulations can quickly adapt to last-minute roster adjustments and sudden shifts in market pricing.
Key Inputs That Drive Accurate Projections
Garbage in equals garbage out is the golden rule of any data science project, and sports forecasting is no exception. To make a nfl player prop fair value model functional, you need to feed it clean, contextual data streams that capture the modern game. Traditional stats like total tackles or raw rushing yards are often misleading without context. Instead, analysts rely on advanced tracking data, snap share percentages, red zone utilization rates, and adjusted line yards for offensive fronts.
Consider how defensive matchups dictate tight end production. If a defense ranks near the bottom of the league in success rate against slot receivers, that data point needs to carry heavy weight when projecting receptions for a pass-catching tight end. Similarly, pace of play and neutral script passing rates dictate total volume. A team that operates at a lightning-fast tempo with a high pass rate will naturally inflate the opportunity pool for its skill-position players. Factoring in these pace adjustments ensures that your projections do not get blinded by raw totals compiled against weak or overly generous opponents.
Translating Projections into Probability
The core challenge in sports modeling is converting a projected statistical output into an implied probability that can be compared against market prices. If a running back's median projection in a fair value framework is 71.5 rushing yards, that does not mean he will hit that exact number. In fact, due to variance, he might finish with 45 yards one week and 110 the next. This is where statistical distributions come into play, most commonly the Poisson distribution for count stats like receptions or touchdowns, and normal or log-normal distributions for continuous stats like passing or rushing yards.
By applying these mathematical distributions to the player's projected baseline, you can calculate the exact percentage chance that a player exceeds a specific sportsbook line. If the math shows a 58% probability for a receiver to go over 4.5 receptions, you can compare that figure directly against the price offered by the market. This translation from raw numbers to clean percentages is what separates casual fandom from rigorous analytical evaluation. It allows you to view every game through the lens of expected value and long-term probability rather than short-term emotional swings, leveraging comprehensive sports betting market intelligence to find where odds diverge from reality.
Recognizing Common Pitfalls in Prop Modeling
Even the most sophisticated statistical frameworks can run into trouble if the builders do not account for hidden variables and real-world friction. One of the most common mistakes in prop modeling is failing to account for correlated events and cascading injuries. For example, if a team's starting left tackle is ruled out late in the week, it does not just affect the offensive line grade; it fundamentally alters the pass protection time, which ripples down to the quarterback's completion percentage and the wide receiver's downfield opportunities.
Another major trap is overfitting historical data. It is easy to build a model that looks incredible when backtested against the previous three seasons, only for it to fail miserably in the current environment because coaching staffs changed their offensive philosophies or rule interpretations shifted. Furthermore, small sample sizes early in the NFL season create massive noise. Relying too heavily on performance data from September can lead to skewed projections that ignore a player's multi-year career baseline. Maintaining a healthy balance between recent form and historical priors is essential for keeping any forecasting engine honest and reliable.
Applying Analytical Discipline Over the Long Term
Success in sports analytics is measured over hundreds or thousands of iterations, never over a single weekend. The greatest advantage of utilizing a systematic approach is that it removes emotional decision-making from the equation. When you trust the math behind your calculations, you accept that variance will cause short-term fluctuations, but disciplined probability management will prevail over the course of a full 18-week NFL season.
Whether you are evaluating rookie breakout candidates, tracking veteran regression, or analyzing how weather conditions in late December impact passing volume, the key is consistency. At ATSwins, our focus remains squarely on refining data inputs, improving simulation mechanics, and maintaining strict analytical integrity through our proprietary sports probability engine. By respecting the uncertainty inherent in professional sports and relying on rigorous probability models, you can cut through the noise, evaluate markets objectively, and truly understand the underlying value of every player prop on the board.