

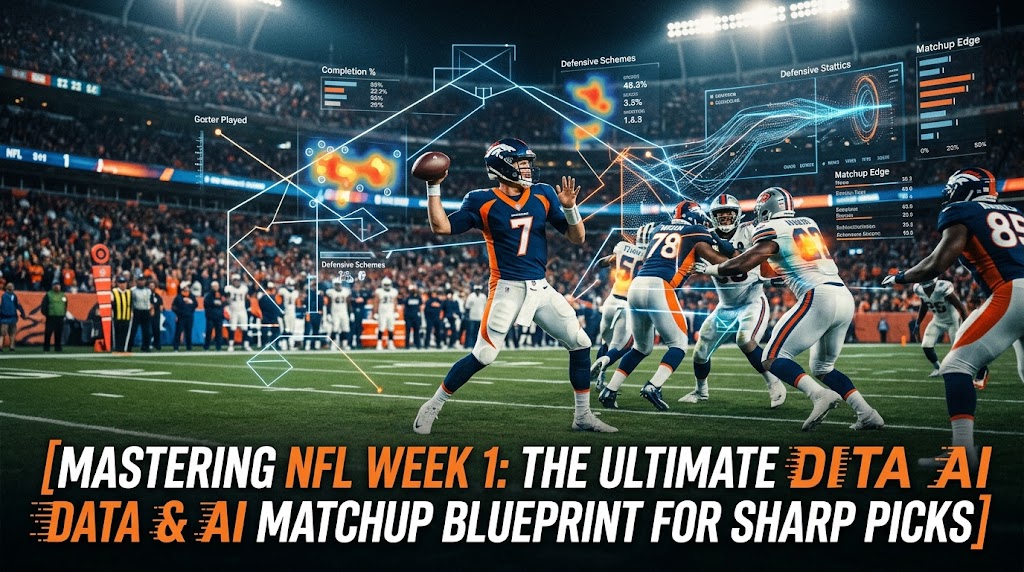
Week 1 brings clean slates, sharp lines, and plenty of overreactions. I am a sports analyst who leans on data and AI to separate noise from signal by tracking trenches, tempo, travel, weather, and injuries. We will translate numbers into matchups you can trust, blending tape with models and trusted metrics so you are completely ready before kickoff.
Table Of Contents
Key Takeaways
Context comes first, always. Trenches, protection, and early-down intent shape everything that happens on the field. If pressure wins, the offense usually loses. You need to track injuries and snap ramps late in the week, as soft-tissue risk is very real. Confirm statuses on the morning of the game and never make lazy assumptions. Weather and travel move outcomes drastically. Wind above fifteen miles per hour kills deep shots, domes lift overall pace, and cross-country early kicks sap team execution. Keep a steady workflow by using last season priors plus preseason usage, weighting offensive line and defensive back continuity, and then layering schedule, injuries, and weather in a simple, repeatable process. ATSwins is an AI-powered sports prediction platform offering data-driven picks, player props, betting splits, and profit tracking across NFL, NBA, MLB, NHL, and NCAA. Free and paid plans give bettors insights to make smarter, more informed decisions every single week.
Week 1 context and schedule snapshot
Kickoff timing and windows
Week 1 is unique because there are no byes, rosters are fresh, and full prep calendars only get squeezed by travel and media windows. The slate is arranged across a Thursday night Kickoff with a national spotlight and extra prep for one team heading into Week 2, Sunday early and late windows where the bulk of games reside and most cross-market line moves land, Sunday Night Football as an island game that often inflates public interest and prop volume, and Monday Night Football as a single game or doubleheader.
Because teams are at full strength and expectations are anchored to offseason narratives, early lines can swing more on news and schedule quirks than midseason numbers. Block off thirty minutes to log the official schedule and tag each game with its specific window. That simple labeling improves your prep-cycle model inputs and your understanding of rest asymmetry for Week 2.
Travel pairings and rest
Most Week 1 matchups are not on short rest, but travel still matters a ton. Cross-country flights with early Sunday kickoffs can hit body clock performance, especially for offenses leaning heavily on timing routes. Teams coming from high heat or humidity into cooler stadiums, or the reverse, can show conditioning gaps late in halves. Pairings that match a high-tempo team versus a ball-control team can mask fatigue in the aggregate but still change late-game ATS outcomes as one unit tires out.
You should add specific travel flags to each game on your slate. Note the time-zone delta, body-clock slot, flight length estimate, and days before the next game.
Marquee spots and TV leverage
National windows like Thursday, Sunday, and Monday night pull extra prep time from both coaching rooms and your personal process. You will see more scripted plays early, more aggressive fourth-down decisions, and a higher chance of trick looks on special teams. Prop markets also move much earlier for these standouts. Record an initial-odds snapshot at open and again twenty-four hours before kickoff.
When you note headline matchups, tag each as an island or cluster game. We do this to standardize our ATS model priors on tempo and substitution patterns under bright lights.
Why we trust primary sources right now
Stick strictly to primary data for Week 1, including official schedules, verified injury portals, tracking stats, historical reference sites, and the official weather service. No hearsay, no rumor-chasing on social media. Week 1 is noisy, so treat every data point you can verify as pure gold and everything else as mere narrative.
Bookmark historical reference sites for baselines like success rate, expected points added per play, early-down pass rate, and pace. Use tracking metrics for separation, route charts, time-to-throw, and pressure-to-sack conversions. Validate injuries only from official injury portals and team reports.
Matchup edges and scheme fit
Trenches first: OL vs EDGE pressure rates
Start with pressure because it changes everything, including accuracy, average depth of target, turnover-worthy plays, and overall drive outcomes. Build a rolling offensive line versus edge rusher pressure matrix incorporating pass-block win rate, quick-loss rate, and pressure-to-sack ratios. Cross-check past data with preseason snaps to confirm any glaring changes like rookie tackles, guard-center communication issues, or a new left tackle pushing a veteran to the right.
Tag protection schemes like full slide, half slide, or man-protection from coach interviews and beat reports. Corroborate this with tracking data on time-to-throw and heat maps. If your model flags an edge mismatch where a top pass rush faces a bottom pass block and the offense leans on deeper-developing concepts, cap the offense explosive pass rate baseline by ten to fifteen percent for Week 1 until proof of concept arrives.
Set offense pass protection grades from A to D based on pass-block win rate, continuity, and time to throw. Set defense rush grades from A to D based on pressure rate, stunt success, and blitz-to-pressure efficiency. Create a net-pressure differential by subtracting the offense pass protection grade from the defense rush grade. Anything plus or minus two or more is highly actionable.
Run-game gap vs zone tendencies
Most teams mix gap and zone, but specific tendencies matter against specific defensive fronts. Zone versus even fronts with speed linebackers tends to shift outcomes to perimeter runs and cutbacks, while fumbles rise with backside pursuit in Week 1 when timing is rusty. Gap versus light boxes can produce explosive runs if safeties sit in two-high shells and edges do not squeeze. Watch for duo concepts against teams that lack interior gap integrity.
Pull historical rush rates by concept from film notes and public charting, then weight them by continuity in the offensive line and running back rooms. If a team changed their offensive line coach or scheme coordinator, downgrade early efficiency by five to ten percent until real regular season data confirms execution.
Run quick checks on short-yardage power success rate baselines versus an opponent stuff rate. Look at run-stop win rates against teams that outsize you on the interior. Finally, check running back target shares versus man and zone splits, as zone defenses often concede more flat and hook targets to backs.
WR vs CB leverage: press vs off and TE seams
Coverage leverage is where ATS edges often hide during Week 1. Press versus off coverage tendencies can swing top receiver outcomes by multiple targets. Teams installing new cornerbacks or converting a slot defender to the boundary may show communication issues versus bunch stacks and motion at the snap. Tight end seam usage spikes in Week 1, especially off play-action against linebacker rooms with new green-dot communicators.
Use tracking stats for separation and route charts, and pair them with target depth and success rate data. Identify wideouts who beat press through a strong release package and hand fighting versus those who prefer free access. If opponent corners play heavy press, bump contested catch targets but drop yards-after-catch expectations. Against off or zone shells, favor precise route-runners and inside leverage slot receivers. Tight end seam shots thrive if safeties rotate late post-snap.
Heavy press with single-high coverage benefits physical X receivers and back-shoulder experts running go routes, back-shoulders, and slants, leading to slightly lower YAC but stable EPA via contested wins. Off or zone coverage with cushion benefits route craftsmen and slot separators running digs, outs, options, and hooks, yielding a higher success rate and steady chains. Two-high quarters shells benefit athletic tight ends and seam-stretchers running seams, benders, and play-action crossers, creating chunk plays if defenders miscommunicate. Man-heavy blitz looks benefit speed receivers and running back hot-reads on slants, quick outs, and angle routes, resulting in fewer air yards but similar EPA via YAC.
New coordinators and play-callers impacting pace
Week 1 is when coordinator fingerprints truly show up. A new offensive coordinator with motion-at-snap habits often lifts early-down pass rates and quick concepts like RPOs and bubbles to get easy yards. New defensive coordinators can toggle simulated pressures and creepers to present five-man looks without losing coverage defenders.
Your model should apply a coordinator uncertainty tax of plus or minus three to five percent on pace and pass rate if the scheme is materially new. You should also cap explosive plays allowed or created until we see at least two full games of small-sample caution.
Scripted-play efficiency
Offenses script ten to twenty plays to open the game, and Week 1 scripts are often more extensive, creating early scoring spurts. Track first fifteen play success rates from past seasons and preseason action. If an offensive coordinator is known for heavy scripting and first-drive aggression, lift your first quarter total projections slightly. If you prefer live betting, note teams with stark splits between scripted and unscripted drives because halftime adjustments can flip ATS edges.
How to pull and merge tracking and reference data fast
First, export or log receiver separation, quarterback time-to-throw, pressure-to-sack conversions, and route heat maps from tracking databases. Second, pull team EPA per play, success rate, early-down pass rate, and seconds per play pace from reference databases. Third, build a player-level key listing team, player, position, and role. Fourth, set rolling baselines by weighting last season at seventy percent, preseason usage at twenty percent, and career priors at ten percent for veterans. Rookies should use preseason at sixty percent, draft capital at twenty percent, and college role at twenty percent. Fifth, create matchup flags for press-heavy versus off-heavy looks, two-high share, blitz rate, and coverage bust rate approximations. Sixth, calculate net effect scores for line play, receiver leverage, tight end seams, and missed tackle rates. Seventh, write out a one-line summary per matchup with these scores and keep it consistent for every game on the slate.
Keep each step lightweight so you can re-run it smoothly once Friday practice reports lock in.
Player availability and injuries
Status tiers matter more in Week 1
Use official injury reports daily and label players carefully. Out players mean planning for zero snaps, bumping backups, and shifting formation usage. Doubtful players should be treated as out for projections, and if active, capped at ten to fifteen snaps unless historical data proves otherwise. Questionable players require creating two projections for active and inactive states, weighted seventy-thirty based on beat reports and late-week practice logs. Rookie healthy scratch risks carry no official tag, so project them as rotational unless camp usage explicitly indicated otherwise.
Soft-tissue risk is highest in Week 1. If a skill player carries a hamstring or groin label, reduce their full-sprint route share and cap their snap rate by five to fifteen percent. For running backs with limited camp time, assume a short leash in pass protection if a veteran backup is available.
Snap ramp expectations for rookies and returning vets
Rookies flagged as first-rounders generally get faster onboarding, but they remain subject to package limits. Expect sixty to seventy-five percent snaps for rookie starters and twenty to forty percent for rotational roles. Second-year players who changed position coaches may experience a slower early ramp while technique locks in. Returning veterans coming off IR should be capped at sixty to seventy percent early unless camp showed a full green light, because Week 1 adrenaline does not prevent physical fatigue.
Use two projections when uncertain, one with full snaps and one with a conservative ramp. Blend them based on practice participation from official team logs.
Special teams depth that quietly swings field position
Special teams matter immensely in Week 1. New kickers playing on grass with wind risk lift missed field goal probabilities by two to three percent if crosswinds exceed twelve to fifteen miles per hour. Punter hang-time and coverage lane discipline can flip short fields, while rookies and late camp cuts can create blown coverage assignments. When a starting defensive back or running back doubles on special teams, track snap fatigue because late-game coverage penalties rise in Week 1 with gassed depth charts.
How to build an injury impact column quick
Create columns for player, team, role, status, projected snaps, replacement grade, unit sensitivity, and net impact scaled from minus three to plus three. As a rule of thumb, an elite tackle or corner being out creates a net impact of minus two to minus three. A secondary wideout or primary tight end in target-concentrated offenses sitting out brings a minus one to minus two impact. Rotational linemen sitting out brings a minus zero point five impact unless unit depth is paper-thin.
Sum the net impact at the unit level across offense skill, offensive line, front seven, and secondary. Convert this to a spread delta of roughly zero point three to zero point five points per unit swing, capped at one point five total points for Week 1.
Conditions, travel and environment
Outdoor vs dome effects on aDOT and totals
Dome games in Week 1 often boost passing efficiency and reduce overall variance. Average depth of target holds closer to design with fewer wind-driven inaccuracies, and kicking conditions remain completely stable. You will find marginal edges on overs if defenses are entirely new. On turf versus grass, turf supports sharper cuts and can boost quick-game YAC, but some players coming off lower-body injuries may be limited by team discretion.
Wind thresholds and precipitation
Use official local stadium forecasts for accuracy. Wind between ten and fourteen miles per hour has a mild pass impact, dropping deep ball completions a tick and pushing kickers slightly. Wind between fifteen and twenty miles per hour creates a material impact, capping average depth of target by half a yard to a full yard, lowering explosive pass rates, and favoring live unders if pregame warmups show strong gusts. Wind over twenty miles per hour hits passing dramatically, driving up under plays and running back carry shares.
Steady rain leads to fewer explosives and higher early fumbles, though sticky gloves can normalize play after a couple of series. Heat and high humidity increase late-half fatigue, boosting secondary running back snaps and defensive missed tackles. Consider live overs if both offenses handle heat at a fast pace.
Dome environments provide a slight pass boost, stable kicking, and average depth of target near original plans. Wind from fifteen to twenty miles per hour reduces average depth of target, drops long field goal make rates by three to five percent, and signals running back prop opportunities. Heavy rain leads to more rush attempts, lower explosive plays, snap or hold risks, and early fumble upticks. Heat index values over ninety cause pace volatility, late-game fatigue, and extra snaps for backup running backs.
Cross-country flights and body-clock slots
West Coast teams playing at early East Coast kickoffs experience a slight offensive timing penalty, especially in the first quarter. Scripted plays help reduce this, but the drive finish rate can lag. East Coast teams playing late on West Coast turf can see conditioning dip in the second half if summer camp conditioning was not ideal. Always create binary flags for cross-country travel, body-clock disadvantages, and environmental stress.
How to log and use forecasts
First, pull the stadium city forecast from the national weather service. Second, record steady wind, gusts, temperature, and precipitation chances at twenty-four, forty-eight, and six hours pregame. Third, adjust offense and defense efficiency dials by small, consistent increments, such as dropping pass efficiency by two percent per five miles per hour over fifteen, reducing explosive pass rates by ten percent in heavy sustained rain, and increasing running back carry shares by five percent in high wind or rain. Fourth, note surface types and kicker historical splits. Fifth, re-check ninety minutes pregame when inactives post, updating props and totals first, followed by ATS lines if thresholds are crossed.
Modeling workflow and checks
Baseline prior from previous season plus preseason usage
Your Week 1 model should act like a bridge. Give sixty to seventy percent weight to previous season team performance, twenty to thirty percent to preseason usage and camp reports, and a ten to twenty percent overlay for coordinator and roster continuity. For veteran players, weight last year at seventy percent, preseason at twenty percent, and career baselines at ten percent. For rookies, weight preseason at sixty percent and draft capital plus college role at forty percent. This weighting holds until three weeks of current season data are logged.
Weight continuity on OL and DB rooms
Continuity is king in Week 1. For the offensive line, assign a continuity score based on returning starters and positional stability. Each missing starter acts as a minus zero point five penalty to pass and block efficiency until proven otherwise. For the defensive back room, evaluate returning boundary and nickel corners alongside safeties. Communication gaps severely punish single-high rotations and seam coverage, so penalize explosive pass prevention if more than one new starter enters the secondary.
Adjust for coordinator changes
Create coordinator deltas for new play-callers. A new offensive coordinator adjusts early-down pass rates by plus or minus three to seven percent, motion-at-snap by five to ten percent, and pace by two to five percent. A new defensive coordinator alters blitz rates by five to ten percent while shifting simulated pressure usage and coverage shell diversity. Penalize early misfits against motion-heavy offenses. Attach a high confidence tag if the coach track record is long and matches personnel, or a low confidence tag if scheme mismatch risk is elevated.
Small-sample caution flags
Do not overfit to preseason vanilla looks because many teams hide motion and tempo. Star rookies can hit a usage wall in Week 1 if the game plan prioritizes pass protection and ball security. If you cannot verify a data point, do not add it to your model. Keep priors modest and re-rate team performance live.
Simple template: merge schedule, injuries, and weather
Set up a working sheet with one row per game logging game ID, window, body-clock disadvantage, travel category, stadium type, surface, and weather forecasts. Include offensive line and defensive back continuity scores, coordinator change indicators, pace deltas, line mismatch ratings, and unit injury net impacts. Combine baseline team EPA with weighted adjustments to project total pace, average depth of target, explosive rates, model spreads, and totals. This template forces discipline and helps you explain edges when variance hits during Week 1.
Validate against Week 1 volatility
Historical Week 1 variance is real, featuring more broken plays, special teams swings, and unrefined substitution patterns. Cap any single unit adjustment to plus or minus ten to twelve percent for Week 1 unless multiple verified flags stack together. If your model edge depends heavily on unverified rookie usage, halve your stake or pivot to derivative markets like player props or alt totals after inactives release.
How to translate to ATS decisions
For spread bets, fire only when your model edge over the market spread is at least one point five to two full points and can be defended with three or more independent flags. For totals, look for conflicting market narratives. For derivatives, target first-half unders in windy outdoor games with new play-callers, or first-quarter overs for script-heavy coordinators in domes. For props, leverage receiver coverage mismatches and tight end seams against new safeties while fading long field goal props in heavy crosswinds.
Example: quick-turn process for one game
Consider a Sunday early window game played outdoors on grass. The forecast shows sixteen mile per hour winds with gusts to twenty-two. The offensive line returns three of five starters against an elite opposing rush grade, creating a net-pressure differential of minus two. The opposing defense plays off-zone coverage, giving the slot receiver a plus one leverage mark. The left tackle is questionable while the secondary cornerback is out, resulting in net unit impacts of minus one point five for the offense line and minus one for the defense secondary. The model lowers average depth of target, increases running back carries, shifts target share to the slot, and uncovers strong edges on the first-half under and slot receiver receptions over.
Data sources and how we cite them
Always anchor your analysis to primary sources including official schedule releases, official injury listings, tracking portal separation metrics, reference database team baselines, and national weather service forecasts. We prioritize primary sources because secondary reporting during Week 1 can lag severely and rumor mills run wild. Treat unverified claims as low confidence.
Checks before bet placement
Confirm injuries ninety minutes pregame on the official injury portal and re-run weather forecasts. Reconcile line play mismatches using the latest depth charts, re-grading if a swing tackle is inactive. Compare your model number against current lines to ensure your edge survives recent point movement, and choose the specific market that best reflects your core edge.
Tools, templates, and how-to workflows
Core tools list
Your core toolkit requires official schedule listings, official injury portals, tracking data for route maps, historical reference splits, weather forecasts, and ATSwins for pick tracking, betting splits, and profit logs.
One-hour matchup audit
Spend minutes zero to ten logging the schedule window, stadium type, surface, and travel flags. Spend minutes ten to twenty pulling weather forecasts and recording wind, temp, and precipitation probabilities. Spend minutes twenty to thirty auditing injuries, projecting snaps, and building unit net impact scores. Spend minutes thirty to forty-five rating line play differentials, receiver leverage, and tight end seam matchups. Spend minutes forty-five to fifty-five analyzing coordinator changes, scripted play quality, and preseason usage. Spend the final five minutes creating model deltas for pace, depth of target, explosives, and pressure before comparing your final numbers to market lines.
If your edge is thin at under one point five points or hinges on multiple questionable injury tags, reduce your risk or wait for live entries.
Building a simple ATS model in a spreadsheet
Set up columns for team offense and defense baseline EPA, sec-per-play pace, early-down pass rates, line continuity scores, coordinator adjustments, weather factors, injury net impacts, and specific matchup edge ratings. Use formulas to calculate pace-adjusted plays, explosive rate adjustments, and overall team strength. Deriving model spreads and totals from these inputs provides an objective benchmark. Document your assumptions next to every formula so you understand exactly why a number moved.
How to turn model output into bets
Rank edges by size and confidence. Confidence is higher when multiple independent flags support the same direction, coordinator and line continuity are stable, and injury statuses are unambiguous. Stake zero point two five to zero point five units for smaller Week 1 edges, and reserve zero point seven five to a full unit for spots where three or more verified factors align perfectly. Track entry times, lines, stakes, and short reason codes using a transparent tracker with ROI and closing line value metrics. A central hub like ATSwins keeps your pick histories, market splits, and profitability organized in one spot.
Putting the edges together on a few archetypal matchups
Archetype 1: Elite pass rush vs shaky OL, outdoor wind 15–18 mph
This setup creates expectations for a lower average depth of target, higher pressure rates, and a reliance on the quick passing game. Bets to consider include full game unders, first-half unders, running back carries over, and quarterback rushing attempts over via scrambles. The main risk is defensive fatigue if the offense runs a fast tempo, which you can mitigate with live entries after observing the first two drives.
Archetype 2: Dome game, new OC with motion and tempo, healthy WR room vs off-zone defense
This environment drives elevated first-half scoring, heavy slot and tight end success, and steady movement of the chains. Bets to consider include first-half overs, receiver and tight end reception overs, and team total overs. The primary risks involve pre-snap penalties or early turnovers, so keep stakes modest to handle Week 1 variance.
Archetype 3: Outdoor heat and humidity, both teams with RB depth, new DC on one side
This spot yields late-half explosive runs against tired defenses and frequent substitution shuffles. Bets to consider include second-half overs in-game if early pace is modest but yards per carry is rising, as well as secondary running back rushing attempts over. Red-zone stalls represent the main risk if the offensive line cannot generate a push, so consider alt overs with reduced stakes.
Archetype 4: Island game (SNF/MNF), new DC with disguise packages vs young QB
Expect early confusion, multiple sacks, and potential turnover-worthy plays. Bets to consider include first turnover props on the young quarterback, opponent defensive sack overs, and first-half unders. The risk is that the quarterback run game counters the pressure, so watch the first drive carefully for designed keepers.
Step-by-step: WR/CB and TE/LB seam modeling
WR/CB
First, identify corner styles regarding press or off coverage, shadowing habits, and safety help tendencies. Second, chart receiver route families across vertical, in-breaking, out-breaking, and option routes. Third, rate release packages as elite, functional, or limited using prior tracking separation numbers. Fourth, assign leverage by noting that top receivers facing press see higher contested target shares and lower YAC, slot receivers facing off coverage see higher targets and success rates, and secondary receivers facing shadow corners see volume drops. Fifth, convert leverage ratings into target and yards-per-route-run deltas, where plus one leverage adds zero point five to one full target and zero point one to zero point two YPRR.
TE/LB seams
Check opponent safety rotations between two-high looks and post-snap single-high shifts. Chart tight end seam and bender usage from past seasons and confirm preseason involvement. If the linebacker coverage grade is thin and safeties are new, add seam shots to your projection. Plus one seam leverage adds zero point three to zero point five targets ten or more yards downfield, and bumps red-zone touchdown probability slightly if the tight end possesses elite size and contested catch ability.
Quick-hit checklists you can reuse
Pre-bet ATS checklist for Week 1
Confirm if your model edge over the market line is at least one point five to two full points. Verify all injuries through official portals and check if weather thresholds are crossed via national weather forecasts. Ensure line play differentials are plus or minus two or more, receiver leverage is backed by tracking separation metrics, coordinator changes carry an uncertainty tax, and travel or body-clock disadvantages are properly flagged. Skip the bet or reduce exposure if fewer than three boxes are checked.
Prop checklist
Verify that role clarity is locked with snap projections within ten percent. Confirm that coverage leverage favors your player route family and that weather conditions support overall passing accuracy. Ensure target competition will not unexpectedly spike due to rookie surprises or returning veterans.
Live-bet checklist
Monitor whether game pace is matching pregame expectations and if pass pressure aligns with your line play reads. Track whether weather conditions are holding steady or worsening, and observe whether in-game injuries to corners or tackles have shifted live leverage.
Using ATSwins to sharpen Week 1
Week 1 is when you want fewer subjective opinions and far more verifiable receipts. Keep a rolling ledger of your model numbers, market lines at open and close, and your exact entry prices. Record reason codes for every pick tied to your template flags, tracking profit, closing line value, and volume across spreads, totals, and props. A consolidated platform like ATSwins keeps these tracking metrics organized, allowing you to compare your reads against broader betting splits and monitor overall seasonal performance. This makes auditing your Week 1 assumptions effortless so you can upgrade your model using real scheme tape for Weeks 2 and 3.
Final reminders for Week 1 modeling
Never chase media narratives. Anchor your process firmly to primary sources like official schedules, injury reports, tracking portals, reference databases, and official weather forecasts. Weight offensive line and defensive back continuity much heavier than the public does. Keep your model deltas modest and cap extreme opinions until fresh regular season data arrives. Favor derivative markets like first-half lines or props when edges are highly specific. Document everything you do, because detailed tracking allows your numbers to beat the market consistently as the season moves forward.
Conclusion
Week 1 is all about turning clean slates into actionable edges by evaluating trenches, pressure, tempo, injuries, and weather. The biggest keys are trusting line and secondary continuity, monitoring new coordinators, and respecting environmental wind. Blend structured data with situational context, verify every report, and price the market before placing a pick. For sharper moves all year, ATSwins is an AI-powered sports prediction platform delivering data-driven picks, player props, betting splits, and profit tracking across NFL, NBA, MLB, NHL, and NCAA. Free and paid plans give sports bettors the exact guides and insights needed to make smarter decisions, so start today.
Frequently Asked Questions (FAQs)
What is NFL Week 1 matchup analysis, and why does it matter before kickoff?
NFL Week 1 matchup analysis is the detailed process of sizing up how two teams match up across schemes, personnel, and situations before any fresh regular season film exists. It matters because opening lines are often slow to price new coordinator tactics, offensive line continuity issues, rookie snap ramps, and environmental factors like travel or wind. I focus heavily on the trenches first by evaluating pass protection and edge pressure rates, coverage rules against receiver skill sets, early-down pass rates, and special teams units. Use official schedule pages to map rest and travel, check verified injury reports to confirm active statuses, and pair that with tracking data to measure separation and speed. Done correctly, NFL Week 1 matchup analysis uncovers key edges that the market misses during the opening weeks.
Which stats should I trust most for NFL Week 1 matchup analysis?
Focus on stable, high-impact metrics. Track protection and pressure via pass-block win rates and pressure rates allowed versus opponent rush success, which establishes the quarterback baseline performance. Evaluate coverage and separation by looking at man versus zone usage rates alongside receiver separation metrics. Look at early-down pass rates and play-action frequency because they dictate overall pace and explosive potential. Set efficiency baselines using past season expected points added per play and success rates, adjusting for coordinator or personnel changes using historical reference databases. Finally, account for hidden yards in field position and special teams errors. When metrics conflict, always weight line play and quarterback health heaviest in your analysis.