

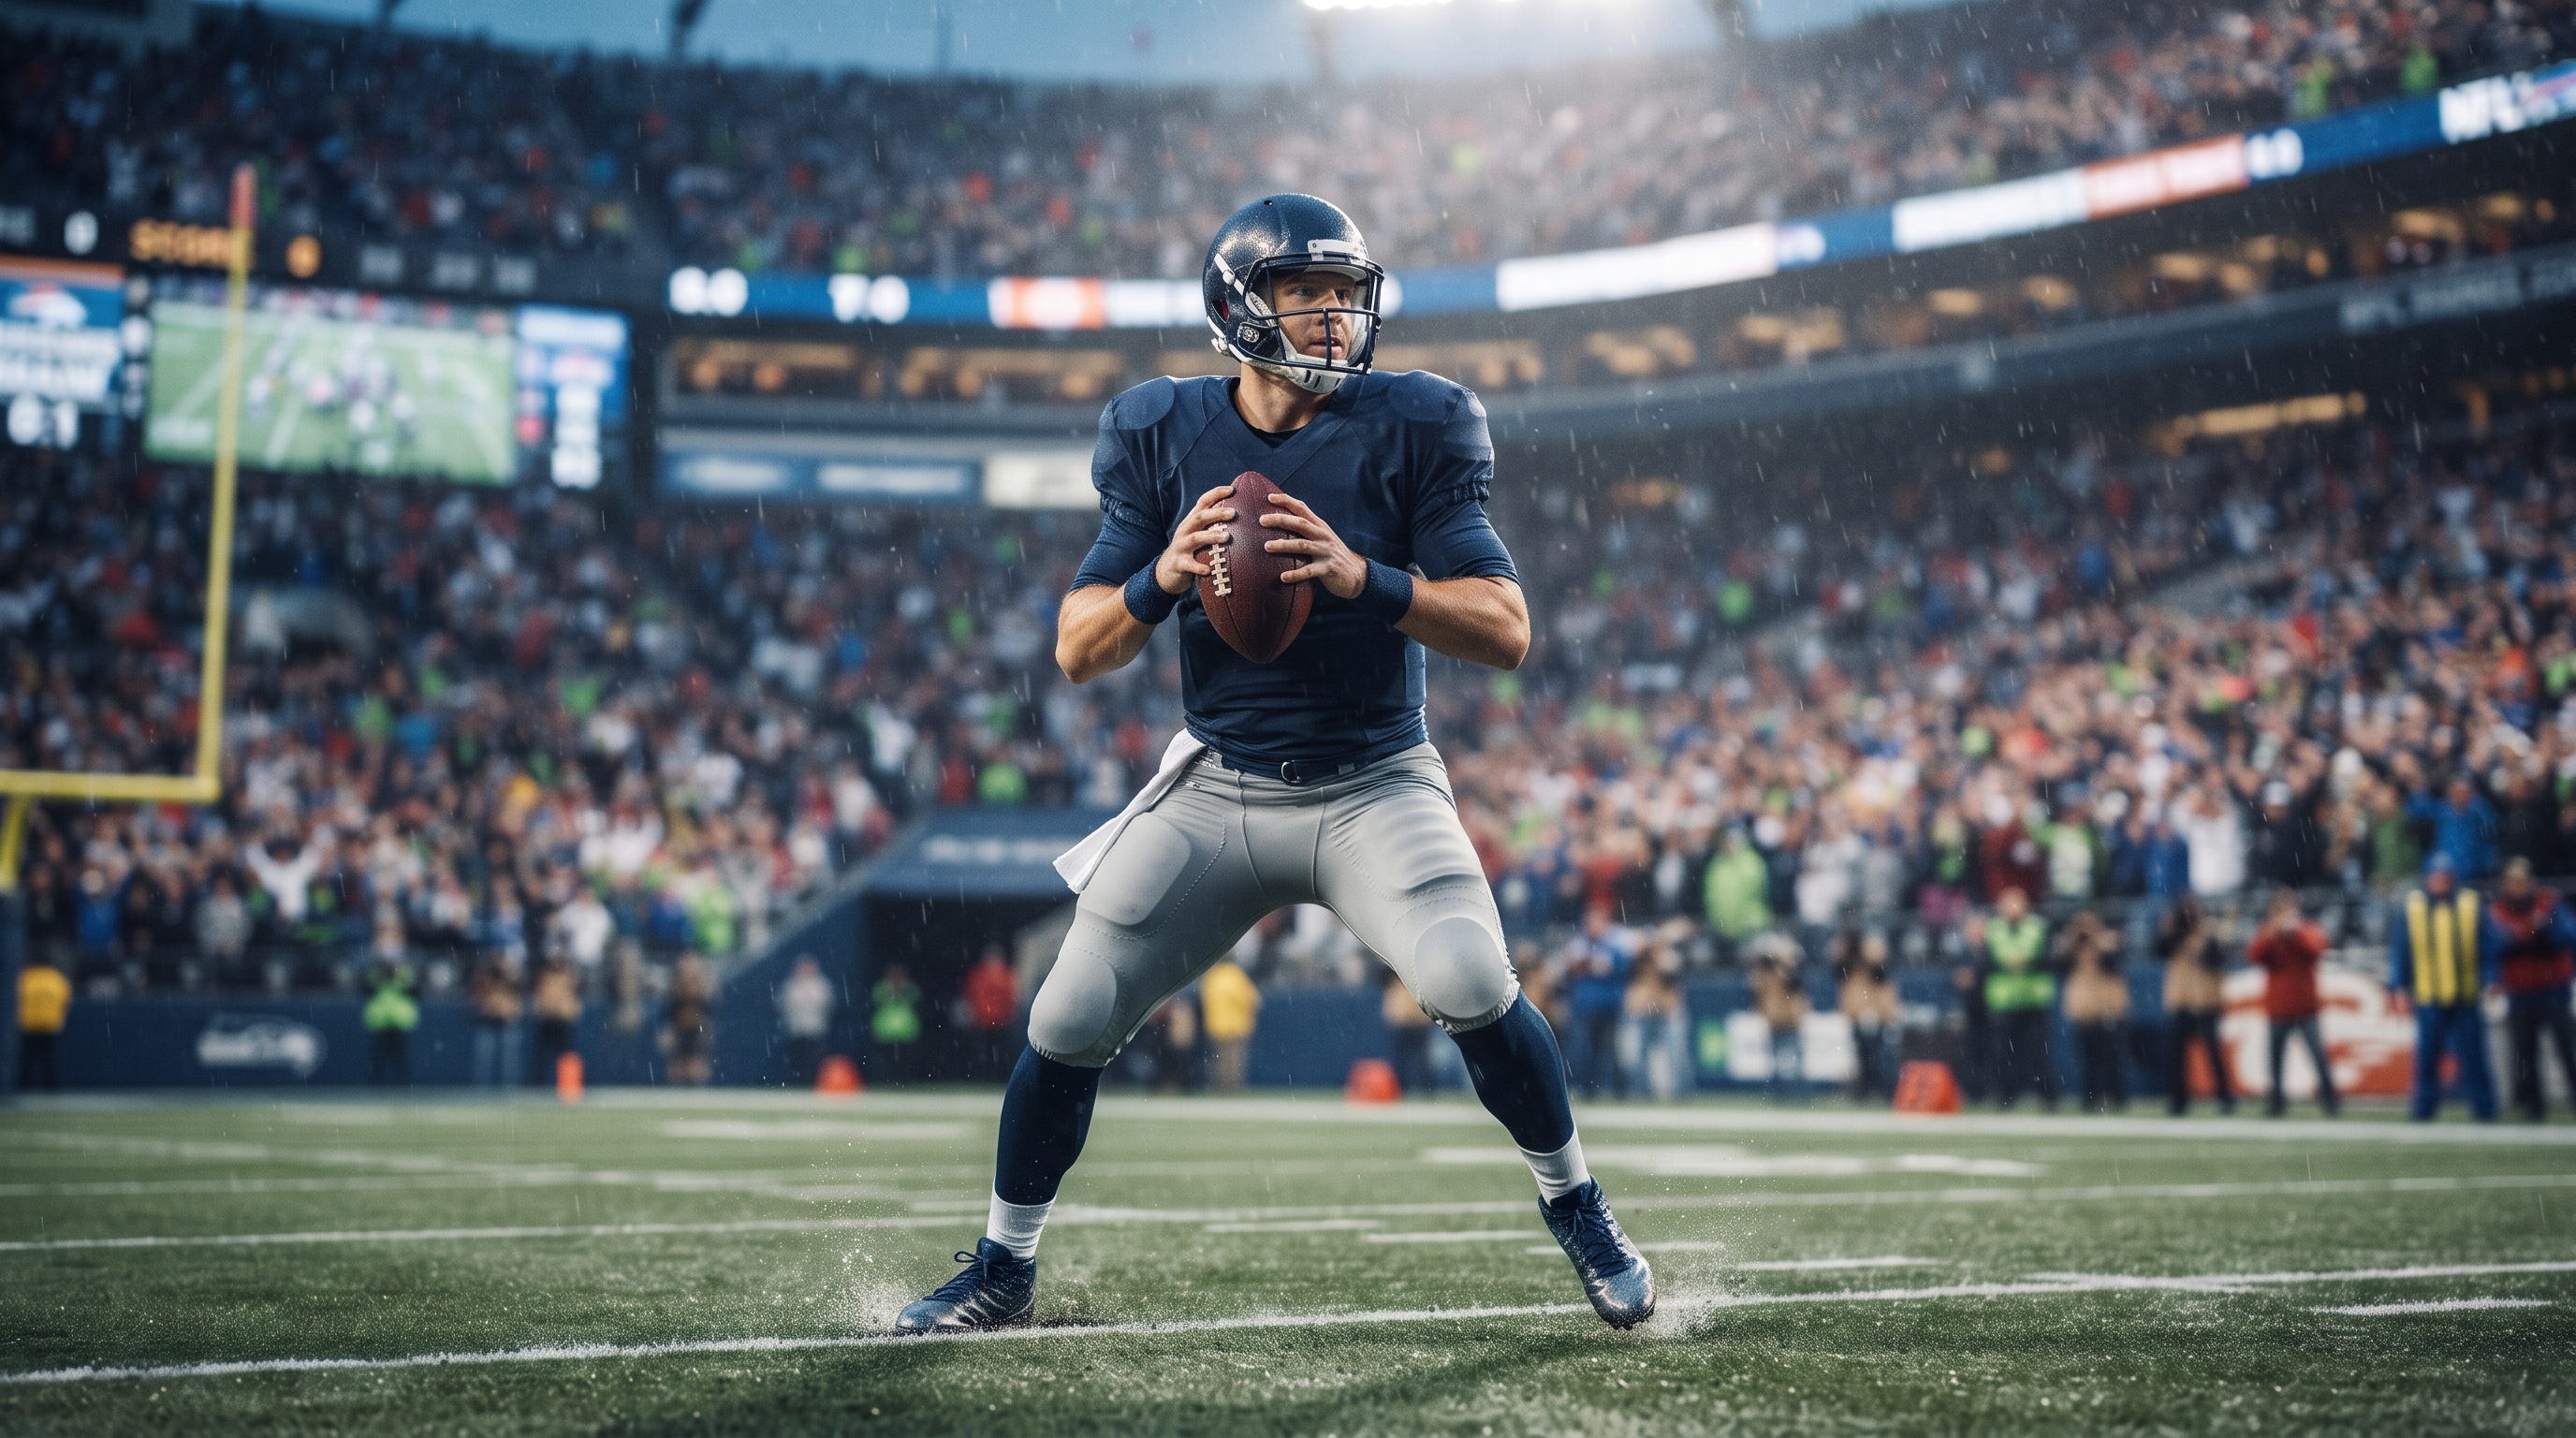
Quarterback completion props look super simple on the surface, but trust me, they completely hide some of the most repeatable edges you can find in sports betting. As someone who spends way too much time building predictive models and hanging out on platforms like ATSwins, I wanted to break down exactly how you can price these lines yourself, read pace and coaching tendencies like a pro, adjust for gnarly weather and late injury news, and turn raw statistical projections into disciplined, profitable bets. You are going to get clear steps, practical tools, and real-world examples that you can put straight to work on your next betting slate.
When you look at modeling completions the right way, you quickly realize you cannot just rely on gut feelings or casual hunches. You have to simulate total attempts and completion rate together, price your fair odds straight from the full distribution, and let the math dictate your portfolio. We rely heavily on clean inputs that actually move the needle, such as team pace, neutral script pass rate, wind speeds, temperature, offensive line health, receiver availability, and opponent pressure rates. Keeping your data fresh and entirely leak free is half the battle. Once you have those projections locked in, turning them into actual profit comes down to understanding de-juicing methods, computing expected value and edge correctly, sizing your bankroll with fractional Kelly strategies, and timing your market entries so you get ahead of injury news or weather shifts. If you stay accountable through strict out of sample testing, continuous calibration checks, and thorough post mortems, you will realize that beating this market is not about magic or luck, but about having a rigorous process and unbreakable discipline. At ATSwins, we apply this exact hands on expertise every single day, offering data driven picks, player props, betting splits, and profit tracking across the biggest sports leagues to help bettors make much smarter choices.
Market mechanics of an NFL quarterback completion prop model
To understand how to beat quarterback completion props, you first need to understand what the market actually is and how sportsbooks construct these numbers. A standard quarterback completions over under market involves a sportsbook posting a specific line, like 22.5, with attached prices on both the over and the under. Books also offer alternate lines across a wide ladder, such as 20.5 or 24.5, with completely different price points depending on how aggressive the market expects the quarterback to be. If you look at live props, those lines move rapidly drive by drive based on live pace, current score differential, and unexpected injury context, though live lines typically carry a much heavier vig. Furthermore, same game parlays often tie completions directly to passing attempts, receiver receptions, and game totals, and books love to pad their correlation assumptions there to maximize their hold.
When we think about this market analytically, total completions are simply a product of total attempts multiplied by the completion percentage, with some natural noise driven by pass depth, defensive pressure, and late game script changes. Total attempts are primarily driven by overall team pace and pass rate over expectation, along with score differential and opponent tendencies. On the flip side, completion percentage is a function of raw quarterback accuracy, offensive scheme, target mix, average depth of target, pass protection, and outdoor weather conditions. Books typically set their opening numbers heavily informed by recent game logs and a baseline projection for attempts and completion rate. They lean heavily on year to date priors for the quarterback, opponent pass defense strength, and weather forecasts. As the week progresses, they make small adjustments of half a completion or a full completion based on fresh news like a wide receiver getting ruled in or out, offensive line shuffles, forecast changes, and sharp betting action. Live adjustments follow possession outcomes and updated win probability models closely.
The pregame hold on player props usually ranges from four to eight percent for two way markets, while alternate lines can easily imply a ten percent or higher hold spread across the ladder. Removing this juice correctly is crucial because it can instantly flip an apparent betting edge into a pass. Core correlations must also be respected, especially when looking at team pace and play volume. More plays naturally lead to more attempts, which gives you more chances for completions. Neutral script pace and no huddle rates are massive drivers of play volume. Coaching tendencies matter immensely too, as early down pass rate over expectation indicates true offensive intent, meaning teams with high early down pass rates will keep throwing even when tied or holding a lead. Two minute drill usage, motion rates, and play action rates also heavily shape completion percentages. Opponent defensive styles play a huge role as well, since high zone usage and soft shell coverages elevate underneath completion rates, while man heavy and press units compress passing windows. Blitz tendencies also shift hot routes and completion splits, since some quarterbacks thrive against the blitz while others completely crumble.
There are also common market biases that you should always keep a close eye on. The public nearly always prefers taking the over on player props, which causes sportsbooks to shade overs at opening and again on weekend game days. If you find yourself wanting to take an over, you should demand a much higher statistical edge to compensate for that public tax. Weather mispricing is another massive opportunity. Light wind under twelve miles per hour is routinely over penalized by casual bettors, whereas heavy wind in the fifteen to twenty plus mile range should move the completion line much more than it typically does. Cold weather alone is actually quite mild in its impact, but wind and heavy rain are true completion killers, while snow is often noisy and not always a negative factor. Recency skew is equally dangerous, as one spike game against prevent coverage can completely inflate the next week line, just as a poor weather dud can present a fantastic buy low opportunity for an indoor game the following week. When scoping which quarterbacks to model each week, start with primetime slates or high total games because more plays and more eyes equal more misprices. Add injury driven pivots carefully, remembering that a top two receiver absence typically shifts average depth of target and efficiency, while replacement level receivers often mean shorter routes and more catchable passes. Tackle injuries often move completion percentage much more than guard injuries, especially against top tier pressure units. Quarterback health is also critical, as shoulder, elbow, or rib injuries impact time to throw and accuracy far more than leg injuries, though an ankle issue might reduce scramble to throw patterns. Defensive matchups matter too, especially when teams change coordinators or schemes midseason and lag behind in market pricing. Your weekly triage process should quickly flag games with weather risk, high totals, or big spread swings, pull depth chart changes for skill players and offensive linemen, identify coach quotes and beat reports about tempo splits, and prioritize quarterbacks with volatile splits against zone versus man coverage or pressure versus blitz situations.
Data and feature engineering
Building a robust model requires assembling clean, high quality datasets that capture every nuance of the game. You want to gather play by play data and drive context, historical player logs tracking stable quarterback attempts and completions, tracking metrics covering separation, time to throw, average cushion, and pressure rates, and market context data for line scraping and price history. You should also augment this with accurate weather data covering kickoff wind speeds and sustained wind, rain probability and intensity, dome versus outdoor designations, offensive line health and continuity tracking, and defensive opponent data including coverage shells, zone rates, blitz rates, pressure rates without a blitz, and pass rush win rates.
When you build your clean weekly dataset, your unit of analysis should be the quarterback game. Your features should include moving averages with proper decay, such as accuracy moving averages over the last three to six games weighted by pass depth and situation difficulty, time to throw moving averages, and pressure to sack ratios. You need scheme adjusted average depth of target to normalize quarterback performance against league averages for specific downs, distances, and coverage mixes faced, which helps you avoid schedule noise. Include neutral script pass rates, no huddle usage rates, and motion rates, as both motion and no huddle correlate heavily with easier completions and faster overall team pace. Receiver availability is crucial, so calculate weighted target shares missing and route win rates or separation metrics for all active receivers. Opponent pass defense features should include success rates allowed on short and intermediate throws, pressure rates, pressure without blitz rates, and split coverage success against zone and man schemes. Quarterback specific pressure versus blitz splits help you run scenario toggles, and weather features should include binary indicators for domes, wind bins, and rain intensity flags. Your labels will be attempts, completions, completion percentage, and drive adjusted plays.
You must maintain strict leakage checks. Always exclude postgame stats when training pregame models, and for live models, only include information that was actually available at that exact timestamp. Avoid using closing numbers as a training feature to predict pregame lines. For your train and validation splits, use temporal splitting where you train on past weeks and validate on future weeks, or use rolling origin evaluations by season week blocks. Keep entire weeks together to prevent data leakage across games that share injuries or news. Consider leave one season out or leave team out folds for robustness when projecting players to new coaching staffs. Handle outliers carefully by capping extreme wind and rain values, and flag games with massive blowout margins to downweight them in training. Standardize your continuous features for modeling algorithms and store your scalers for deployment. Your lightweight weekly build checklist should pull and refresh all data sources, recompute moving averages and scheme adjusted features, refit or update your model using the recent weeks, run diagnostic plots for calibration and residuals, and lock your model artifacts with a clear version tag for that specific slate.
Modeling framework
When it comes to structuring your predictive models, a two stage approach separating attempts and completion percentage is generally the most effective strategy. In the first stage, you model quarterback attempts using a Poisson or Negative Binomial regression. Your predictors should include team pace, neutral script pass rate, spread and total, opponent pace, no huddle usage, motion, weather, and expected trailing time. Negative Binomial models handle overdispersion much better than simple Poisson models when the variance is significantly larger than the mean. In the second stage, you model completion percentage using a hierarchical logistic or Beta Beta binomial framework. Random effects for the quarterback and the receiver room capture persistent accuracy differences, catchability, and separation traits. Your predictors here include scheme adjusted average depth of target, pressure rate, blitz rate, time to throw, separation, coverage mix, wind, rain, and offensive line injuries. Beta binomial models are particularly appealing because they directly model extra binomial variation like dropped passes or tipped balls.
To combine these stages into final completions, you use Monte Carlo simulation. You simulate attempts from your first stage distribution, and for each draw, you sample completion percentage from your second stage posterior or predictive distribution. You then compute simulated completions using a binomial distribution based on those simulated attempts and completion rates. Repeating this process fifty thousand to two hundred thousand draws per quarterback game gives you smooth tails and stable distributions, provided you set a random seed for complete reproducibility. On top of that, you should include a calibration layer using isotonic or Platt scaling on out of sample predictions to correct any model optimism.
Alternatively, you can use a one step approach with direct completions via beta binomial regression where completions are treated as successes and attempts as trials. This has the advantage of handling overdispersion coherently in a single model, but the major drawback is that attempts become an input, meaning any misforecasted attempts propagate directly through your calculations and you still need a separate attempts forecast anyway. Starting with regularized Poisson or Negative Binomial models for attempts and logistic regression for completion percentage helps you benchmark fancier models and figure out whether added complexity is actually bringing any real signal.
For your tools stack, you can use standard data preprocessing libraries, generalized linear model packages with good diagnostics, Bayesian hierarchical modeling frameworks for posterior predictive simulation, fast numerical computing libraries for Monte Carlo simulations, and feature attribution tools for sanity checks. When performing cross validation, use season week blocks to preserve time order, and consider grouped cross validation by quarterback to test how well your model generalizes to understudied players. Use summary plots to confirm expected signs, such as negative coefficients for wind and positive coefficients for separation, and build simple scenario parameters that you can toggle on Sunday mornings when inactives are announced, allowing you to instantly see how a change in wind speed, trailing script, or missing offensive linemen alters your projections.
Pricing and execution
Once you have successfully simulated a complete completion distribution for each quarterback game, you need to translate those numbers into fair probabilities and market prices. You compute the probability that completions are greater than or equal to a given line for over bets, and less than or equal to that line for under bets. Across alternate ladders, you can read the cumulative distribution function across various thresholds to get all fair prices at once. You then export your fair lines, including median and mean completions for each quarterback alongside break even prices for each step of the ladder.
Removing vig is an essential step before placing any bets. You convert American odds to implied probabilities, and when you look at a two way market where the sum of the implied probabilities exceeds one due to the sportsbook vig, you scale each probability proportionally to find the true fair probability. Your expected value calculation then takes your model probability and multiplies it by the payout, subtracting the probability of losing. You only place a bet when your expected value exceeds your predetermined threshold given model error and market limits.
For bet sizing and risk management, fractional Kelly staking is the industry standard. Your stake is determined by multiplying your fraction by your edge divided by your decimal odds minus one. You must always cap your stake based on market liquidity and your personal risk tolerance, as player props can be quite fragile, and capping plays at a small percentage of your overall bankroll is standard practice. When betting same game parlays, remember that completions often correlate with attempts, receiver receptions, and game totals. Even if sportsbooks price some of that correlation into their prices, you should never assume it is complete, and you should always treat same game parlays as significantly higher variance bets.
Timing your market entries requires a disciplined latency playbook. For injuries, you want to move early if you deeply trust your scenario toggles, whereas for weather, you want to move late when actual wind observations confirm the forecast, typically finding the best value thirty to ninety minutes before kickoff. Set up automated triggers for line moves and price changes, and log every single bet you place with its model version, feature snapshot, and news context so you can review it thoroughly later. Sourcing your lines programmatically and verifying them on screen before placing your bets helps you avoid issues where sportsbooks suspend markets mid click. At ATSwins, we push these edges and tracking metrics straight into intuitive dashboards so members can easily filter bets by edge, book, and time to kickoff. When weather updates or late inactives drop, we publish updated completion distributions and flag changes that cross important thresholds, and you can explore all of our platform picks, betting splits, and tracking tools directly on ATSwins.
Validation and monitoring
Maintaining a profitable model requires rigorous backtesting with strict out of sample controls. You should run multi season backtests where you train your model on past seasons and validate it on future seasons while strictly locking your weekly features to information that would have been publicly known at that exact moment in time. Avoid peeking at late week weather forecasts for early week lines unless your workflow genuinely waits for that weather data. Measure your performance using hit rates against implied probabilities, Brier scores for binary over and under outcomes, and log loss metrics, especially for evaluating your calibration layers.
Calibration checks are vital to ensuring your probabilities are trustworthy. By binning your predictions into percentage buckets and comparing your predicted hit rates against your realized hit rates, you can easily spot overconfidence or underconfidence. Your points should fall neatly along the diagonal line, and consistent deviations at high probability ranges indicate that your model is too confident in its outputs. You should also compare your simulated completion quantiles to empirical quantiles across different wind bins and pressure tiers to make sure your tails are not too light.
Monitoring your profit curves and edge management helps you understand where your model generates the most value. Sorting your bets into edge buckets and plotting your realized return on investment should reveal a monotonic relationship where higher edges yield higher returns, proving that your edge ranking system is working effectively. Tracking whether your closing positions beat the closing line on completions and prices is also a great sign of long term success, even if short term variance makes individual games noisy.
Weekly feature drift and data refreshing keep your model sharp. Monitor your feature importance metrics over time to catch sudden drops that might signal scheme changes or data pipeline issues, and watch for week to week shifts in neutral script pass rates and pace. Recompute your moving averages every single week, age out old seasons using decay parameters to reflect changing team schemes, and revalidate your weather effects as colder winter months arrive with entirely different statistical distributions. Conducting thorough post mortems on your misses is another great way to improve. If your model consistently underweights backup proof volume in blowout games, you need to tag those games and adjust your attempts distribution. If a coaching staff suddenly flips their early down pass rate after a bye week, mark those changepoints and allow for dynamic priors. If offensive line injuries snowball mid game, your live models need to downshift completion rates quickly.
Deployment hygiene is the final piece of the puzzle. Use semantic versioning and slate tags for every model release, storing your model weights, feature scalers, and code hashes securely. Run automated sanity tests before locking your slates to ensure wind effects have the correct sign, dome splits make sense, and no quarterback is predicted to have an impossible number of completions. Ensure your simulation seeds are fixed so your summary stats remain perfectly reproducible. Keep your last stable version on hand as a fallback, and if monitoring flags calibration drift or data errors, roll back immediately.
Practical, step-by-step workflow you can run weekly
Running a successful weekly modeling workflow requires a disciplined schedule divided across the week. Monday and Tuesday are dedicated to setup and updating priors. You refresh your data sources, update wide receiver and tight end target shares along with offensive line availability baselines, refit your base models, and generate preliminary completion distributions using average weather conditions and standard depth charts.
Wednesday and Thursday are all about news intake and model refinement. You pull early betting markets, record opening lines for every quarterback, and layer in initial practice reports. If a star wide receiver misses practice two days in a row, you run your scenario toggles and resimulate your projections. For offensive line absences at tackle or center, you widen your pressure expectations. You compare your model outputs against the opening lines and flag major expected value opportunities before significant juice movement occurs.
Friday and Saturday focus on weather integration and alternate lines. You integrate updated wind and rain probabilities, convert them into precise wind bins for your model, and produce alternate ladder fair prices to identify spots where books overcompensate or underprice the tails of the distribution. You also run a calibration refresh if midseason data suggests any drifting.
Sunday is all about inactive announcements, execution, and live monitoring. Ninety minutes before kickoff, you lock in your active player lists, rerun your receiver room effects and offensive line continuity metrics, and execute final simulations for all quarterbacks before pushing your final edge list to your betting tracker. Your execution discipline requires verifying book lines directly on screen and placing bets where expected value and market limits properly align. For live betting, you allow fast toggles for game situations like a team trailing heavily early on or an unexpected uptick in no huddle pace.
Post slate analysis involves logging all outcomes, closing lines, and last minute news changes, updating your calibration plots and profit by edge graphs, and tagging notable deviations for future research.
How to build the key features that move completion projections
Building the specific features that drive your completion projections does not have to be overly complicated, but it does require focusing on the right data points. For completion percentage, your scheme adjusted average depth of target is a massive building block. By computing a quarterback average depth of target broken down by down, distance, and coverage faced, then subtracting the league average across those exact same strata, you successfully isolate true offensive intent from schedule noise. A lower scheme adjusted average depth of target very often lifts a quarterback completion rate because shorter throws are inherently easier to complete.
Separation and time to throw metrics from tracking data are equally powerful. The interaction between these two metrics matters immensely, as a short time to throw paired with strong receiver separation drastically raises completion probability, especially when facing zone coverages. Tracking quarterback completion percentages specifically when blitzed or when facing pressure without a blitz helps you build accurate scenario models, especially when you combine those personal splits with the opponent blitz rate and pass rush win rate to simulate the expected percentage of snaps a quarterback will spend under duress.
For attempts, your neutral script pace and pass rate over expectation are your primary drivers. Building early down pass rates above expectation using rolling windows and team level regressions helps stabilize small samples. Market consensus spreads and totals also help inform game environments, where implied trailing probability approximations naturally point toward higher passing volumes. No huddle usage and motion rates, even when tracked through proxy metrics like seconds to snap, help you rank team tempos accurately.
When it comes to weather features, wind speed measured at standard ten meter height and binned into clear categories is essential. You apply much larger penalties in outdoor cold stadiums that feature swirling crosswinds, whereas a dome or closed roof stadium yields a near zero weather penalty. Rain intensity matters too, as light rain has a minimal effect, while heavy rain noticeably increases dropped passes and off term throws. Temperature has a milder overall effect, but it is worth including while letting wind dominate your penalty calculations.
Putting it together: two-stage simulation in practice
When you combine your attempts model and your completion percentage model into a cohesive two stage simulation pipeline, everything starts to click. Your attempts model uses a Negative Binomial distribution driven by pace, pass rate over expectation, spread, total, opponent pace, expected trailing time, no huddle usage, motion, dome status, and wind bins to output a mean attempts value and a dispersion parameter, allowing you to draw simulated attempts for every quarterback on the slate.
Your completion percentage model uses a Beta Binomial or hierarchical logistic framework taking in scheme adjusted depth of target, separation, time to throw, pressure rates, blitz rates, zone rates, offensive line injuries, weather, and dome indicators, alongside random effects for individual quarterbacks and receiver groups. This outputs a predicted completion probability and dispersion parameters. For each simulated draw of attempts, you sample completions from a binomial distribution using those simulated attempts and sampled completion probabilities.
At runtime, you apply your scenario toggles seamlessly. If a team top wide receiver is ruled out, you decrease separation by a specific quantile, increase depth of target variability, and apply a small negative adjustment to the completion probability. If a starting left tackle is ruled out, you raise the pressure rate and apply increased penalties on long time to throw snaps. If the wind forecast shifts from moderate to heavy, you move to the higher wind bin and reduce completion probabilities, particularly on deeper throws by applying a depth of target sensitivity coefficient.
Translating simulations into bets with discipline
Identifying betting edges efficiently from your simulation outputs comes down to clear mathematical comparisons. For every posted market line, you compute your model probability of going over that line, retrieve the book price, remove the vig to find the fair break even probability, and compare your model probability directly against that fair price. If your calculated edge exceeds your minimum threshold, which is typically three to four percent for player props, you seriously consider placing the wager.
Your execution checklist requires confirming that final injury reports and active lists match the scenario runs you tested, verifying that weather observations align with your forecasts within an hour of kickoff, and ensuring there is no surprise last minute coaching news or quarterback health issues. You place your bets using fractional Kelly staking with strict caps, and you never chase market steam by lowering your edge quality bar. You record every single bet with its exact line, price, book, model version, feature snapshot, and news tags.
Interpreting your model with SHAP and simple tests
Building sanity checks into your modeling workflow helps you catch subtle bugs before they cost you money. When reviewing feature attribution summaries, you must always check the signs of your coefficients. If wind shows a positive contribution to completion percentage, your model has a bug. If pressure shows a positive contribution, that is also fundamentally wrong. Higher pass rates over expectation should never lower team pass attempts, all else being equal. Comparing feature effects across different months is also important, because if your October and December wind effects look identical, you are likely underaccounting for the interaction between freezing cold temperatures and high wind speeds.
Running quick ablation tests is another fantastic way to measure the true value of your features. If you remove separation metrics from your completion model, does calibration noticeably worsen? If you remove offensive line injury features, does prediction variance increase appropriately? If you remove coverage mix data, do you lose your edge when betting against heavy zone defenses? These ablation tests ensure every feature in your pipeline is pulling its own weight.
Extending to live betting
Extending your predictive framework to live betting during games opens up incredible opportunities, but it requires strict discipline. As games unfold, you replace pregame spreads and totals with live win probabilities and updated pace metrics after the first quarter. You adjust your attempts distribution based on the actual first half neutral script pass rate and two minute drill frequency, and you gradually downweight your preseason and early season priors as more live game data accumulates.
Guardrails are absolutely essential in live betting because latency and market suspension risks are extremely high. You should always use prebuilt scenario toggles that allow you to change assumptions with a single click rather than trying to recalculate math on the fly. You should never auto bet live without manual on screen verification, because live market states change in a matter of seconds.
What matters most for profitability
At the end of the day, profitability in quarterback completion props comes down to a few core truths. Clean data will always beat fancy math, because bad injury tags or stale weather data will completely swamp any sophisticated model nuance you built. Pricing discipline, including correct vig removal and proper Kelly bankroll sizing, determines your profit and loss variance much more than small model tweaks ever will. Prioritizing calibration over raw accuracy is critical, because a well calibrated model prices props much more profitably even if it is slightly less sharp on mean absolute error metrics. Finally, rigorous documentation and version control let you continuously learn and improve, turning every single betting miss into a valuable asset if you can accurately reproduce how you got there.
Furthermore, building out additional market models across different sports such as baseball requires a similar dedication to rigorous simulation and data hygiene. Whether you are developing an ai baseball game analysis framework or refining your daily football workflow, the underlying principles remain completely consistent. You need to gather clean play level logs, build predictive features that isolate true talent from situational noise, and run extensive Monte Carlo simulations to uncover hidden mispricings in the market.
Maintaining this systematic approach across multiple sports allows you to scale your analytical capabilities effectively. When you combine rigorous data engineering with disciplined bankroll management, you create a sustainable edge that transcends any single sport or betting market. Every successful bettor knows that the key to long term profitability is eliminating emotional decision making and relying entirely on objective, data driven probabilities.
In addition to football props, exploring broader predictive angles helps sharpen your overall modeling intuition. For instance, studying how pitch sequencing and pitcher batter matchups influence scoring environments in baseball can give you a fresh perspective on how to handle defensive pressures and scheme matches in football. The crossover between sports analytics models is remarkably high, and the skills you develop while building a robust football completions model will naturally translate into better feature engineering, cleaner validation splits, and more accurate probability distributions across all of your sports betting endeavors.
Helpful links and tools to keep handy
Public play by play repositories and documentation resources
Player game logs and historical statistical split databases
Advanced tracking metrics and team tendency portals
Sports odds sourcing and line history APIs
Professional data science and statistical modeling libraries
Feature interpretation and machine learning explainability packages
Final, compact checklist you can reuse
Data collection: Refresh all play by play logs, historical stats, tracking metrics, injury reports, and weather forecasts. Recompute moving averages and scheme adjusted depth of target metrics.
Modeling execution: Update Negative Binomial attempts models and Beta Binomial completion percentage models. Simulate fifty thousand to two hundred thousand draws per quarterback with a fixed random seed. Apply calibration layers if drift is detected.
Pricing strategy: Convert simulated distributions into fair probabilities for base and alternate lines. Remove vig, compute expected value, and apply fractional Kelly staking with strict caps.
Execution discipline: Move early on injury news and late on weather verifications. Verify all book lines on screen before firing your wagers, and log every detail with model versions and context.
Ongoing monitoring: Track hit rates against implied probabilities, Brier scores, and log losses. Analyze profits by edge buckets and closing line value, and run thorough post mortems on all misses to adjust your features and priors.
If you want prebuilt dashboards that surface completion edges, switch scenario assumptions in seconds, and track live return on investment, ATSwins members get exactly that through AI powered projections, player props, and betting splits that update dynamically with the market, all of which you can check out directly on ATSwins.
Conclusion
Quarterback completion props truly reward a solid, disciplined process. If you model attempts and accuracy separately, price the full distribution accurately, and properly respect weather and injury news, you will find consistent edges. Whether you are building an ai baseball game analysis pipeline or leveraging an nfl player prop edge finder backed by a powerful sports probability engine, success comes down to trackable math. Track your calibration, shop for the best fair lines, and stake your bankroll with absolute discipline. Always think in terms of probability scenarios rather than gut hunches. ATSwins offers an incredible AI powered sports prediction platform featuring data driven picks, player props, betting splits, and profit tracking across the NFL, NBA, MLB, NHL, and NCAA, where free and paid plans give bettors the insights and guides they need to make much smarter, more informed decisions every single day.
Frequently Asked Questions (FAQs)
What is an nfl quarterback completion prop model, in simple terms?
An nfl quarterback completion prop model is a structured way to predict how many passes a quarterback will complete in a game, then translate those projections into odds for over under lines and alternate markets. I break it down into two distinct pieces: figuring out how many total pass attempts a quarterback will have, and predicting what completion rate he will post. When you multiply those together, or better yet, run a full Monte Carlo simulation, you get a complete probability distribution that prices every possible line from twenty one point five up to twenty four point five and beyond. This approach completely stops you from guessing and clearly shows you where a sportsbook is shading their numbers. In short, the model turns film study, tracking data, and market information into objective, fair numerical prices.
What data should I feed an nfl quarterback completion prop model every week?
You should start by feeding your model team pace and game script data that shows how fast a team plays and whether they are likely to lead or trail, along with neutral situation pass rates and quarterback accuracy trends. You definitely want to add offensive line health, wide receiver and tight end availability, drop rates, route win percentages, opponent pressure rates, coverage schemes, and weather data prioritizing wind speeds, rain intensity, and extreme cold. Mixing in coaching tendencies regarding early down playcalling and aggressiveness on fourth down is also crucial because those decisions directly drive play volume and attempts. Finally, you should track in week practice reports closely, so if a top target is limited in practice on Friday, your model can automatically nudge the completion rate down a tick. Keeping your inputs simple yet consistent ensures that your outputs remain genuinely useful.
How do weather, injuries, and coaching changes affect an nfl quarterback completion prop model?
Weather dramatically shifts both the floor and the ceiling of a quarterback performance. Sustained winds over fifteen miles per hour usually lower both the average depth of target and total attempts, which can sometimes slightly raise completion percentage while drastically reducing total completions overall. Heavy rain causes drives to stall repeatedly, so I always trim attempts when modeling rainy games. Injuries shift player roles significantly, meaning a banged up star wide receiver often leads to a higher volume of quick game throws to running backs and tight ends, which can keep completion rates stable while capping explosive downfield plays. Coaching tweaks matter immensely too, as new play callers frequently alter neutral pass rates in their first game or after halftime adjustments. I always re run my models on Saturday night with final injury reports and again on Sunday morning if the weather looks noticeably worse than earlier forecasts suggested.
Can I use an nfl quarterback completion prop model for live betting during games?
Yes, absolutely, but you must do it with strict operational rules. You need to update your model at the end of each quarter using real time pace data, current pass rates, and remaining timeouts, while adjusting for no huddle and two minute drill mechanics. If a team suddenly falls behind by ten or more points, live passing attempts jump dramatically, so I bump up attempts and slightly trim completion rates when defensive pressure ramps up during desperate comeback modes. You must always exercise extreme caution around sudden injuries or unexpected quarterback changes, hitting pause and re baselining your numbers before placing any wagers. Live betting markets move at lightning speed, so prebuilding a few scenario toggles that you can click instantly rather than trying to calculate math in real time is the smartest way to survive.
How does ATSwins.ai help with my nfl quarterback completion prop model?
ATSwins.ai is an incredible AI powered sports prediction platform offering data driven picks, player props, betting splits, and profit tracking across the NFL, NBA, MLB, NHL, and NCAA. Their free and paid plans give bettors amazing insights and guides to make smarter, more informed wagering decisions. In my own routine, I use ATSwins.ai to cross check my personal quarterback completion prop model against real time betting splits, detailed injury notes, and historical player prop trends. It helps me spot shaded lines, confirm my calculated edges, and log my betting results so I can track whether my model is actually beating the closing line over the course of a long season. That feedback loop of projecting, betting, tracking, and learning is ultimately where the true betting edge lives.