March Madness is chaos, but it is not random. That is the biggest thing most people miss. Every year millions of brackets get filled out, and every year most of them get destroyed by Saturday night of the first weekend. People call it madness like it is pure luck, but if you zoom out and look at seeding trends, matchup data, and how the selection committee works in the NET era, you start to see structure inside the chaos.
I build brackets the same way I build betting models. I start with efficiency numbers. I check matchup profiles. I compare public sentiment to real probabilities. Then I decide where I am willing to take risk and where I am not. March is not about guessing upsets. It is about allocating risk correctly.
This guide breaks down march madness bracket seeding trend analysis in a way that is actually usable. We will look at what seeds really do in the NET era, how committee behavior shapes matchups, how to build a repeatable model without overcomplicating it, and how to translate all of that into real bracket decisions depending on your pool size.
If you treat your bracket like a strategy game instead of a lottery ticket, your odds instantly improve.
Table Of Contents
- Historical seeding performance patterns since the NET era (2019–present)
- Seed context and committee behavior
- Building a repeatable seeding trend model
- Translating trends into bracket choices
- Workflow and data resources
- Conclusion
- Frequently Asked Questions (FAQs)
Historical seeding performance patterns since the NET era (2019–present)
The NET system officially replaced the old RPI before the 2019 tournament. That means we now have five completed tournaments in the NET era: 2019, 2021, 2022, 2023, and 2024. The 2020 tournament was canceled, so it does not factor in.
Five tournaments is not a massive sample compared to the full 64 team era going back to 1985, but it is enough to refine how we think about seeds.
If you manually log every Round of 64 result from those tournaments using official brackets from the NCAA and confirm game outcomes through Sports Reference college basketball logs, you see something important. The classic upset lanes are still alive, but the top of the bracket remains strong.
Let us start with the 1 seeds. Across the five NET era tournaments, 1 seeds are 19 and 1 in the Round of 64. The lone loss came in 2023 when Fairleigh Dickinson beat Purdue. That was historic. It was wild. It was also one game out of twenty. That means 1 seeds are still winning about 95 percent of the time in the opening round.
If you are fading multiple 1 seeds in small or medium sized pools, you are just lighting equity on fire.
The 2 seeds are slightly more vulnerable, but still very strong. They are 17 and 3 in Round of 64 games in the NET era. The 15 seed wins were memorable. Oral Roberts over Ohio State in 2021. Saint Peter’s over Kentucky in 2022. Princeton over Arizona in 2023. Those stick in your head. But that is still 85 percent win rate for 2 seeds.
The 3 seeds are also 17 and 3 against 14 seeds in the Round of 64. We saw Abilene Christian over Texas in 2021, Furman over Virginia in 2023, and Oakland over Kentucky in 2024. Again, chaos moments, but still roughly 85 percent chalk.
The 4 seeds are 16 and 4 against 13 seeds in this window, around 80 percent win rate. Slightly shakier than the 3 line, but still solid.
Now we get to where things get interesting.
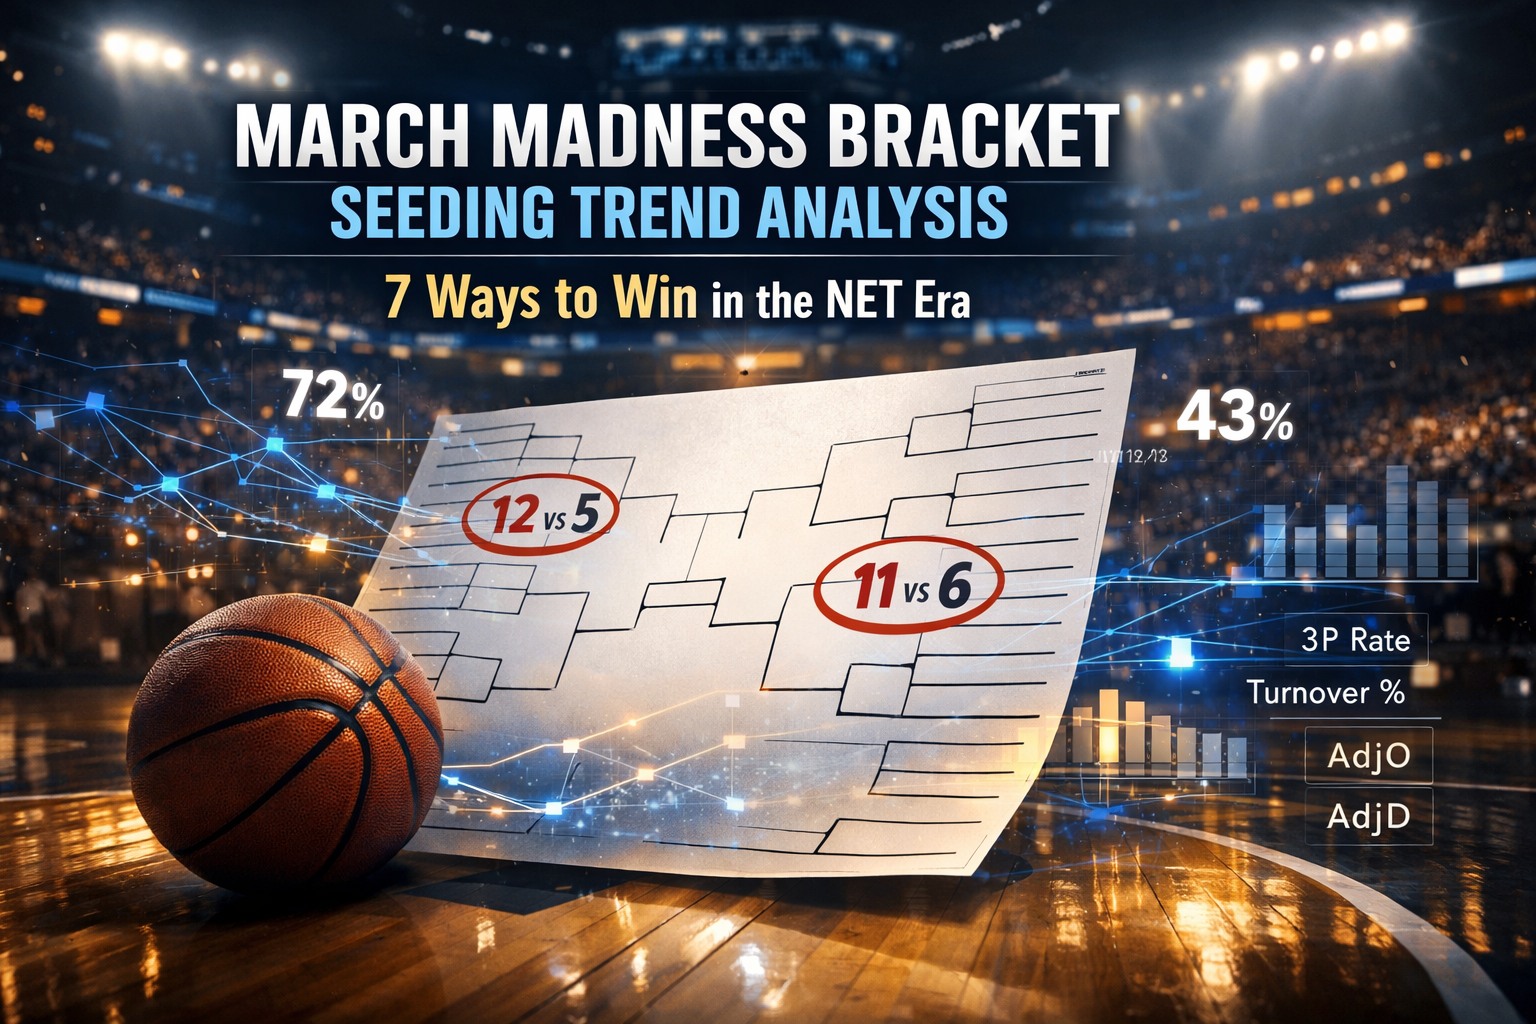
The 5 versus 12 matchup remains the classic upset pocket. In the NET era, 12 seeds have won 8 of 20 games against 5 seeds. That is 40 percent. That is not random noise. That is structural volatility.
The 6 versus 11 matchup is even more volatile. 11 seeds are 10 and 10 against 6 seeds in this window. A literal coin flip. Every year people act surprised when an 11 makes a run, but the math says it is not surprising at all.
The 7 versus 10 matchup leans slightly toward the favorite, but 10 seeds still win around 40 percent of the time. The 8 versus 9 games are essentially coin flips.
So what does that mean? It means you should not treat every upset equally. There are specific lanes where underdogs historically hit at meaningful rates. Those lanes are 11 over 6 and 12 over 5. The 7 versus 10 and 8 versus 9 games are more about matchup nuance than pure seeding.
Beyond the first round, 1 seeds still dominate advancement rates. They are the most reliable path to the Elite Eight and the Final Four. Yes, 2023 had no 1 seeds in the Final Four. That was an outlier year. In most seasons, at least one or two 1 seeds survive to the final weekend.
The mistake people make is overweighting recent chaos. Just because one tournament explodes does not mean the structure has changed permanently. March madness bracket seeding trend analysis is about respecting long run probabilities while adjusting for modern context.
If you zoom out and look at Sweet 16 and Elite Eight appearances in the NET era, 1 through 4 seeds still carry the majority of second weekend spots. The difference is that efficiency driven mid seeds are more capable of punching above their number than they were in older eras dominated by pure win loss record.
That is where the NET era nuance matters.
Seed context and committee behavior
Understanding seeds is not just about counting wins. It is about understanding how the committee arrives at those numbers.
The NCAA Evaluation Tool blends efficiency metrics, scoring margin caps, quadrant based wins, and full team sheet context. That means teams are evaluated more holistically than in the old RPI days.
Efficiency matters more now. A team with elite adjusted offensive and defensive efficiency can secure a strong seed even if it has a few extra losses in a brutal conference. On the flip side, a mid major with a glossy record but weaker efficiency numbers might land a seed line that looks attractive but is fragile.
The scoring margin cap also matters. Running up the score does not inflate ratings endlessly. That prevents fake inflation from weak schedule blowouts.
Quadrant wins shape perception too. Quad 1 wins on the road are heavily valued. A team that survives multiple true road tests in top 30 environments will often get seeded above a team with similar raw record but fewer quality opportunities.
Then there is the human element. Injuries can nudge seed lines. Late season form can subtly influence placement. Conference tournament runs can reinforce committee comfort.
Travel placement is another underrated factor. The committee tries to reward higher seeds with geographic proximity in early rounds. That can give subtle advantages to teams playing closer to home, especially in Thursday Friday pods where travel turnaround is tight.
March madness bracket seeding trend analysis should always ask this question: is this seed aligned with efficiency reality, or is it inflated or deflated by resume narrative?
Sometimes a 6 seed rates like a top 20 efficiency team. Sometimes a 4 seed rates closer to 30th nationally. Those gaps are where value lives.
Regional imbalance also appears almost every year. One region ends up stacked at the top. Another region has a softer 2 or 3 seed. Instead of randomly picking upsets, identify which regions are top heavy and which ones have structural vulnerability.
For example, if two of the top five efficiency teams in the country land in the same region as a 1 and 2 seed, that region is brutal. In that case, lower seeds in that region are less likely to break through. In a softer region, a 3 or 4 seed with elite metrics might have a real runway.
The 7 versus 10 and 8 versus 9 games often reflect this nuance. Public perception leans heavily on brand names. But brand does not block shots or reduce turnovers. Efficiency does.
Building a repeatable seeding trend model
If you want to take march madness bracket seeding trend analysis seriously, you need a repeatable system. Not vibes. Not guesswork.
Start with tempo free metrics. Adjusted offensive efficiency. Adjusted defensive efficiency. Turnover rate on both ends. Effective field goal percentage. Offensive rebounding rate. Free throw rate.
Then layer in shot profile. Three point attempt rate. Rim frequency. Mid range volume. Opponent three point defense. These details matter in single elimination games where variance swings quickly.
Add strength of schedule context. Quad 1 record. Road performance. Non conference schedule quality.
Then add contextual features. Travel distance to site. Time zone changes. Injury flags based on recent rotation stability. Experience and continuity metrics for roster stability.
Once you have that dataset, you can build a basic logistic regression model to estimate win probability for Round of 64 games. Use seed difference as a feature, but do not let seed dominate the equation. The whole point is to measure when efficiency diverges from seed expectation.
After baseline modeling, you can test gradient boosting for nonlinear interactions. But keep it simple at first. Overfitting tournament data is easy because the sample is small.
Calibration is huge. You want your predicted probabilities to reflect reality. If your model says a team has 70 percent win probability, those teams should win around 70 percent of the time historically. Poor calibration destroys bracket EV.
Backtesting is where most people skip work. You should simulate thousands of brackets per historical year using your probabilities. Then score them using common bracket scoring systems. Compare your expected score distribution to pure chalk and to naive upset heavy builds.
You will see something fast. Pure chaos builds lose most of the time. Pure chalk builds win small pools sometimes but struggle in large ones. The sweet spot is controlled leverage.
That is where a structured approach paired with a platform like ATSwins becomes powerful. If your bracket probabilities align with betting market inefficiencies or sharp money splits, you get reinforcement instead of contradiction. It is not about copying betting lines blindly. It is about cross validating signals.
Translating trends into bracket choices
Now we get to the fun part. How does all this translate into actual picks?
If you are in a small pool under 50 entries, you should be conservative. Keep most 1 seeds alive to at least the Sweet 16. Pick one or two 11 or 12 seed upsets where the matchup strongly supports it. Do not blow up three regions chasing chaos.
In medium pools between 50 and 500 entries, you can take slightly more risk. Maybe fade one overvalued 3 seed in the Round of 32. Push a strong 11 seed into the Sweet 16 if your model supports it. But still anchor on strong 1 and 2 seeds.
In large pools above 500 entries, leverage matters more than safety. This is where you compare public pick rates to your modeled probabilities. If a 3 seed is being picked to reach the Sweet 16 by 85 percent of entries but your model gives them only 60 percent odds, that gap is leverage.
You are not trying to predict chaos. You are trying to beat the field’s overconfidence.
Managing the volatile bands is key. In 7 versus 10 and 8 versus 9 games, focus on matchup specifics. Turnover differential. Three point math. Rim protection. Travel edge. Injury depth. If it is truly even, accept that and avoid stacking too many coin flips in one region.
One of the biggest mistakes I see every year is stacking longshots in the same region. If two underdogs win early in the same quadrant, they will likely collide. That caps upside. Spread your variance across regions.
A practical decision framework looks like this. Lock two 1 seeds into the Elite Eight. Evaluate the other two 1 seeds critically based on region strength. Pre select two Round of 64 upsets in the 11 over 6 or 12 over 5 lanes where metrics align. Choose a couple of 7 versus 10 winners based on real matchup edges. Identify one 3 or 4 seed that might be slightly overvalued by the public and consider fading them in larger pools.
Then sanity check the bracket. Are you pushing more than six underdogs into the Sweet 16? That is probably too many. Are you fading three 1 seeds before the Elite Eight? That is almost certainly too aggressive.
Controlled aggression wins brackets more often than reckless chaos.
Workflow and data resources
If you want to replicate this process yourself, you can build a simple workflow.
First, export bracket data from official NCAA sources for each NET era tournament. Log seeds, matchups, and winners. Confirm results with Sports Reference game logs.
Second, build a feature table for each tournament team including efficiency splits, Four Factors, shot profile, strength of schedule, and contextual travel data.
Third, standardize team names carefully. Data mismatches will break your merge logic. Resolve First Four participants correctly so you assign wins properly.
Fourth, split your modeling by season when validating. Do not let games from the same tournament leak across folds.
Fifth, simulate brackets using your predicted probabilities. Score them under realistic scoring systems. Compare distributions, not just average outcomes.
Sixth, incorporate public pick rates if available. Compute leverage as model probability minus pick rate. This becomes your contrarian trigger in larger pools.
Seventh, lock your model version and data snapshot before the tournament begins. Do not rewrite history mid event.
There are limitations. Five tournaments is still a small NET era sample. Committee philosophy can evolve slightly. Injury data can be incomplete. Single elimination introduces variance no model can eliminate.
But even with those limitations, structured march madness bracket seeding trend analysis beats random guessing by a mile.
Conclusion
March Madness is unpredictable, but it is not unknowable. Seeds still matter. Efficiency still drives outcomes. Classic upset lanes like 11 over 6 and 12 over 5 remain statistically meaningful. One seeds still carry the safest paths deep into the bracket.
The goal is not to predict every upset. The goal is to allocate risk where probabilities and public perception diverge. Respect the math. Respect pool size. Use leverage strategically instead of emotionally.
If you want to turn this from theory into execution, ATSwins gives you a framework to pair bracket logic with betting splits, projections, and performance tracking across major sports including college basketball. Whether you are filling out one office bracket or entering massive national pools, disciplined structure gives you an edge.
Chaos will always exist in March. Your job is to be the calm one in the room.
Frequently Asked Questions (FAQs)
What is march madness bracket seeding trend analysis?
March madness bracket seeding trend analysis is the process of studying how different seeds historically perform in the NCAA Tournament and comparing those trends to current team efficiency data. Instead of just assuming higher seeds always win, you look at real advancement rates, upset frequencies, and matchup profiles in the NET era. The goal is to reduce early round risk while identifying calculated leverage spots where underdogs outperform public expectation.
How can I use march madness bracket seeding trend analysis to pick smart upsets?
Start by accepting that most 1 through 3 seeds will win their opening games. That protects your floor. Then focus on historically volatile matchups like 11 versus 6 and 12 versus 5. Only choose upsets where efficiency metrics, turnover margins, and shot profiles support the underdog. Check travel distance, recent injuries, and defensive rebounding strength. Smart upsets are supported by numbers, not vibes. Two well supported swings usually outperform five random darts.
Does march madness bracket seeding trend analysis change in the NET era?
Yes. In the NET era, efficiency metrics and quadrant based wins shape seed lines more heavily. That means some mid seeds are stronger than their number suggests because their efficiency profile is elite. It also means some traditional brand name teams may be slightly over seeded based on reputation and resume narrative. Modern bracket analysis must weigh tempo free offense and defense, schedule strength, and rotation stability more than raw win loss records alone.
What data matters most for march madness bracket seeding trend analysis?
Adjusted offensive and defensive efficiency are foundational. Turnover rates, effective field goal percentage, and defensive rebounding are critical in single elimination settings. Shot profile data such as three point attempt rate and rim frequency help evaluate volatility. Strength of schedule context, especially Quad 1 performance, adds resume nuance. Travel distance, altitude, and injury status can provide final tiebreakers when matchups are close.
How does ATSwins use march madness bracket seeding trend analysis, and what do I get?
ATSwins integrates seeding history with matchup level efficiency modeling to produce data driven projections. Instead of just listing picks, the platform contextualizes where favorites are stable and where underdogs have measurable leverage. Users get access to projections, betting splits, performance tracking, and strategic guides across multiple sports including NCAA basketball. The goal is to combine probability discipline with actionable insight so your bracket and betting decisions are grounded in real data rather than hype.
Related Posts
AI For Sports Prediction - Bet Smarter and Win More
AI Football Betting Tools - How They Make Winning Easier
Bet Like a Pro in 2025 with Sports AI Prediction Tools
Sources
The Game Changer: How AI Is Transforming The World Of Sports Gambling
AI and the Bookie: How Artificial Intelligence is Helping Transform Sports Betting
How to Use AI for Sports Betting
Keywords:
MLB AI predictions atswins
ai mlb predictions atswins
NBA AI predictions atswins
basketball ai prediction atswins
NFL ai prediction atswins