The bracket is set, the lines are live, and the "experts" are already recycling the same tired narratives. But as Selection Monday fades into the madness of the opening round, a cold reality sets in for the betting public: the data you're using is already obsolete.
In a 2026 landscape defined by unprecedented transfer portal volatility and late-season injury shocks, relying on season-long averages is the fastest way to a busted bankroll. While the casual fan looks at a team’s record, ATSwins.ai looks at their ceiling under specific tournament conditions. Yesterday’s bracket reveal didn't just give us matchups; it gave us a mathematical puzzle that traditional analytics are fundamentally unequipped to solve.
The danger of "Selection Monday" lies in the human tendency to anchor to what happened in January. But in the NCAA Tournament, January is a lifetime ago. A team's "true" identity on March 16th—after accounting for travel fatigue, matchup styles, and missing personnel—often looks nothing like their KenPom profile. Relying on static metrics today is like trying to navigate a hurricane using a map of the stars from six months ago. The conditions have shifted, the personnel has changed, and the stakes have reached a terminal velocity that only high-frequency predictive modeling can capture.
The Failure of Traditional Power Rankings: Why NET and KenPom are Lagging Indicators
For over a decade, the NET (NCAA Evaluation Tool) and KenPom rankings have been the gold standard for bracketology. However, in 2026, these metrics are increasingly acting as lagging indicators rather than predictive powerhouses. The reason? Transfer portal volatility.
Modern rosters are no longer built over four years; they are assembled in four months. A team like Michigan (Midwest #1) may have spent November finding their chemistry, dragging down their season-long efficiency metrics. Conversely, a team that dominated a weak conference in January often carries an inflated NET rating that doesn't account for the "strength of schedule shock" they face in the first round.
The "Availability Bias" Trap
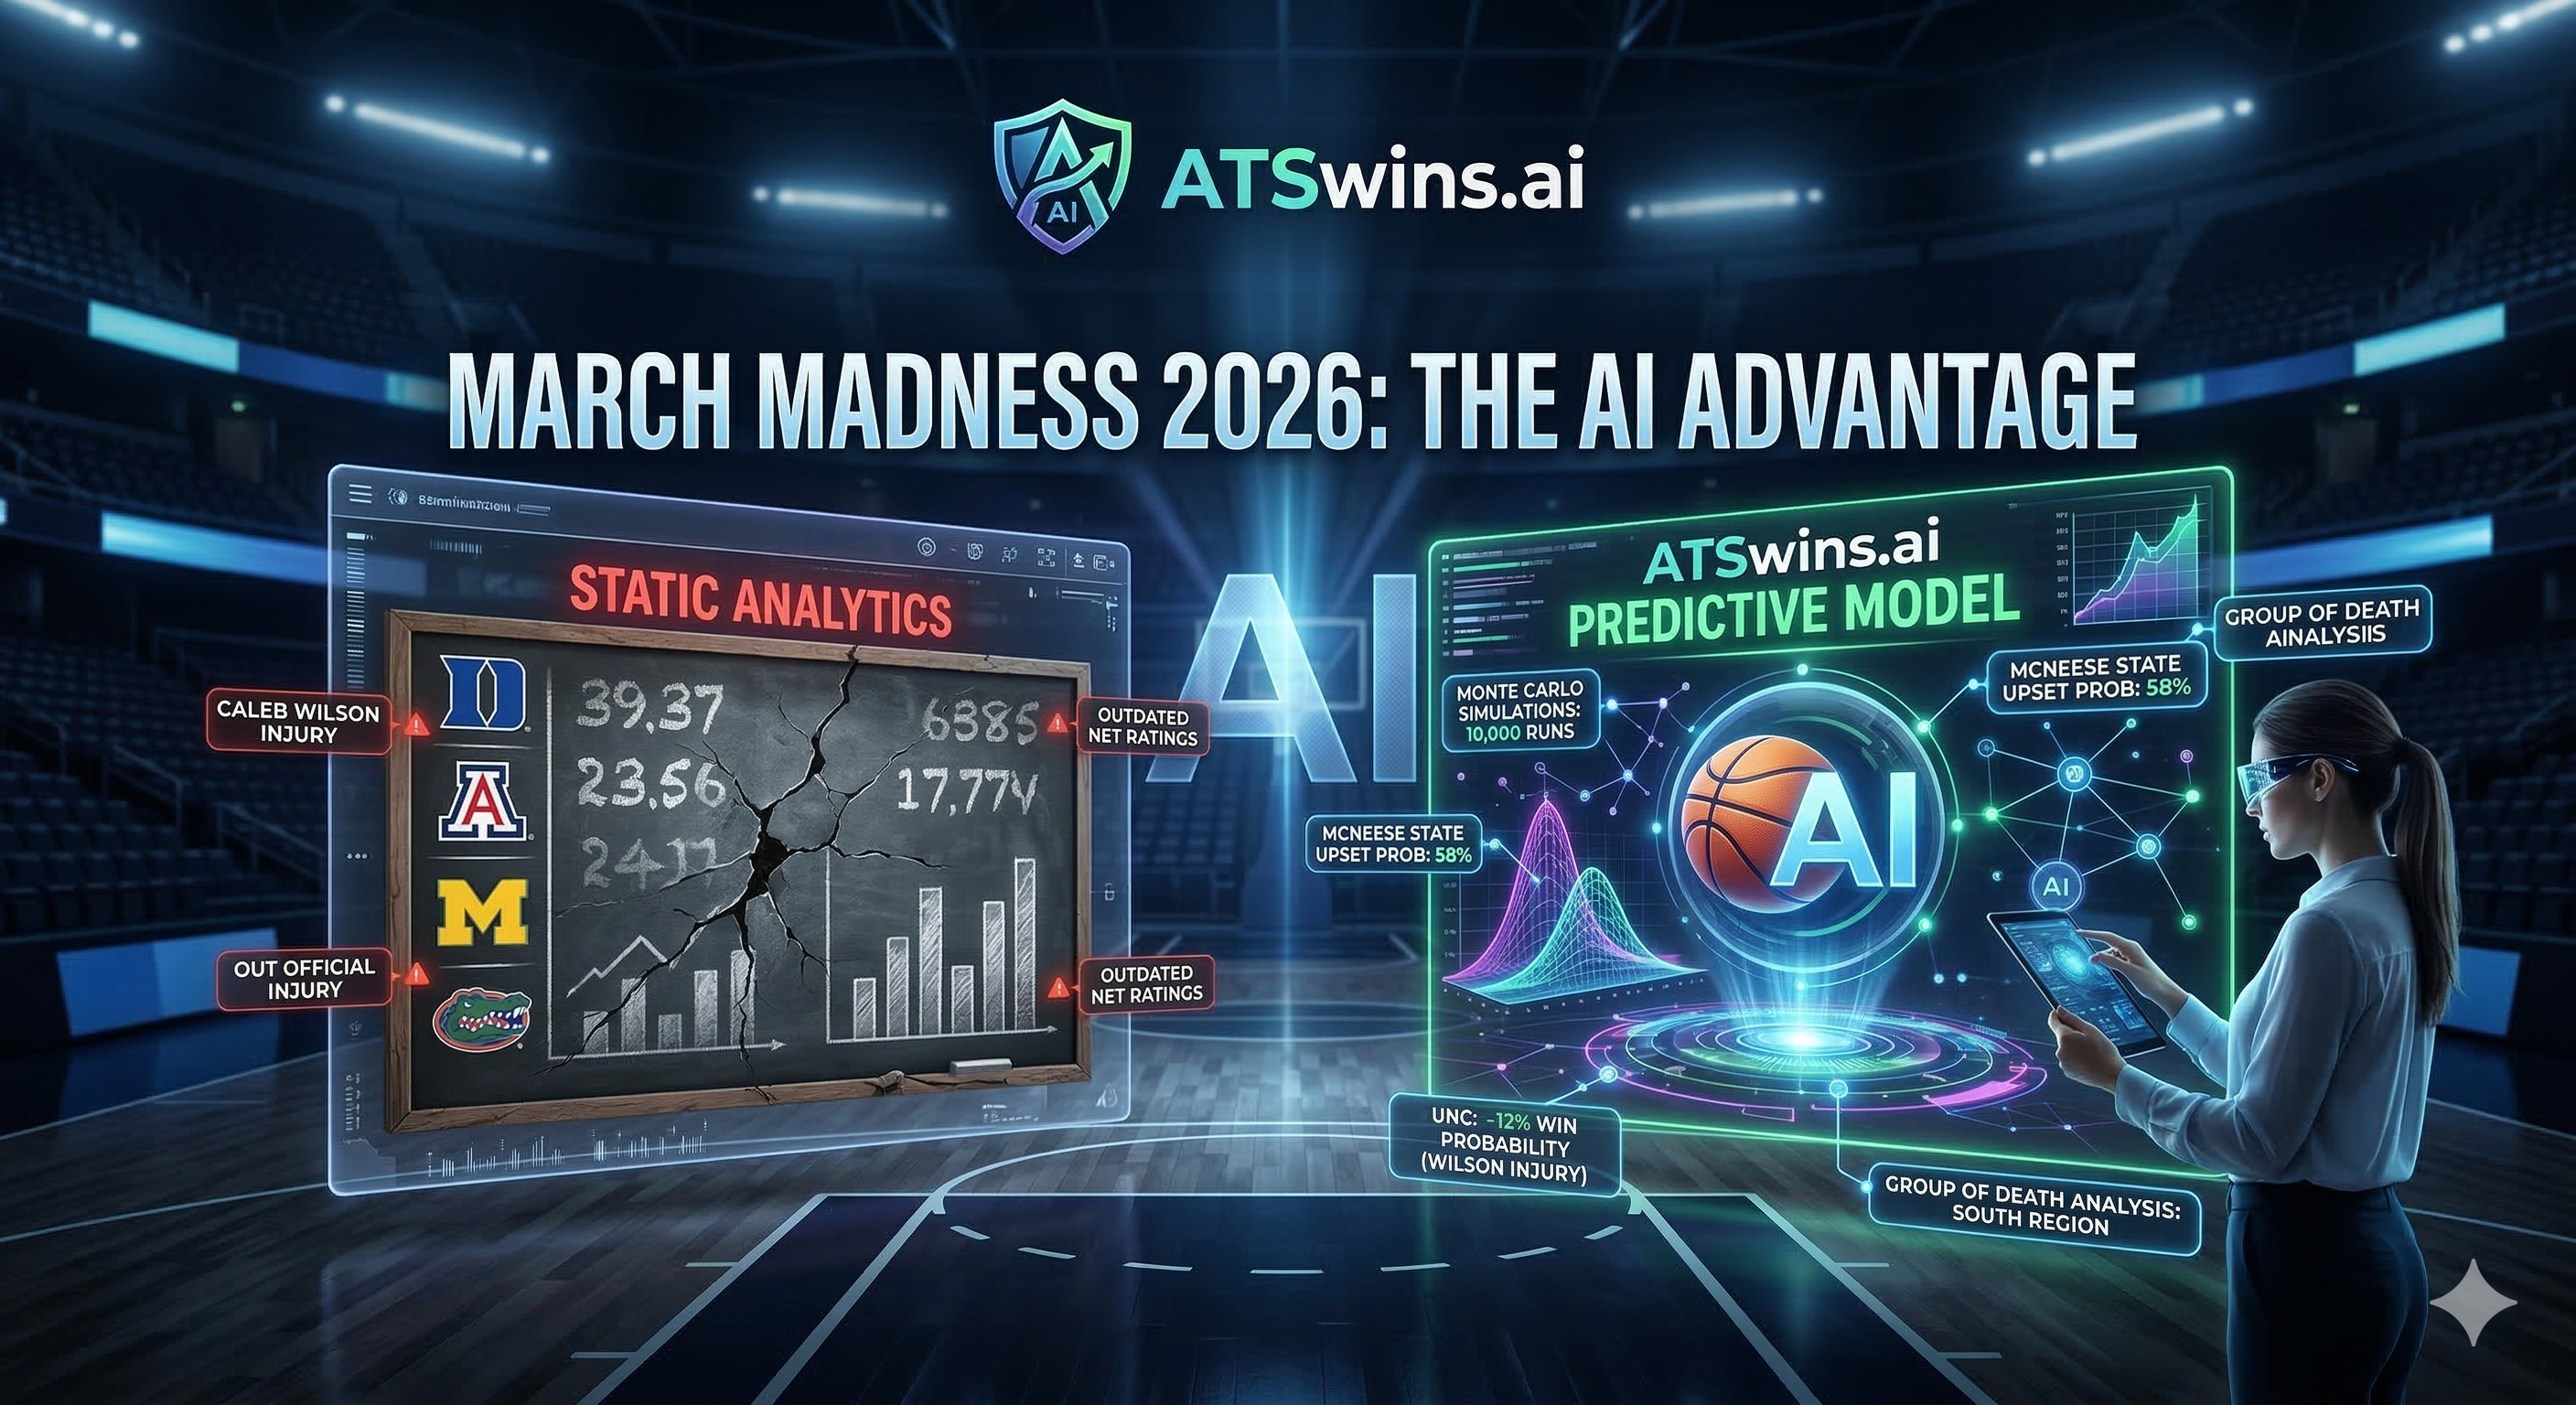
Traditional models struggle with what we call "Availability Bias." They weigh a game played in December with a healthy roster the same as a game played in March with key starters sidelined. When the committee placed Duke as the Overall #1 seed in the East, the public saw a juggernaut. What they didn't see was the mathematical vacuum created by the loss of their floor general. Static analytics see the 32-2 record; our predictive model sees a team forced to reinvent its offensive identity in 72 hours.
The NET specifically rewards "Quad 1" wins. But a Quad 1 win in December against a team that has since lost its star player to a season-ending injury is a "hollow" data point. It tells you about the past, but it predicts nothing about the future. In the 2026 field, where over 40% of the starters in the Round of 64 are first-year transfers, the lack of "legacy data" makes traditional RPI-style rankings almost useless. If you aren't adjusting for these shifts in real-time, you aren't betting; you're gambling on history.
The ATSwins.ai Methodology: 10,000 Simulations to Find the Truth
At ATSwins.ai, we don’t "guess" how a game will go. We simulate it until the noise disappears. Our model runs 10,000 Monte Carlo simulations for every matchup in the 2026 bracket, focusing on variables that humans—and basic spreadsheets—simply cannot quantify.
1. Handling Shooting Variance
Most models assume a team will shoot their season average. We know better. Our simulations account for "high-variance" teams—squads that live and die by the three. We calculate the probability of a "cold night" in a cavernous NBA arena (where early-round games are held) versus a standard college gym. If a team like Illinois depends on 40% shooting from deep to cover a -6.5 spread, our model runs scenarios where they hit 25%, 35%, and 50%, providing a weighted probability of the cover.
2. Referee Bias & Style Matching
We integrate officiating data into our simulations. Does a crew call it tight? That favors a deep bench like Florida’s. Does the crew let them play? That gives the edge to a physical, defensive unit like Houston. Our database tracks the "foul-call-per-possession" rate of every officiating crew assigned to the tournament. If a "whistle-happy" crew is assigned to a game involving a team with a thin rotation, our model automatically downgrades that team’s win probability. We quantify the "aggression threshold" of each matchup, determining which teams are likely to end up in the bonus early and which will be forced to play tentatively.
3. The Fatigue Factor & Travel Logistics
Traditional analytics don't account for the "Sunday-to-Thursday" turnaround. Teams that had to grind through four games in four days to win their conference tournament enter the Round of 64 with a measurable "Fatigue Tax." Our simulations include travel distance and "rest-adjusted efficiency." A team flying across three time zones to play a morning tip-off (a common fate for West Coast teams sent East) faces a statistical hurdle that a static KenPom rank cannot possibly calculate.
Fraud or Favorite? The AI Deep Dive
The most dangerous teams in the bracket aren't the #1 seeds; they are the mid-majors with glossy records that the public falls in love with.
Miami (Ohio) (#11 Seed): The Statistical Ghost
The RedHawks entered the conversation with a staggering 31-1 record, but our metrics flag them as a "Statistical Ghost." Their Strength of Schedule (SOS) ranked in the bottom 30 nationally. While the public sees a "winner" and a potential Cinderella, our model shows they struggle against elite length.
- The Reality Check: In 10,000 simulations against SMU in the First Four, Miami (Ohio)’s win probability drops significantly when the pace quickens beyond their comfort zone. They have an "Adjusted Defensive Efficiency" that ranks outside the top 100 when adjusted for opponent quality. To the public, they are a 31-win juggernaut; to our AI, they are an inflated asset ready to be liquidated.
McNeese State (#12 Seed): The AI Darling
Unlike Miami (Ohio), McNeese State is a team our model loves. Despite their #12 seeding, their defensive efficiency metrics and turnover margin suggest they play more like a top-25 program.
- The Edge: Our model identifies their first-round matchup against Vanderbilt as a high-value upset alert. The Cowboys force turnovers on over 20% of possessions—a metric that historically correlates with #12-over-#5 upsets. In our simulations, McNeese covers the spread in 58.4% of outcomes. While the public sees a small-school underdog, our AI sees a defensive buzzsaw that creates extra possessions out of thin air.
2026 Regional Analysis: Finding the Edge
East Region: The Blue Blood Minefield
- #1 Seed: Duke (Overall #1)
- The Favorite: Duke. Despite the loss of Caleb Foster (foot surgery), Duke remains the model's favorite to reach the Final Four. The emergence of Cayden Boozer as the primary ball-handler has stabilized the offense. Duke's "Shot Quality" remains the highest in the field.
- Public Trap: UConn (#2). The Huskies are a trendy pick for a repeat, but our simulations show they are highly susceptible to "Referee Variance" due to their aggressive perimeter defense.
- AI-Backable Play: Michigan State (#9). Our model sees their "Post-Season Veteran Factor" and Tom Izzo's historical "March Overperformance" as a massive edge. They are projected to cover against Purdue (#8) in 61% of simulations.
West Region: Arizona's Redemption
- #1 Seed: Arizona
- The Favorite: Arizona. Playing in San Jose, the Wildcats have the most favorable "Geographic Edge" in the tournament. Our model gives them a 64% chance to reach the Elite Eight. Their offensive transition speed is unmatched in this region.
- Public Trap: Kansas (#15). A shocking #15 seed placement reflects their late-season collapse. Despite the "Kansas" name on the jersey, their efficiency metrics are at a 15-year low.
- AI-Backable Play: Gonzaga (#11). Under-seeded and dangerous. Our AI gives them a 45% chance to make the Sweet 16, nearly double the probability implied by their seeding.
South Region: The 'Group of Death'
This is statistically the toughest region in the bracket, featuring Florida (#1), Houston (#2), and Illinois (#3).
- #1 Seed: Florida
- The Favorite: Florida. The Gators' frontcourt depth allows them to survive foul trouble better than any team in the country. They are our "Highest Probability" Final Four team from this region.
- Public Trap: North Carolina (#6). The loss of Caleb Wilson (thumb fracture) is catastrophic. Wilson was the Tar Heels' leading scorer and rebounder. Without him, our model sees a massive regression in their second-chance points.
- AI-Backable Play: Houston (#2). Despite being a #2 seed, our model actually rates Houston higher than Florida on neutral courts due to their "Shot Quality" defense. They are the strongest #2 seed in modern tournament history.
Midwest Region: The Big Ten Test
- #1 Seed: Michigan
- The Favorite: Michigan. Despite a late loss in the Big Ten tourney, Michigan’s "Adjusted Efficiency" remains elite. They are the most balanced team in the region.
- Public Trap: Texas Tech (#14). The Red Raiders are being overvalued based on a hot shooting streak. Our model expects a "Mean Reversion" in their three-point percentage.
- AI-Backable Play: Iowa State (#7). The Cyclones are the "Bracket Buster" in this region. Their defensive metrics are top-tier, and our simulations have them winning their first two games in 54% of scenarios.
Impact Analysis: The Injury Factor
Injuries in March are the ultimate "Black Swan" events for bettors. Our AI tracks the "Substitution Value" of every bench player to see if a team can actually survive a loss.
Duke: The Caleb Foster Absence
Foster’s surgery removes a veteran presence, but our model shows Duke’s bench depth—specifically the increased minutes for Cayden Boozer—actually offsets the scoring loss. However, the real hit is on their defensive "Adjusted Efficiency," which drops by 2.4 points per 100 possessions. This means Duke is still likely to win, but much less likely to cover large spreads, such as the -27.5 opener against Siena. If you are betting the spread, the AI suggests the "Foster Factor" makes Siena an attractive play to stay within the number.
UNC: The Caleb Wilson Void
This isn't just an injury; it's an identity crisis. Wilson (19.8 PPG, 9.4 RPG) accounted for nearly 20% of the Heels' offensive usage. Our simulations show UNC’s "Win Probability" against the spread dropping by 12% across all potential matchups. Against a surging VCU (#11), the Tar Heels are in grave danger. Wilson's absence also guts their interior defense, raising the "Expected Points at Rim" for every opponent they face.
Advanced Betting: Beyond the Bracket
While the "Bracket Challenge" is for the office pool, the real money is made in the individual game markets. ATSwins.ai doesn't just predict winners; we identify market inefficiencies in the following areas:
1. Team Totals (The "Under" Opportunity)
Early round games in large domes often feature lower shooting percentages as players adjust to the depth perception of the arena. Our model identifies teams with a high "Rim-to-3" ratio that are likely to struggle in these environments.
2. Live Betting Volatility
Our AI tracks "Elasticity." If Arizona goes down by 10 points early, what is the statistical likelihood they recover? Because our model has run 10,000 simulations, we know the "Comeback Probability" for every team in every situation. This allows our users to hit "Live Value" when the market overreacts to a 6-0 run.
3. Prop Market Edge
In 2026, player props are the fastest-growing betting market. When Caleb Wilson is out for UNC, who takes those 15 shots? Our model predicts usage shifts, identifying "Overs" on players like Henri Veesaar before the oddsmakers adjust their individual lines.
Locking in the Edge
The biggest mistake a bettor can make is waiting until Friday morning. The "Opening Line" value is available right now. By the time the public realizes UNC can't rebound without Wilson or that McNeese State is a defensive juggernaut, the spreads will have moved 3-4 points. Professional bettors refer to this as "clipping the closing line"—the goal is to bet at a number that is significantly better than where the line ends up at tip-off.
Related Articles:
The Quant’s Edge: Mastering Sports Betting with ATSwins.ai in 2026
Sources:
The Game Changer: How AI Is Transforming The World Of Sports Gambling
AI and the Bookie: How Artificial Intelligence is Helping Transform Sports Betting
How to Use AI for Sports Betting
Keywords:
MLB AI predictions atswins
AI MLB predictions atswins
NBA AI predictions atswins
March Madness ATSwins