Beating the NFL betting market takes a lot more than throwing money on your favorite team or trusting a random gut feeling. Winning consistently in football betting comes down to having structure, discipline, and a process you can repeat week after week. This guide is going to walk through exactly how to think about value, how to translate odds into probabilities, how to build a simple framework for power ratings, and how to use those ratings to price games properly. We’ll also go into how to evaluate matchups, how to manage your bankroll, when to time your bets, and how to track performance so you know if you’re actually improving or just getting lucky. If you stick with this kind of process, betting stops being about chasing hot streaks and becomes more like investing with an edge.
Table Of Contents
- Defining value, bankroll, and CLV
- Building baseline power ratings and pricing a game
- Matchup lens and situational angles
- Market timing and execution
- Modeling and review
- Tools, templates, and a quick workflow
- Conclusion
- Related Posts
- Frequently Asked Questions (FAQs)
Defining Value, Bankroll, and CLV
One of the most important skills in NFL betting is learning to see beyond the odds on the screen and figuring out the true probabilities behind them. Odds look like just numbers, but those numbers hide probabilities that you can work with to make sharper calls.
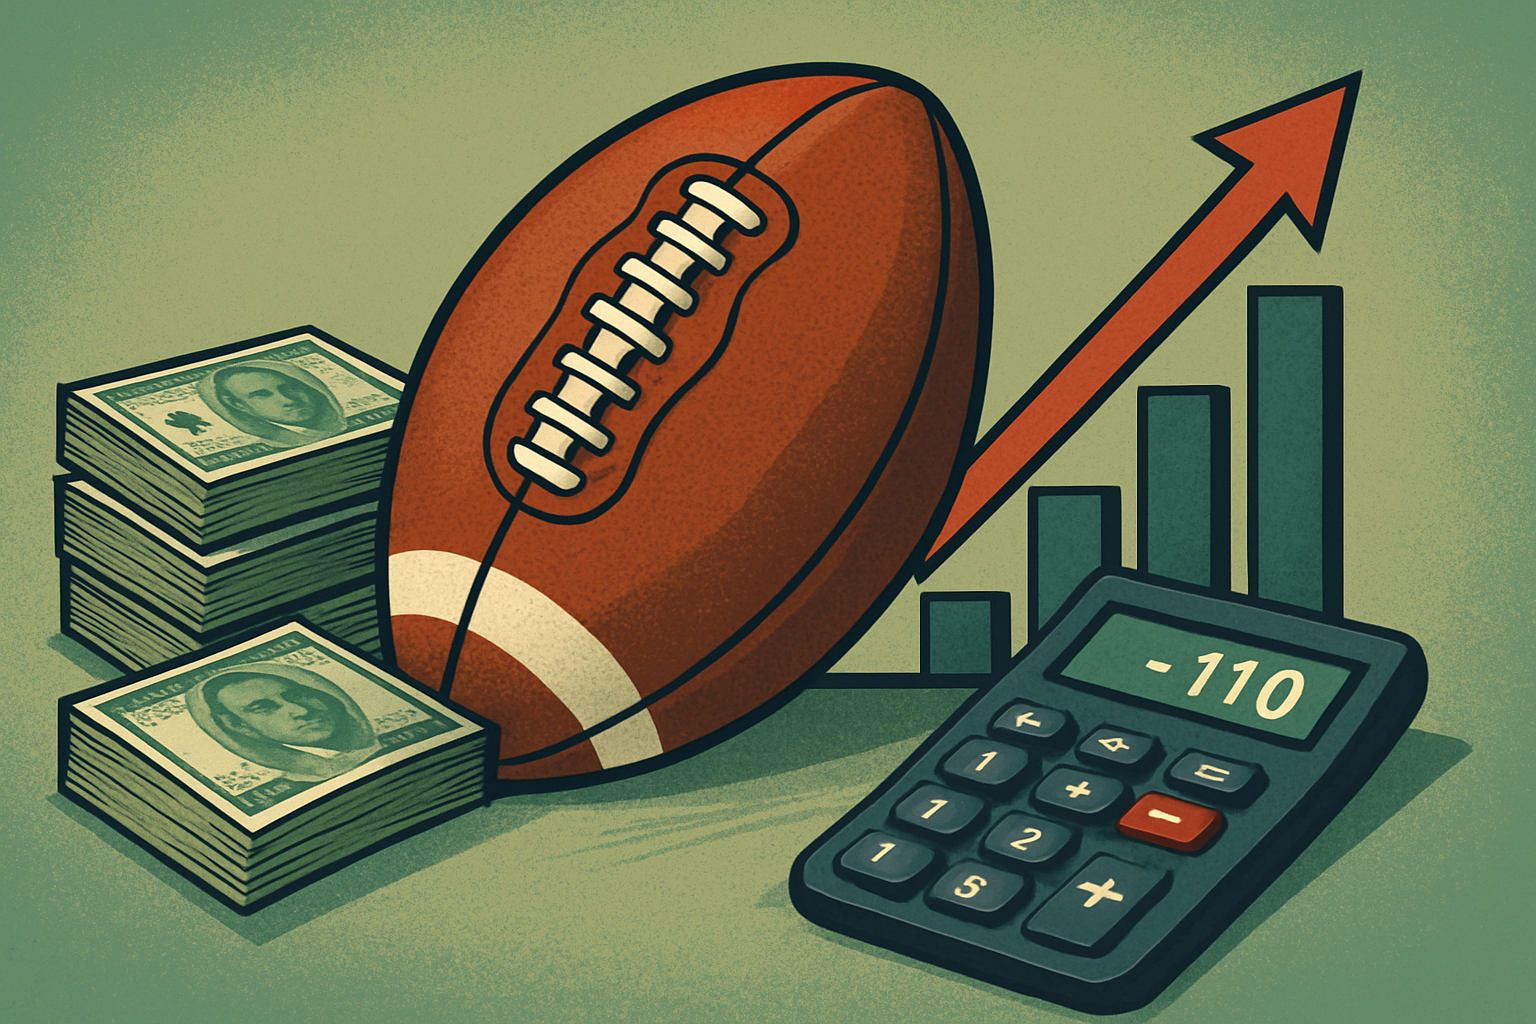
When you see American odds, whether it’s -110 on a spread or +125 on an underdog, you can convert them into implied probabilities. For a favorite at -110, the implied probability is about 52.38%. For an underdog at +125, the implied probability is about 44.44%. Once you know how to do this, you can see what the market is really saying about each team’s chance of winning.
But here’s the thing: sportsbooks build vig, also called juice, into the lines. That’s how they make money no matter who wins. If you just look at implied probabilities straight from the odds, you’re still seeing inflated numbers because of that built-in margin. To get to the fair price, you strip the vig out. That gives you a no-vig probability that’s closer to the “real” market consensus.
Now, once you have no-vig probabilities, you can compare them to your own fair price. If your number says Team A has a 55% chance of winning but the no-vig market has them at 50%, then you’ve got a 5% edge. That’s where value lives. The trick is only pulling the trigger when your edge is big enough—at least two or three percentage points—because smaller edges can disappear in noise.
All of this ties into bankroll management. If you’re just throwing random amounts on every bet, you’re setting yourself up for wild swings. The smarter way is either flat betting, like always risking 1% of your bankroll per play, or using a fractional Kelly system, where your bet size scales up and down based on how strong your edge is. Kelly can get aggressive, so a half or quarter Kelly is usually safer for beginners.
The other huge part of the puzzle is tracking closing line value (CLV). This is basically comparing the odds you got when you bet to the odds when the market closed. If you consistently get better numbers than the close, it means your process is sharp even if individual bets lose. Beating the close over time is one of the strongest signals you’re actually good at this.
Building Baseline Power Ratings and Pricing a Game
Power ratings are the backbone of any bettor’s process. Instead of guessing based on highlights, you give every team a rating relative to league average. That way, you can actually create your own spreads and totals.
To build power ratings, you start with a baseline. Early in the season, you can lean on market expectations, like season win totals or early spreads, because those already bake in consensus. As games are played, you update with actual performance data. Don’t overreact to raw yardage or box score noise. Focus on per-play efficiency, like expected points added per play (EPA) or success rate, which tell you how consistently a team moves the ball or gets stops.
Updating is an art. You don’t want to swing too hard after one game unless something major happens, like a quarterback injury. The smarter move is gradual adjustments, giving more weight to recent performance but still keeping priors in the mix.
Home field advantage is another piece. It used to be worth three full points automatically, but that’s not the case anymore. Some spots are still tough, like altitude or cross-country trips, while others barely matter. A flexible adjustment, maybe between one and two points depending on context, works better.
Quarterbacks matter more than any position. A starter going down to a backup can shift a line by a touchdown depending on who it is. But don’t ignore clusters of injuries elsewhere—three offensive linemen missing can swing things just as much in certain matchups.
Finally, once you’ve got ratings, you can translate them into spreads and totals. Spreads are basically team rating differences plus context like home field, QB, and injuries. Totals come from pace, pass rate, and offensive efficiency. If your number is off the market by two or more points, it’s worth a deeper look.
Matchup Lens and Situational Angles
Numbers are great, but matchups still matter. You need to layer your power ratings with situational and schematic analysis.
Think about trenches. If a defensive line has a big edge in pressure rate and the opposing offensive line is banged up, that’s a mismatch that could swing the whole game. The same goes for receivers against coverage. If a team has a star slot guy and the opponent struggles defending inside routes, that’s an edge.
Coaching tendencies matter too. Some coaches are aggressive on fourth downs, which can lead to higher totals. Others turtle up and play it safe, which drags games under.
Situational spots are just as important. Short weeks, back-to-back road trips, overseas games, and even weather all play into outcomes. A windy day can crush totals, while travel fatigue can quietly hurt a team’s efficiency.
When you’re building your number, check each of these layers. Is there a QB injury? Is the O-line healthy? Is there a weather edge? Put them together and compare to your base power rating spread. If the market line hasn’t adjusted but your checklist shows a big edge, that’s where you fire.
Market Timing and Execution
Getting the right number is as important as picking the right side. Lines move all week as money comes in, so timing matters a lot.
Openers usually post Sunday night or Monday with low limits. That’s where you can grab edges early if you trust your numbers. By the weekend, limits go up and the market gets sharper, so it’s harder to beat.
Key numbers like 3 and 7 are sacred in the NFL because of scoring distribution. Grabbing a -3 instead of a -3.5, or a +3.5 instead of a +3, makes a massive difference in long-term ROI. Don’t ignore those hooks.
The other big trap is chasing steam. If a line moves fast because sharp money hit it, don’t just tail blindly. Ask yourself if your number supports the move. If you missed the value, let it go. Chasing is a bankroll killer.
The smartest bettors log every bet, not just results but also numbers, reasons, and how they compared to the close. That way you can review your execution and spot patterns.
Modeling and Review
At the heart of long-term betting success is building models. You don’t need to code like a pro to start. A simple model with power ratings, QB adjustments, pace, and efficiency gets you far. Over time, you can add layers like matchup-based adjustments or scenario analysis.
The key is to avoid overfitting. Don’t throw in every stat you find. Stick to a few that consistently show signal and build from there. Always test your model out of sample so you’re not just fitting the past.
After each week, review. Did you beat the close? Did your number miss because of bad input or just variance? Were injuries handled correctly? Was weather properly accounted for? This reflection keeps you improving instead of repeating mistakes.
Tools, Templates, and a Quick Workflow
Betting can feel overwhelming if you’re scrambling every Sunday morning. A good workflow saves time and keeps you consistent.
Start by logging openers Sunday night or Monday. Flag the games where your number disagrees most with the market. By midweek, update ratings with fresh injury reports and efficiency numbers. As Friday hits, watch for limits going up and weather forecasts locking in. Saturday is for final tweaks, and Sunday morning is just confirming actives and inactives before kickoff.
Keep everything tracked in one place. A spreadsheet works fine: team ratings, spreads, totals, your fair price, the market price, edge percentage, bet size, result, and CLV. Over time, this becomes your personal playbook.
And don’t forget that ATSwins is built exactly for this process. With AI-powered picks, betting splits, and profit tracking, you can cross-check your numbers against what the platform projects. That way, you’re never betting blind—you’re betting with data.
Conclusion
The difference between casual betting and actually beating the NFL market comes down to discipline. You price the game instead of guessing, only bet when your edge is real, manage your bankroll carefully, and track your performance honestly. It’s about respecting the math, respecting the market, and layering in smart matchup analysis.
If you want to speed up the process, ATSwins gives you the tools: projections, betting splits, player props, and profit tracking. It’s like having a second opinion built on real data instead of guesswork. The longer you use structured processes like this, the sharper you get.
Related Posts
NFL
NFL
Archive?Page=138
Archive?Page=139
Frequently Asked Questions (FAQs)
What is ATSwins and how does it help me bet smarter?
ATSwins is an AI-powered sports prediction platform that provides data-driven picks, props, splits, and profit tracking. Instead of just handing you an opinion, it shows probabilities and edges so you can make informed decisions.
How do I start using ATSwins for daily picks?
Create a free account on ATSwins, log in, and choose your sport. You can filter by spreads, totals, moneylines, or props. Check the projected edges, place your bets, and log them in the platform to track profit and CLV.
What are betting splits and profit tracking in ATSwins?
Betting splits show how tickets and money are distributed across sides. This helps you spot where public money might be heavy or where sharp action could be. Profit tracking logs your actual bets and results so you can measure ROI and see what’s working.
Is the free plan enough, or should I upgrade?
The free plan gives you access to core picks and tools. If you bet more seriously or across multiple sports, the paid plans unlock deeper data, faster updates, and more advanced props.
How should I use ATSwins probabilities before betting?
Always compare ATSwins probabilities to market odds. Only bet when your edge is positive and worth taking. Size your bets responsibly, respect key numbers, and pass if the edge is thin.
Related Posts
AI For Sports Prediction - Bet Smarter and Win More
AI Football Betting Tools - How They Make Winning Easier
Bet Like a Pro in 2025 with Sports AI Prediction Tools
Sources
The Game Changer: How AI Is Transforming The World Of Sports Gambling
AI and the Bookie: How Artificial Intelligence is Helping Transform Sports Betting
How to Use AI for Sports Betting
Keywords:
MLB AI predictions atswins
ai mlb predictions atswins
NBA AI predictions atswins
basketball ai prediction atswins
NFL ai prediction atswins