

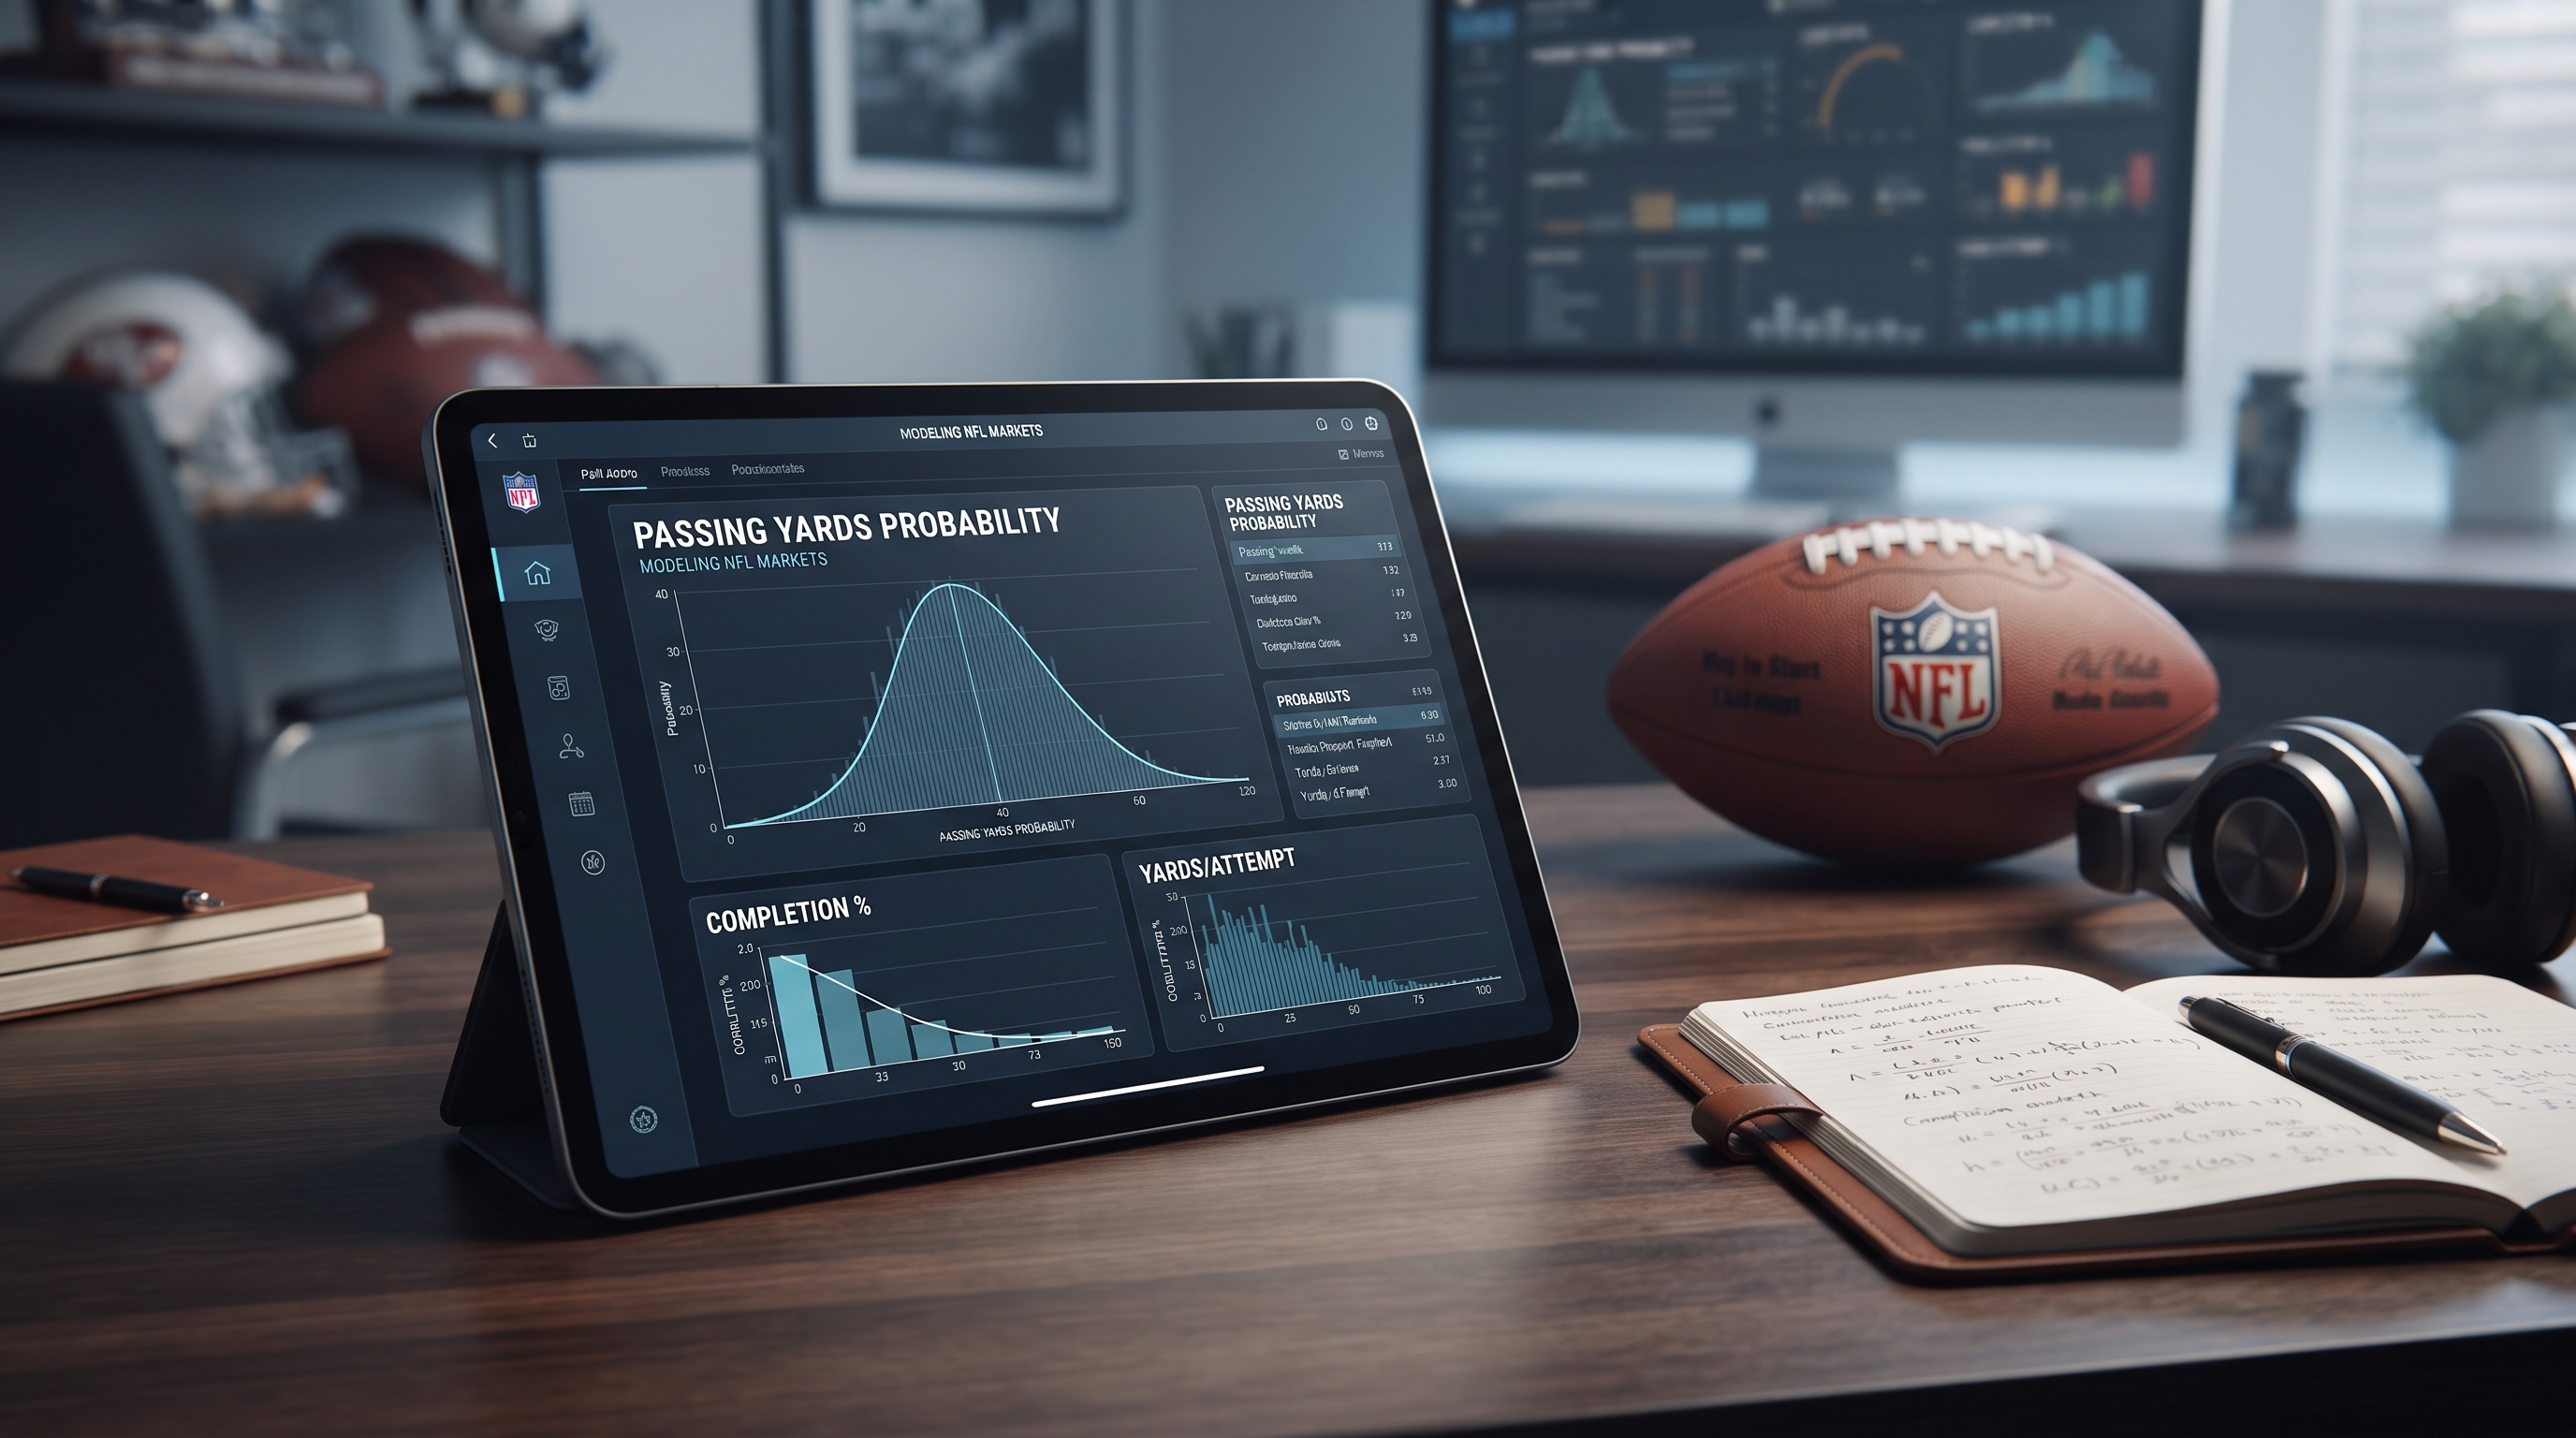
As a professional sports analyst who builds AI models for a living, I break down NFL passing yards props with clear, practical steps every single week. Honestly, when you first get into modeling player props, it feels like trying to drink from a firehose because there is so much noise out there on social media and mainstream sports broadcasts. But once you lock in a solid process, everything changes. We are going to turn raw data into actual projections, spot true value long before the market moves, and manage our bankroll like actual professionals instead of just throwing darts at a board. You can expect plain talk, real examples from my own workflow, and a repeatable process that you can use to sharpen your edge week after week throughout the entire football season.
Key Takeaways
When it comes to pricing value, you have to remember to price value instead of just going off vibes. You want to compare your median projection directly to the book’s line and the price, remove the vig completely, and only ever bet when that edge clears your personal floor, which is usually around three to five percent. What really moves passing yards in the real world is expected attempts and completion accuracy, yards per attempt, the offensive line and receiver health, coverage looks from the defense, plus weather factors like wind in the twelve to fifteen miles per hour range and rain, while constantly updating for late-breaking injuries. To build a simple model first, you project attempts, completions, and yards per attempt, then you simulate for a median and tails, turn that into fair odds, and size your bets small using fractional Kelly sizing or a flat half to one percent to stay steady. Timing and execution are huge because you want to strike early if news likely helps your number, or late when the weather and inactives are completely locked in, and you always cross-check attempts, completions, and the longest completion so your numbers do not clash while tracking your closing line value and notes meticulously. Finally, for our core expertise, ATSwins is an AI-powered sports prediction platform offering data-driven picks, player props, betting splits, and profit tracking across the NFL, NBA, MLB, NHL, and NCAA, where free and paid plans give bettors the insights and guides they need to make smarter and more informed decisions every single day.
Market context and line value
What value means on passing yards props
Value on a passing yards prop is essentially the difference between the price you are being offered by the sportsbook and the true probability that your model assigns to that specific outcome happening. It is never just about your projection versus the book line, because you have to look at the whole distribution. Passing yards are inherently noisy and right-tailed since one single broken play can completely swing the final outcome, meaning the median can sit meaningfully below the mean. If you only line-shop based on simple averages, you are going to miss massive edges or end up on the wrong side of variance over a long sample size. In practice, true value is made up of a projection edge representing your modeled median and percentile bands versus the number the book posts, a price edge representing your fair price versus the vig-adjusted price, and a timing edge representing the likelihood that news, weather, or market microstructure moves the number in your favor before the market closes. Because early search results usually do not hand you a silver-bullet framework for passing yards on a silver platter, we have to lean heavily on primary data and modeling signals like team-level pace, pass rate over expectation, quarterback efficiency, offensive line and receiver health, opponent pressure tendencies, coverage looks, and weather.
Spot soft numbers using projection vs line and price
To spot soft numbers, you always start with an opponent-adjusted projection and simulate a distribution for total yards. From there, you compare the book number to your modeled median, so if the book is sitting below your fiftieth percentile and near your fortieth percentile or lower, the over might actually have real value, whereas if it is sitting up at your sixtieth or sixty-fifth percentile, you are likely looking at a great spot for an under. You also have to check tail fit because books frequently overprice overs purely on player name value. If a listed number sits well above your sixtieth percentile and that quarterback is facing high pressure plus terrible wind, that is a massive red flag. You then convert the book price into an implied probability while accounting for the two-way hold, and compare that directly to your modeled probability so your edge is always the probability delta minus the hold costs. A quick process involves creating a baseline median and seventy-fifth or ninetieth percentiles from simulations, considering an over if the book number is lower than your median by eight to ten yards and your modeled over probability exceeds the no-vig implied probability by three to five percent or more, and considering an under if the book number is higher than your sixtieth to sixty-fifth percentile and the under no-vig edge hits that same three to five percent threshold.
Hold, CLV, and when to bet early vs late
Two-way player props typically carry a four to eight percent hold pregame, which you can compute by converting both sides to implied probabilities and summing them up, with the excess above one hundred percent being the hold. You always want to target situations where your modeled edge clears that friction by a healthy margin. Tracking closing line value, which is your bet line versus the closing line, is crucial because consistent positive CLV is a strong indicator that your process successfully anticipates where sharp money will take the market. When deciding whether to bet early or late, you want to bet early when you expect a line to move due to public steam on star quarterback overs, when you have high-confidence injury news that is not yet fully priced in, when you anticipate the wind to be much worse than consensus is modeling, or when you project pass rate over expectation to rise due to opponent injuries. On the flip side, you want to bet late when there is heavy injury volatility at wide receiver, offensive line, or quarterback, when weather drift is likely since wind and rain forecasts usually firm up twenty-four to thirty-six hours out, or when you need confirmation on a quarterback mobility or playing status that completely changes pressure-to-sack dynamics and scramble rates.
Star-QB bias and public steam
Star quarterback overs get heavily shaded by sportsbooks because casual bettors absolutely love betting overs and backing big-name players. In prime time games especially, you will frequently see numbers hanging a few yards too high. That does not mean unders are automatic bets every single time, but it does mean your threshold to bet an over on a marquee name needs to be significantly higher unless your model clearly shows strong tail upside driven by fast pace, soft coverage mismatches, and clean pockets. Public steam on overs in the middle of the week can often open up prime windows for betting unders late once the weather forecasts finally firm up. Conversely, quietly improving offensive line health or a wide receiver returning to full routes can make early overs extremely valuable before the rest of the market catches up to the reality of the situation.
Data that actually moves passing yards
QB efficiency: EPA per dropback and CPOE
Expected points added per dropback gives you great drive-level value, but for passing yards specifically, you want to weigh carefully how that EPA is actually accumulated, whether through air yards or yards after catch, and whether it comes from explosive plays or steady chain-moving completions. Completion percentage over expected helps you adjust your completion expectations far beyond raw accuracy, especially when quarterbacks face tight windows and heavy pressure. You should always use rolling windows with opponent adjustments and regress those numbers back to career priors when dealing with small samples, blending eight to ten recent games at a sixty to seventy percent weight with long-run priors and opponent context.
Air yards and aDOT
Average depth of target heavily influences yards per completion and overall volatility. A quarterback with a modest average depth of target but wide receivers who excel at creating massive yards after catch can still smash overs or unders depending entirely on opponent tackling and zone shells. You need to track receiver-specific air yards and precise route roles, because if a true lid-lifting wide receiver returns to the lineup, the quarterback baseline aDOT can shift by one to two yards, which moves the distribution tail to the right by ten to twenty yards.
Pressure rate and offensive line health
Pressure rate allowed versus pressure rate generated matters far more than simple sack rates alone because pressure completely disrupts timing and lowers yards per completion unless the quarterback is elite at thriving outside of structure. Offensive line continuity is entirely non-linear, meaning one missing tackle against a top edge rusher can swing pressure by five to ten percent, so you must treat questionable-to-out injury designations as genuinely meaningful on Fridays and game days. If the pressure rate climbs above thirty-five percent and that specific quarterback struggles heavily under pressure with negative EPA and a massive completion percentage over expected dip, you need to push your median projection down by eight to twenty yards depending on the offensive scheme.
WR/TE availability and route share
You can never just look at a player designation and note that they are active. You have to track route participation rates, target rates per route, and alignment. A wide receiver running only sixty percent of routes is effectively operating at a wide receiver three-and-a-half usage level and is frequently capped when it comes to downfield shots. Tight end injuries also ripple heavily into pass protection, since a blocking tight end being out can raise the overall pressure rate, while a receiving tight end being out can severely cut down on middle-of-the-field efficiency against zone defenses.
Opponent coverage shells and man/zone splits
You have to split quarterback performance specifically against man and zone coverages, because some quarterbacks excel against single-high man coverage which yields more explosives, while others feast on spot-drop zones with high completion rates but shorter gains. If your opponent is a heavy two-high safety team that successfully limits explosives and your offense lacks dynamic yards after catch monsters, you should expect lower variance and generally lower median passing yards. You also have to adjust receiver target shares based on coverage, as certain wide receivers beat man coverage at elite rates, while under zone coverage, slot tight ends and running backs often siphon off heavy volume.
Game environment: pace, PROE, spread and total
Team neutral pace and pass rate over expectation versus opponent tendencies are what ultimately drive total pass attempts. A fast neutral pace combined with positive pass rate over expectation on both sides lifts total plays and passing volume significantly. Spread and total shape the game script heavily, since big favorites might lean on the run late while big underdogs get very pass-heavy, though you always have to keep individual coaching tendencies in mind because some coaching staffs remain aggressively pass-first even when playing with a lead.
Venue and weather
Wind starts to bite hard when it reaches sustained levels around twelve to fifteen miles per hour, and once it crosses eighteen to twenty miles per hour, you should pull passing yards down much more aggressively, especially for quarterbacks who rely heavily on the deep ball. Rain lowers explosive play rates, but a steady drizzle with low wind is nowhere near as damaging as gusty conditions. Cold weather on its own is only mildly negative, but extreme cold combined with heavy wind is where the real problems start. Dome versus outdoor splits matter quite a bit, but you should never overfit to them and instead assign modest priors unless they are combined with significant wind.
Sample-size smoothing and recent-games weighting
Using exponential weighting on recent games is a great way to capture current form and injury states, but you must keep strong priors to avoid simply riding random noise. You want to stabilize component rates like attempts per minute of possession, completion probability by depth, pressure-to-sack ratios, scramble rates, and yards after catch over expected, because keeping things simpler is almost always better and avoiding overfit is a silent bankroll killer.
Building projections step by step
Step 1: Forecast attempts from neutral pace and PROE vs opponent
You start by estimating team plays using both teams neutral pace and expected time of possession, which gives you a great baseline. A very practical starting point is taking league average plays and adjusting them for both teams pace ranks, then adjusting plus or minus two to six plays for tempo matchups like fast versus fast or slow versus slow. You then convert plays to pass attempts using pass rate over expectation by starting with the historical neutral rate for the offense, adjusting for whether the opponent is a pass funnel or run funnel, and accounting for the spread since trailing scripts raise pass rates while leading scripts reduce them unless the team is pass-first while ahead. Never forget to factor in kneel-downs, spikes, and sacks when mapping dropbacks to actual pass attempts.
Step 2: Adjust attempts and dropbacks for likely script
You use the market spread and total to weight different script branches across leading, trailing, and tied states. A simple version involves creating three script states, assigning probabilities based on the spread and total such that a six-point underdog trails much more often, and then blending pass rates and pace within those distinct states.
Step 3: Convert to completions using comp% by depth and pressure
You build a completion model that is conditioned on specific depth buckets like zero to five, six to ten, eleven to fifteen, and sixteen plus air yards, along with pressure versus clean pocket splits and coverage tendencies if your data supports it. If you happen to lack granular depth data, you can simply adjust global completion percentage for the pressure delta and the opponent pass defense success rate.
Step 4: Choose YPA or yards per completion from opponent-adjusted baselines
There are two very workable paths here, including a yards per attempt model conditioned on pressure, coverage, and average depth of target, or a yards per completion model with completion probability upstream. You blend in receiver yards after catch profiles because teams with high yards after catch over expected can easily maintain strong yards per attempt under two-high zones by hammering crossing routes and quick screens.
Step 5: Simulate a distribution (Monte Carlo or bootstrapping)
You represent pass attempts as a distribution using Poisson or normal models with caps and tilts based on the game environment. You draw completion outcomes from Bernoulli trials conditioned on depth and pressure, assign yards to each completion from log-normal or gamma-like distributions per depth bucket with receiver yards after catch variance, and include sacks and scrambles which siphon off dropbacks since scrambles do not add passing yards and often reduce attempts under pressure. Running twenty thousand to fifty thousand trials lets you capture the fiftieth, sixtieth, seventy-fifth, and ninetieth percentiles and the full cumulative distribution function at the book number.
Step 6: Compare to book number and vig to compute fair odds and edge
You convert American odds to implied probabilities and then remove the hold. For a two-way market, you compute implied probabilities for both the over and the under, normalize them so they sum to one hundred percent, and get your true no-vig probabilities. Your fair probability is simply your model probability of the over occurring at the posted yards line. Your edge is your fair probability minus the no-vig implied probability for the over in the case of an over bet, and similarly for unders. A simple threshold means you play if the edge is at least three to five percent and you are not sitting at a terrible number where you are chasing a four to six yard move, while tightening your threshold for high-variance quarterbacks or when the hold is unusually high.
Step 7: Size with fractional Kelly and cap exposure across correlated legs
Using fractional Kelly sizing, such as a quarter to half Kelly, helps stabilize bankroll swings significantly. For even-money equivalents, the Kelly fraction is roughly your edge divided by the fractional odds. A practical bettor version means taking a small edge of three to four percent and betting a quarter to a half percent of your bankroll, taking a medium edge of five to seven percent and betting half a percent to one percent, and taking a larger edge of eight to ten percent or more and betting one to one and a half percent, though you should rarely bet more than that on a single prop. You also have to cap your exposure across correlated markets so you do not max out a quarterback over yards bet alongside two wide receiver overs tied directly to that exact same passing volume, spreading your risk across independent angles or laddering lightly instead.
A lightweight template you can reuse
Before you place any bet, you should always fill out a quick template covering your projected attempts range from the tenth to ninetieth percentiles, your expected pressure rate versus the season baseline, receiver availability and route caps, coverage expectations for man or zone and single-high or two-high shells, weather notes covering sustained wind, gusts, temperature, and precipitation, your modeled percentiles for yards, the book number and price, the no-vig implied probability, your modeled probability at that book number, your calculated edge, your suggested stake using fractional Kelly sizing, and specific notes on your timing rationale for betting early or late.
Cross-checks, timing and execution
Validate against related props to avoid double counting
If you are playing a yards over but your attempts model leans under, you need to make sure your yards per attempt assumptions are not overly rosy. You can definitely win with high efficiency, but any misalignments need to be completely intentional. A high completion over with a yards passing under often signals a very low average depth of target or severe weather constraints, which might be right for certain quarterbacks, so you must confirm that with coverage and wind data. A bullish longest-completion over paired with a yards under might contradict unless you expect one single splash play and a lot of stalled drives. If you like a wide receiver over and a quarterback under simultaneously, you need a strong concentration hypothesis where the alpha wide receiver hogs targets while the rest of the offense completely fails.
Monitor news, inactives, and line moves
Wide receiver and tight end inactives along with snap expectations completely change average depth of target and completion rates, and a wide receiver listed as active but limited often depresses deep pass attempts. Final offensive line statuses are also absolutely crucial, and Friday downgrades to out at the tackle or center positions should immediately move your pressure input. You must track line moves throughout the week and avoid betting the worst of a number when you can easily anticipate the direction. If a star quarterback over is steaming on Thursday without any supportive data like offensive line or wide receiver boosts or a favorable pace angle, you might want to wait and attack an inflated under late Saturday night or Sunday morning.
Prefer sharper markets for closing signal
If you happen to have access to sharper sportsbooks or betting exchanges where legal, you should let those prices heavily inform your direction and magnitude because soft books will frequently lag behind. For passing yards specifically, certain books are much quicker at adjusting for weather, while others are slower to react to offensive line and wide receiver status changes, so you should build a habit list of which books excel in which areas.
Use ATSwins tools and tracking
Leveraging advanced model outputs and betting splits helps you understand exactly where public money sits versus your modeled edges, and public-heavy overs in windy games are almost always prime fade candidates. You should log every single play with your stake size, book number, and closing line so that over time, your closing line value profile and realized performance will spotlight which inputs are driving profitable decisions and which are just pure noise. A simple place to centralize your picks, results, and trend views is right on the ATSwins dashboard, and if you are brand new to the platform, you can start directly at the ATSwins home page.
Validation and tracking
Backtest prior seasons out of sample
You want to freeze your feature set and hyperparameters, then simulate weekly markets from a prior season or multiple seasons without letting later injuries or depth chart knowledge bleed into the past. You need to validate calibration by checking if your model says a fifty-five percent over hits near fifty-five percent historically, keeping it honest by reporting under and over splits separately since the market and public bias differ heavily by side. You must also avoid regime leakage because NFL passing environments constantly shift due to rule changes, the prevalence of two-high shells, and quarterback mobility, meaning you should use the most recent three to four seasons while weighting the last two years much heavier.
Use calibration plots and error metrics
Calibration plots let you bin your over probabilities into deciles and compare them against observed frequencies so you can adjust your model temperature if you are being overconfident. Score quality can be measured using Brier scores for binary over and under outcomes, or log loss if you want to punish overconfidence much harder. You should also check yardage error by percentile to compare median and tail errors, and if your tails are off, you need to revisit your yards per completion distribution and explosive play modeling.
Monitor error by QB archetype and conditions
Pocket distributors with low scramble rates rely heavily on offensive lines and timing against zone coverages, whereas scramblers and creators do not always see reduced yards under pressure because pressure sometimes shifts into off-script explosives where completion percentage drops but yards per attempt stays afloat or rises. Big-arm vertical quarterbacks are heavily sensitive to wind and two-high shells, so if your errors spike below the twelve to fifteen mile per hour wind threshold, you are likely over-penalizing them. If you underpredict yards against blitz-heavy teams for quarterbacks who love to punish the blitz, you should add a blitz-specific efficiency adjustment.
Iterate features, not stakes
You must keep your staking rules completely stable while you tinker with your model, because if you change both the model and the bankroll plan at the exact same time, you will never actually know what helped or hurt your bottom line. You should add one feature at a time, such as wide receiver route depth adjustments after injuries, offensive line continuity penalties, or coverage-specific target share shifts, and document the deltas in your closing line value and hit rate for at least three to four weeks of slates before drawing any final conclusions.
Helpful tools, data sources, and practical templates
Where to get data that matters
For play-by-play data and expected points added, platforms that provide robust play-level data for EPA and success rates are invaluable. For historical splits and game logs, detailed quarterback game logs, weather tags, and drive summaries are essential. For route details, air yards, and player tracking intelligence covering route charts, separation, time to throw, and pressure-to-sack dynamics, tracking platforms provide great depth. For pass rate over expectation and opponent defensive efficiency, tracking situational EPA and success splits along with opponent tendencies helps immensely. For actionable weather forecasts including sustained wind, gusts, and precipitation near the stadium locale, official meteorological services provide the best hourly forecasts.
A quick-check spreadsheet structure
Your spreadsheet should include inputs for team neutral pace ranks for both offense and opponent, offense pass rate over expectation trends, opponent pass and run funnels, quarterback efficiency metrics like EPA per dropback and completion percentage over expected, average depth of target trends, offensive line health including starters in or out and estimated pressure deltas, opponent pressure rates, wide receiver and tight end statuses, route share expectations, coverage expectations for man and zone splits, weather data covering wind, precipitation, and temperature, venue types, and market spreads and totals. Your calculation engine should estimate plays, build an attempts distribution, run a completion model, calculate yards per completion by depth, and execute twenty thousand plus Monte Carlo runs storing yards per trial. Your outputs should display medians, seventy-fifth and ninetieth percentiles, means, over probabilities at the book number, no-vig implied probabilities, edges, suggested stakes using fractional Kelly sizing, and data-risk flags for injury volatility, weather uncertainty, or offensive line unknowns.
Game-week workflow that scales
On Mondays, you load your priors, initial pace and pass rate over expectation estimates, and baseline yards distributions, while noting key injury watchlists for quarterback hands or shoulders, wide receiver hamstrings, or offensive line ankles. On Tuesdays and Wednesdays, you integrate practice reports, update wide receiver route expectations and offensive line statuses, and pull early weather reports so that if midweek wind flags exceed fifteen miles per hour, you can mark those games for late execution. On Thursdays and Fridays, you re-run simulations with much firmer injury tags, identify edges that are likely to move, and decide your bet timing based on whether the market is likely to steam your way or if you need final confirmations. On Saturday nights and Sunday mornings, you check final weather reports, inactives, and offensive line confirmations, place your remaining bets while ensuring you are not taking the worst of a number, and log your stakes and screenshot the lines for closing line value tracking.
Practical edges that show up often
Weather mispricing and late wind drift
Sportsbooks do a decent job adjusting for wind, but they never do it completely uniformly. Sustained winds of fifteen to twenty miles per hour with gusts over twenty-five in outdoor venues should knock down average depth of target and completion rates quite a bit, especially on sideline and deep throws. If the market number has not moved by Sunday morning, unders can carry an extra two to four percent edge that you can exploit.
OL downgrades that fly under the radar
A last-minute tackle scratch can instantly lift pressure by five to ten percent and drastically change time-to-throw metrics, meaning you should downgrade quarterback yards by eight to twenty or more yards depending on their individual pressure splits and depth of target, as books will not always move the line enough to compensate.
Coverage mismatches vs team identity
Defenses that heavily deploy two-high safety shells can force quarterbacks into throwing underneath constantly. If your passing yards projection heavily depends on explosive plays and your offense lacks dynamic yards after catch weapons, you need to be very careful betting overs even when the total pass attempts look exceptionally healthy.
Public overs on stars in televised windows
Prime time overs on star quarterbacks frequently ride five to ten yards too high in the market. If the weather is completely neutral but the opponent generates heavy pressure without needing to blitz, you should look hard at the under or simply pass on the game unless your simulation shows genuine tail upside driven by a fast-paced shootout.
Tying it back to ATSwins modeling and workflow
Using AI outputs plus betting splits, then deciding when to fire
I always start my process with AI-powered projections for pass attempts and yards per attempt that incorporate pace, pass rate over expectation, pressure, coverage, and weather features. This underlying framework functions much like a sophisticated sports probability engine, crunching vast amounts of variables to establish accurate baselines. Then I overlay betting splits, and if the public is leaning extremely hard on the over for a star quarterback without any supportive input moves like offensive line or wide receiver upgrades, I will hesitate on backing the over. The ATSwins platform picks, player props, and tracking tools help close that loop entirely. I log every single wager with its stake, number, closing line value, and final result so I can grade not just the winners and losers, but my actual betting process. You can centralize this workflow very quickly right at ATSwins, and if you are looking to dive deeper, you can head over to ATSwins to get started.
A checklist before you click submit
Before you ever click submit on a bet, you need to ask yourself if your attempts distribution properly aligns with pace, pass rate over expectation, and the spread. You need to verify if you accounted for sacks and scrambles reducing attempts, whether your pressure and coverage adjustments were applied once rather than twice, and whether your wide receiver and tight end route shares accurately reflect current health status and coaching notes. You should check if the weather is properly handled by prioritizing wind first and rain second, what the no-vig implied probability is at the book number, what your modeled probability and edge actually are, and what exact stake fractional Kelly sizing suggests while making sure you are capping your correlated exposure.
Small but important modeling notes
Don’t overfit to last week
If a quarterback threw for three hundred and fifty yards last game purely because of blown coverages and yards after catch explosions, you should never blindly drag your median projection up by twenty yards without underlying foundational changes in the metrics. You always want to blend recent form carefully with long-run priors.
Treat distributions with care
Passing yards are never symmetric, meaning the right tail matters immensely. You should use log-normal or empirical distributions derived from play-level samples rather than relying on lazy normal approximations that miss extreme outcomes.
Use opponent-adjusted baselines
An eight yards per attempt performance against a blitz-heavy unit that constantly gives up crossing routes is fundamentally not the same as an eight yards per attempt performance against a two-high shell that strictly caps all explosives, so you must always contextualize your means.
Remember substitution effects
If a wide receiver one sits out and a wide receiver two steps into that role, opposing defenses will game plan for him accordingly. While his individual target share may rise, his per-target efficiency can often drop significantly when he is matched up against a team's top cornerback with safety help over the top.
How to sanity check with public markets and your own lines
Cross-market triangulation
You should always compare quarterback passing yards against team totals and spreads, because a very low team total paired with an aggressively high quarterback yards line can easily signal a fragile over that is entirely dependent on meaningless garbage time production. You should also check wide receiver, tight end, and receiving lines, because if three different pass catchers are all individually lined near their sixty-sixth percentile while the quarterback passing yards line sits at the fifty-fifth percentile, someone's model is completely out of whack. If a longest-completion prop is priced like a heavy shot-play game but the total yards line has not budged, early yards overs can possess some serious tail upside.
Market signals to respect
You should always respect fast steam at sharper sportsbooks on unders when bad weather hits outdoor venues. You must also respect significant line moves that happen immediately after offensive line downgrades, especially when they occur at critical positions like tackle or center. If you notice a conservative drift downward on game totals that significantly outpaces the adjustments made to passing yards props, it usually means the player props are lagging behind the true market movement.
Putting it all together: a short example
To see how all of this works in practice, let us walk through a short example. Imagine an offense that ranks eighth fastest in neutral pace while their opponent ranks fourteenth, with the offense posting a plus five percent pass rate over expectation over their last five games and facing an opponent who acts as a clear pass funnel. The market spread is plus two and a half with a total of forty-seven and a half points. The quarterback boasts positive EPA per dropback and completion percentage over expected with an average depth of target of eight point seven yards over his last five games. However, the offensive line suffers a blow when the left tackle is listed as questionable and later ruled out, while the opponent ranks fifth in pressure rate using just a four-man rush and plays heavy two-high safety coverages. Furthermore, the wide receiver one is returning to full routes while wide receiver two is limited to seventy percent route participation, and the weather forecast calls for thirteen to sixteen mile per hour winds with a light drizzle in an outdoor stadium.
Building out the process, our plays baseline sits around sixty-four to sixty-six plays, giving us pre-injury attempts of thirty-four to thirty-seven. After factoring in the left tackle being out and confirming the heavy wind, our adjusted pass attempts drop to thirty-three to thirty-five, completion percentage drops by one to two percent, and yards per completion decreases by zero point four to zero point six yards. Running our simulation gives us a fiftieth percentile median of two hundred and forty-six yards, a seventy-fifth percentile of two hundred and eighty-four yards, a ninetieth percentile of three hundred and eighteen yards, and a mean around two hundred and fifty-nine yards. The sportsbook opens the number at two hundred and fifty-seven point five at minus one-and-ten for both sides midweek, but by late Sunday morning, the wind news pushes the over down to minus one-and-five while the under stays at minus one-and-ten. Our model gives the probability of going over two hundred and fifty-seven point five yards at roughly forty-seven point five percent, with the no-vig over sitting near forty-nine point five percent at the adjusted split. Our calculated edge on the under sits at forty-nine point five percent no-vig under versus fifty-two point five percent model under, giving us a solid three percent edge. Looking at the decision, we pass on the over because there is zero edge, and we consider a small under play at minus one-and-five given the three percent edge, though we cap our stake due to variance and the return of the team's top wide receiver. If the line happens to drift up to two hundred and sixty-one point five yards by Sunday morning, we recheck and see the under edge rises to five or six percent, making it a much cleaner and more attractive play.
Final reminders that save bankroll over a season
Respect wind and OL more than buzz
Never let mainstream media buzz pieces about a quarterback being ready to bounce back cloud your judgment, because talk will never change actual pressure rates or wind gusts. Your analytical model should always dictate your stance.
Keep stakes small during high-uncertainty windows
If wide receiver and offensive line statuses are completely murky leading up to kickoff, you should either wait for absolute clarity or size down your wagers significantly. A half-sized bet backed by better information will always beat a full-sized bet made with flawed or missing inputs.
Track everything, especially CLV
A full season worth of closing line value and outcome logs will teach you infinitely more than gut hunches ever will. If your calculated edges do not consistently translate into positive closing line value over time, you need to revisit your foundational assumptions immediately.
Use reliable, advanced resources
For data and splits, play-level tracking platforms provide great depth. For historical logs and context, professional football reference pages work wonders. For tracking and route intelligence, advanced tracking systems give you the exact edge you need. For pass rate over expectation and defensive efficiency, situational data hubs keep your numbers clean. And for official weather metrics, meteorological services give you exact wind and rain data. When you need to organize all of your picks, edges, and outcomes in one central location while seeing exactly where AI and the market disagree, keep a window open with ATSwins.
Conclusion
Finding true value in passing yards props comes down to building tight projections versus the posted number, focusing relentlessly on the real underlying drivers like pass attempts, completion accuracy, and yards per attempt, and mastering your timing around news, weather, and price movements. The key points to remember are to always model first, double-check your signals, and manage your risk like a professional. When you want to take your sports betting to the next level and make sharper bets, use ATSwins, because ATSwins brings elite expertise through its AI-powered platform packed with data-driven picks, player props, betting splits, and profit tracking across the NFL, NBA, MLB, NHL, and NCAA, complete with flexible free and paid plans designed for every bettor. Whether you are scaling an nfl player prop edge finder workflow or experimenting with alternative angles like an ai baseball game analysis model for summer slates, having a structured approach changes everything.
Frequently Asked Questions (FAQs)
What does how to find value in passing yards props actually mean?
Finding value in passing yards props means your personal projection for a quarterback passing yards total is significantly better and more accurate than the sportsbook posted number and price. When I talk about how to find value in passing yards props, I am comparing my forecasted median and full distribution directly to the posted betting line, and then checking the vig to determine whether the odds being offered are genuinely fair. If my model indicates that two hundred and seventy-five point five yards represents a fifty-five percent probability of hitting the under, but the book is pricing it as a coin flip, that discrepancy represents real value. It is never about magic, but rather strict price versus projection followed by disciplined execution, where you track your closing line value to confirm you are consistently beating the market over the long run.
What data should I use for how to find value in passing yards props?
You always want to start with pass attempts, completion accuracy, and yards per attempt, since those three core metrics drive almost everything else. For how to find value in passing yards props, I focus heavily on team pace and pass rate over expectation, quarterback efficiency metrics like expected points added per dropback and completion percentage over expected, pressure rates relative to offensive line health, receiver availability, and opponent coverage splits for man and zone. You also need to add broader game context like the spread and total, likely game scripts, dome versus outdoor splits, wind speeds since twelve to fifteen miles per hour can alter things drastically, and rain. Building a simple projection involves estimating attempts from pace and pass rate over expectation, converting them to completions using completion percentages adjusted for pressure, picking yards per attempt from opponent-adjusted baselines, and multiplying them out while keeping things simple before adding advanced layers.
When should I time my bets for how to find value in passing yards props early or late?
Timing is a critical component of how to find value in passing yards props. I usually place my bets early when I have supreme trust in my read on passing volume driven by pace and pass rate over expectation, and I expect the market to move in my direction, such as when a key wide receiver returns to full practice participation or an offensive line stabilizes. I wait until late when there is weather volatility and lingering inactives, because high winds and surprise late scratches can drastically swing passing attempts and efficiency. Public bias can also push star quarterback overs too high on game day, meaning you can often secure much better under numbers if you simply wait until closer to kickoff. As a general rule of thumb, you follow news first, weather last, and never chase market steam unless your underlying projection still shows a clear, actionable edge.
How do I price and size bets for how to find value in passing yards props?
To successfully practice how to find value in passing yards props, you need to convert your mathematical projection into an exact probability of an over or under occurring, and then translate that into fair odds. You compare that fair price to the posted price after completely removing the vig, and if your calculated edge is real, you size your bets small and steady using fractional Kelly sizing or a flat half to one percent of your total bankroll. You should always cross-check your projections with related prop markets like attempts, completions, and longest completion, because if all of those related markets point in the exact same direction, your overall confidence rises. You must log every single wager alongside your personal number and the closing line, treating your closing line value as your ultimate feedback loop, and you should never scale your stakes based purely on emotional vibes because math always wins out over time.
How can ATSwins.ai help with how to find value in passing yards props?
ATSwins.ai is an advanced AI-powered sports prediction platform built specifically to support how to find value in passing yards props without having to rely on blind guesswork. The platform offers comprehensive data-driven picks, player props, betting splits, and profit tracking across the NFL, NBA, MLB, NHL, and NCAA, featuring both free and paid plans tailored to different bettor needs. I regularly use its intuitive dashboards to sanity-check my quarterback projections, monitor live market movements and betting splits, and track my ongoing performance broken down by team, player, and bet type. While you still have to make the final betting call yourself, utilizing professional tools like charts, alerts, and detailed logs makes the entire analytical process much faster and cleaner. You can try it out directly at https://atswins.ai, because it is practical, highly reliable, and helps you stay completely organized when betting lines start moving at lightning speed.