

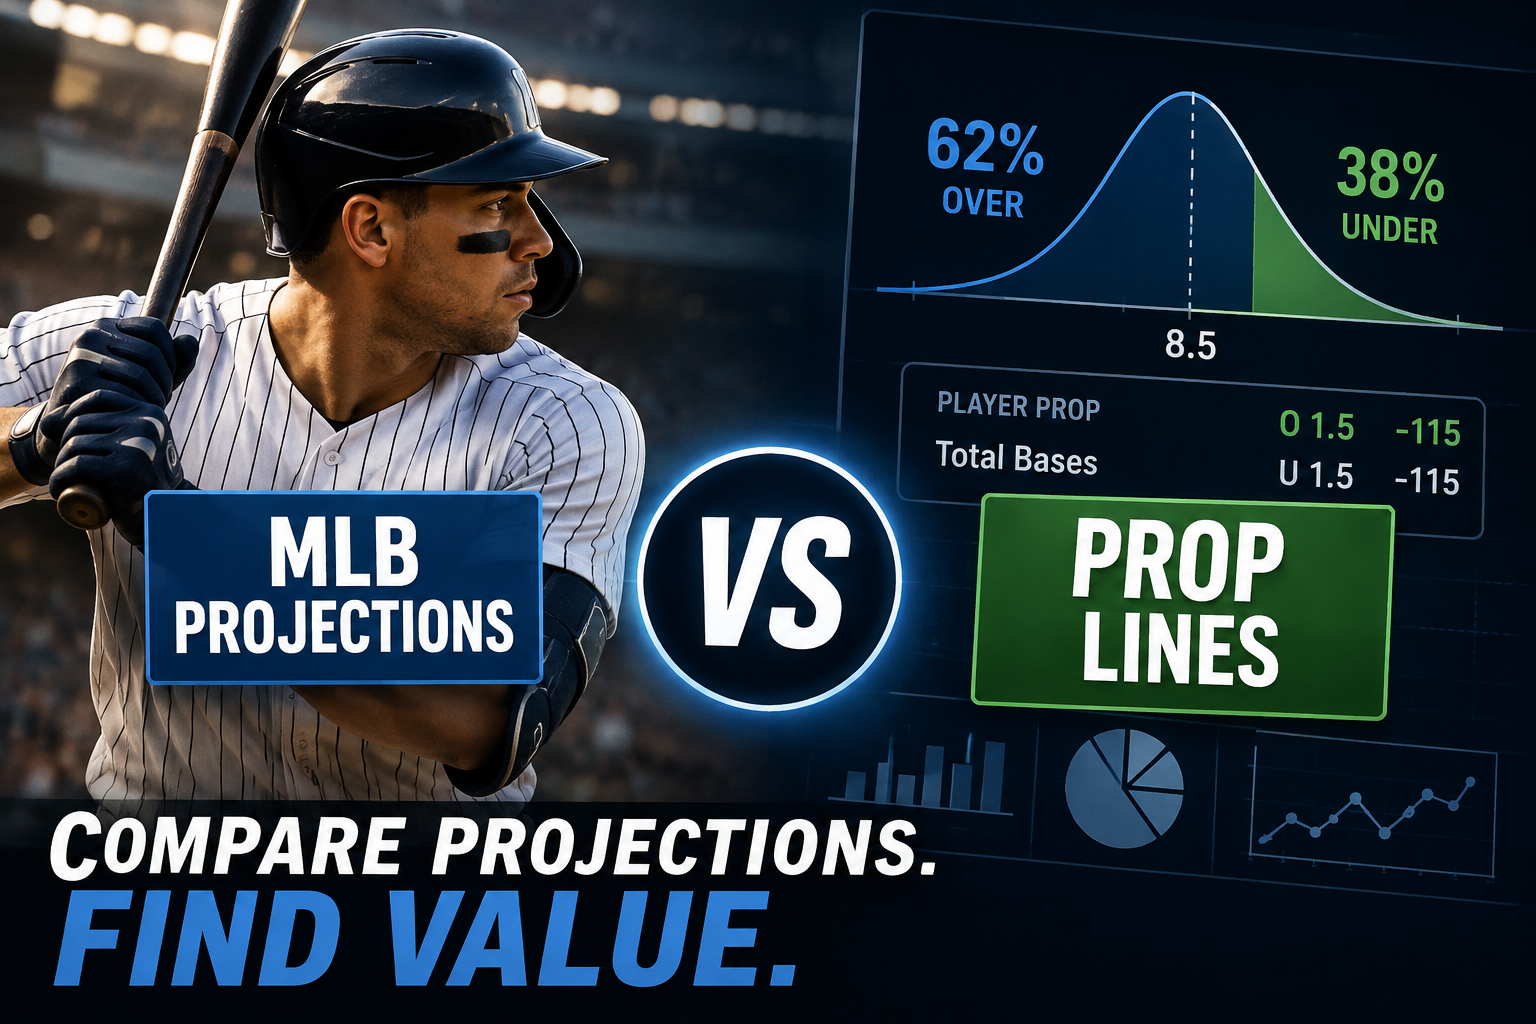
An MLB projection and a player prop line are not the same thing. A projection estimates what a player is expected to produce, while a prop line sets a threshold for an outcome such as strikeouts, hits, total bases, runs, RBIs, or home runs.
To compare them properly, you need more than checking whether the projected number is higher or lower than the line. The more useful approach is to look at the projection, estimate the probability of reaching the prop threshold, compare that probability with the available price, and then consider how much uncertainty surrounds the model.
That distinction matters because baseball outcomes are highly variable. A hitter projected for 1.7 total bases does not automatically make an over 1.5 total-bases prop attractive. The player's expected plate appearances, opposing pitcher, ballpark, lineup position, weather, and the distribution of possible outcomes all influence the analysis.
The goal is not to find certainty. It is to determine whether a projection and a prop line tell different stories, and whether that difference is large enough and reliable enough to deserve attention.
Table of Contents
Projection vs. Prop Line: What Is the Difference?
How to Compare an MLB Projection With a Prop Line
Why Probability Matters More Than the Projection Average
A Practical MLB Prop Example
What Should an MLB Projection Include?
Why Recent Form Can Be Misleading
Common Mistakes When Comparing MLB Projections and Props
How ATSwins.ai Fits Into MLB Projection Analysis
Projection Difference vs. True Analytical Edge
How New Information Can Change a Prop Projection
Build the Comparison Around Price and Probability
Frequently Asked Questions
Projection vs. Prop Line: What Is the Difference?
An MLB projection is an estimate of a player's future performance. A prop line is a threshold that separates two possible outcomes.
Imagine a starting pitcher projected for 5.4 strikeouts with a prop line of 4.5. At first glance, the projection appears to favor the over. However, 5.4 strikeouts is an expected value. It does not mean the pitcher is guaranteed to record at least five strikeouts.
The pitcher could finish with two strikeouts, four strikeouts, five strikeouts, seven strikeouts, or another result entirely.
This is why probability is so important.
If a model projects a pitcher for 5.4 strikeouts and estimates that the pitcher has a 63% probability of recording at least five, that probability is much more useful when comparing the projection with a 4.5 strikeout prop.
The same concept applies to hitter props.
A projection of 1.8 total bases does not mean there is an 80% chance of reaching two or more total bases. A projection of 0.4 home runs does not mean the player has a 40% chance of hitting a home run.
The average and the probability are different pieces of information.
Modern MLB analytics also provides more detailed data for building projections. MLB's Statcast system tracks pitch, hit, player, and bat information, while Baseball Savant provides access to metrics such as expected batting average and expected weighted on-base average.
Those inputs can give projection models more information than traditional box-score statistics alone.
How to Compare an MLB Projection With a Prop Line
The first step is making sure the projection and prop line are measuring exactly the same statistic.
A strikeout projection should be compared with a strikeout prop. A total-bases projection should be compared with total bases. A hits projection should be compared with a hits line.
This sounds simple, but it is an important distinction. Different prop markets can combine multiple statistics, and their probability distributions can be very different.
Once the statistics match, compare the projected value with the line.
For example, suppose a model projects a pitcher for 5.4 strikeouts and the prop line is 4.5. The projection is 0.9 strikeouts above the line.
That difference is useful as an initial signal.
However, it should not be treated as the final answer.
The next question is much more important: How frequently does the model expect the pitcher to finish above 4.5?
Because the line is 4.5, the relevant outcome is five or more strikeouts. A model therefore needs to estimate the probability of reaching at least five.
This is where simulations and probability distributions become useful.
Instead of producing only one number, a forecasting system can generate many possible outcomes based on its assumptions. If a large share of those simulated outcomes reach five or more strikeouts, the model has a stronger case for the over than it would if the outcomes were concentrated below the line.
The final step is comparing that probability with the market price.
Why Probability Matters More Than the Projection Average
One of the biggest mistakes when analyzing MLB props is assuming that the projected average tells you everything you need to know.
Imagine two pitchers who are both projected for 5.2 strikeouts against a 4.5 line.
They have the same projected average, but their distributions could be completely different.
The first pitcher might have a relatively stable workload and consistent strikeout rate. His model outcomes could cluster around four, five, and six strikeouts.
The second pitcher might have a much wider range of possible innings because of workload concerns or an uncertain pitch count. His outcomes might range from two strikeouts to eight with much greater variation.
Both pitchers have the same 5.2 projection, but they do not necessarily have the same probability of going over 4.5.
This is why comparing the projection alone can be misleading.
The projection represents the center of the forecast. The prop line asks how much probability exists on one side of a specific threshold.
That difference becomes particularly important for volatile statistics.
Home runs are a good example. A player might have a relatively modest expected home-run total for one game while still having meaningful probability of hitting one.
Hits and total bases can also be difficult because a single plate appearance can dramatically change the result.
Pitcher strikeouts have their own sources of variance. Expected innings, pitch count, opponent strikeout tendencies, pitch mix, and game conditions can all influence the final outcome.
A serious projection process therefore needs to account for the distribution of possible outcomes rather than relying only on a single projected number.
How to Compare the Projection With the Odds
Once you have a probability estimate, the next step is evaluating the price.
Suppose a model estimates that a pitcher has a 58% probability of going over a strikeout prop.
If the available odds imply a probability of only 50%, there is a meaningful difference between the model estimate and the market price.
But that does not automatically mean the model is correct.
The market's implied probability is calculated from the posted odds. For positive American odds, the basic calculation is 100 divided by the odds plus 100.
For negative American odds, the calculation uses the absolute value of the odds divided by the absolute value of the odds plus 100.
For example, +120 corresponds to an implied probability of approximately 45.5%.
Odds of -120 correspond to approximately 54.5%.
These figures represent raw implied probabilities and do not account for the sportsbook's margin.
That distinction matters because a model probability and an implied probability are not automatically equivalent measures.
The model estimates what it believes will happen. The market price reflects the terms being offered.
The analytical question is whether the model's estimated probability is sufficiently different from the probability implied by the available price, and whether the model has good reasons for making that estimate.
A Practical MLB Prop Example
Consider a hypothetical starting pitcher facing an opponent with a relatively high strikeout tendency.
Suppose the model projects the pitcher for 5.7 strikeouts, while the available prop line is 4.5.
The projection is clearly above the line.
Now suppose the model estimates a 62% probability that the pitcher records at least five strikeouts.
The over is priced at -115.
At -115, the raw implied probability is approximately 53.5%.
That means the model estimate is roughly 8.5 percentage points higher than the probability implied by the price.
This is the type of situation that deserves further analysis.
It does not mean the outcome is guaranteed, and it does not mean the model has discovered an automatic advantage.
The analyst should investigate why the model is producing a 62% probability.
Expected innings are particularly important for pitcher strikeout props. A pitcher who is projected to work six or seven innings has more opportunities to accumulate strikeouts than one expected to leave after four or five.
The opponent's strikeout tendencies also matter.
The pitcher's own strikeout rate matters as well, but the matchup can influence how frequently those strikeouts occur.
Lineup confirmation is another important factor.
Suppose two of the opposing team's highest-strikeout hitters are removed from the lineup after the initial projection is created. The model may need to reduce its strikeout estimate.
The original 5.7 projection could become 5.1, while the probability of reaching five or more strikeouts might fall from 62% to 55%.
The prop line might not move immediately.
That example illustrates why projections should be treated as dynamic estimates rather than permanent numbers.
What Should an MLB Projection Include?
A useful MLB projection should consider more than a player's most recent box-score results.
For hitters, the expected number of plate appearances is critical.
A player batting first or second may receive more opportunities than a player batting eighth or ninth. A projection that ignores expected plate appearances can therefore misrepresent a player's chance of reaching a counting-statistic prop.
The opposing pitcher also matters.
Pitcher handedness, strikeout ability, pitch selection, contact allowed, and recent workload can influence the expected result.
Ballpark conditions can matter as well.
Certain environments are more favorable for offense, while others can suppress specific types of production. Weather can also influence run-scoring conditions and the behavior of the baseball.
For pitchers, expected innings are one of the most important variables.
Strikeout rate alone is not enough. A pitcher with an excellent strikeout rate but a short expected outing may have less opportunity to reach a high strikeout prop than a pitcher with a slightly lower strikeout rate who is expected to work deeper into the game.
Opponent quality matters too.
A lineup with a high strikeout rate creates a different projection environment from a lineup that consistently puts the ball in play.
A strong projection model therefore combines player skill with expected opportunity and matchup conditions.
Why Recent Form Can Be Misleading
Recent performance is tempting to use when evaluating player props.
A pitcher might have recorded eight or nine strikeouts in consecutive games. A hitter might have produced multiple hits in several straight contests.
Those results are relevant, but they are not automatically predictive of the next game.
Small samples contain substantial noise.
A player's recent results can be influenced by opposing pitchers, defensive positioning, ballpark conditions, random variation, and unusually favorable or unfavorable batted-ball outcomes.
That does not mean recent information should be ignored.
Instead, it should be combined with a larger sample and more stable indicators.
A projection model can give greater weight to recent information without allowing a handful of games to completely override the player's established skill level.
This is particularly important when comparing a model with a prop line.
If a projection is based heavily on a tiny recent sample, the apparent difference from the market may not be as meaningful as it first appears.
Common Mistakes When Comparing MLB Projections and Props
One common mistake is treating the projection average as the probability.
A 1.8 total-bases projection does not mean an 80% chance of reaching two total bases.
Another mistake is ignoring the odds.
A projection can favor an over while the price attached to that over is too expensive to justify the model's probability.
Stale projections are another problem.
MLB lineups, starting pitchers, injuries, weather conditions, and playing-time expectations can change quickly. A projection generated before an important update may no longer represent the most likely game environment.
Overweighting recent results is also dangerous.
Three or five games can create an interesting trend, but that trend does not necessarily represent a genuine change in player skill.
Playing time is another major consideration.
A hitter's expected production per plate appearance is only part of the equation. If the player is projected for four or five plate appearances but actually receives only three, the counting-statistic distribution changes substantially.
Finally, do not assume that a disagreement between a projection and a market line automatically represents an advantage.
The market may have information that the model does not.
The model may also contain errors in its assumptions or data.
The disagreement should therefore be treated as an analytical question.
Why does the model disagree with the line?
That question is often more useful than simply asking which side is higher.
How ATSwins.ai Fits Into MLB Projection Analysis
ATSwins.ai is focused on sports forecasting, statistical modeling, simulations, player projections, probability analysis, and market evaluation.
That makes comparing projections with prop lines a natural application of a data-driven forecasting framework.
The important idea is that a player projection should not be viewed in isolation.
An analyst can begin with a projected statistic, compare it with the market threshold, estimate the probability of clearing that threshold, and then consider the available price.
The model's uncertainty should remain part of the process.
ATSwins.ai's existing MLB analytics coverage also discusses AI-based baseball predictions and the relationship between predictive models and market information.
This approach is more useful than simply identifying the biggest numerical difference between a projection and a prop.
A projection that is one full unit above a line may appear more attractive than one that is only 0.3 units above it. But if the first projection has much greater uncertainty, the smaller difference could potentially represent the more meaningful signal.
Model calibration also matters.
If a system consistently labels events as 60% probabilities but those events occur only 50% of the time, the model is poorly calibrated even if some individual predictions look impressive.
That is why serious sports analytics should evaluate both predictive performance and probability quality.
Projection Difference vs. True Analytical Edge
There is a useful distinction between a projection difference and an analytical edge.
A projection difference simply tells you that the model's expected value is different from the market threshold.
For example, a 5.6 strikeout projection against a 4.5 line produces a difference of 1.1.
An analytical edge requires more.
You need a probability estimate, a price, confidence in the underlying data, and some reason to believe the model is appropriately calibrated.
This distinction protects analysts from becoming overly dependent on large projection gaps.
Suppose one model projects a hitter for 2.1 total bases while another projects 1.6.
The first model may appear to offer a major difference against a 1.5 line. But if its projection depends heavily on a small sample or questionable playing-time assumption, the difference may not be meaningful.
Agreement between multiple reasonable models can provide useful context.
So can sensitivity analysis.
If a projection remains above the line when expected plate appearances, pitcher quality, and weather assumptions are changed modestly, the forecast may be more stable.
If the projection falls sharply after a small adjustment, the apparent difference deserves more caution.
How New Information Can Change a Prop Projection
MLB games contain a constant flow of new information.
A starting pitcher can be scratched.
A player can move from fifth in the batting order to second.
A hitter can be removed because of an injury.
Weather can change.
A team can announce a planned workload restriction.
Each event can change the expected distribution of a player's performance.
This is why the timing of a projection matters.
A model created at noon may produce a different estimate from the same model shortly before first pitch because more information has become available.
For analysts comparing MLB projections with prop lines, the goal should therefore be to use the most current reliable inputs available.
It is also useful to preserve older projections when possible.
Comparing the original forecast with the updated forecast can show which pieces of information caused the model to move.
That provides valuable feedback for evaluating the model itself.
Build the Comparison Around Price and Probability
The simplest way to compare MLB projections to prop lines is to subtract the line from the projected statistic.
The better approach is to continue from there.
Start with the projection. Confirm that it measures the same statistic as the prop. Estimate the probability of reaching the threshold. Convert the available odds into an implied probability. Then examine whether the model and market are working from comparable and current information.
That process separates a projection from a decision.
A pitcher projected for 5.5 strikeouts does not automatically make an over 4.5 prop attractive. What matters is how often the pitcher reaches five or more, how uncertain that estimate is, and what price is available.
Likewise, a hitter projected for 1.7 total bases should not be judged solely by the fact that the number is above a 1.5 line.
Probability, price, matchup conditions, playing time, model calibration, and data quality all belong in the analysis.
ATSwins.ai can fit naturally into this workflow by providing a structured framework for player projections, simulations, and market evaluation.
The objective is not certainty. It is a more disciplined way to interpret model output, understand uncertainty, and determine whether a difference between a projection and a prop line is actually meaningful.
Frequently Asked Questions
What is the biggest mistake when comparing MLB projections to prop lines?
The biggest mistake is treating the projection average as though it were a probability.
A 5.5 strikeout projection does not mean a pitcher has a 55% chance of going over 5.5. The projection is an expected value. To estimate the probability of going over, you need the underlying distribution or a model that can calculate the likelihood of each possible outcome.
Should the projection always be higher than the prop line for an over?
No.
A higher projection is a useful starting point, but the size and shape of the distribution matter. The odds matter as well.
A small projection advantage at a favorable price may be more meaningful than a larger projection advantage attached to an expensive price.
What MLB statistics are useful for player prop projections?
It depends on the prop.
Pitcher strikeout projections can consider expected innings, strikeout rates, pitch counts, opponent tendencies, pitch mix, and matchup conditions.
Hitter projections can consider expected plate appearances, contact quality, pitcher matchup, handedness, ballpark conditions, weather, and lineup position.
Statcast data can provide additional information about player performance and underlying skill.
How do you convert MLB prop odds into implied probability?
For positive American odds, divide 100 by the odds plus 100.
For negative American odds, divide the absolute value of the odds by the absolute value of the odds plus 100.
For example, +120 implies approximately 45.5%, while -120 implies approximately 54.5%.
These are raw implied probabilities and do not remove the market's built-in margin.
Does a projection above the prop line guarantee an advantage?
No.
A projection is an estimate, not a guarantee.
The model can be wrong, the data can be outdated, or the market can incorporate information the model has missed.
The most useful comparison considers the probability distribution, market price, data freshness, model calibration, and uncertainty rather than relying on the projection gap alone.