

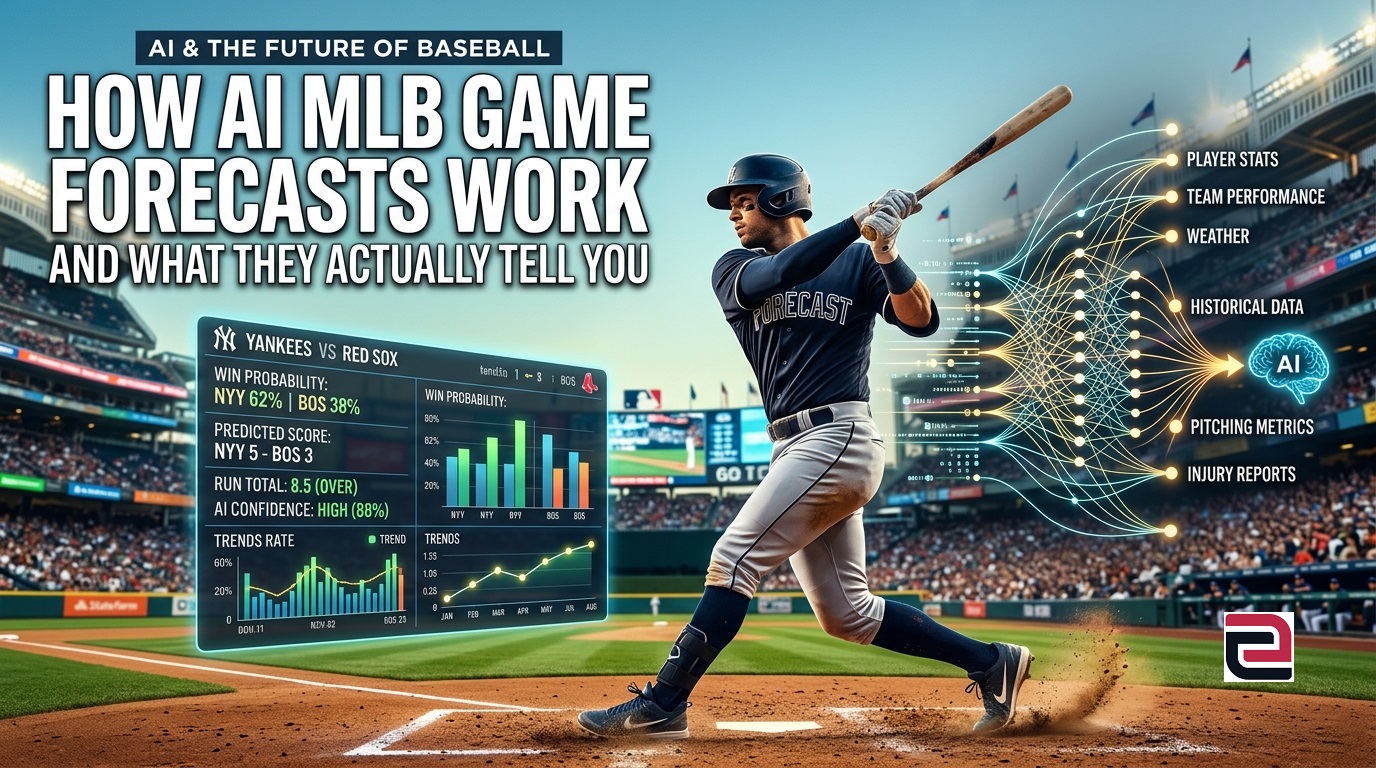
This distinction matters. Baseball is a high-variance sport where even strong favorites lose regularly. AI forecasts don’t eliminate that uncertainty; they quantify it. Understanding how these models work—and how to interpret them—helps you use them more effectively.
Table of Contents
- What AI MLB Forecasts Actually Are
- The Data Behind MLB Prediction Models
- How AI Models Turn Data Into Probabilities
- Simulation and Game-to-Game Variability
- How to Interpret AI MLB Forecasts
- Where MLB Forecasting Models Break Down
- How ATSwins.ai Approaches MLB Forecasting
- Practical Uses for AI MLB Forecasts
What AI MLB Forecasts Actually Are
AI MLB game forecasts are probabilistic models that estimate outcomes based on measurable inputs. These include team strength, starting pitchers, offensive production, and situational factors like rest and travel.
Instead of predicting a single result, the model produces a range of outcomes with associated likelihoods. A typical forecast might look like:
Team A win probability: 57%
Team B win probability: 43%
Projected run differential: +0.6 runs for Team A
That 57% does not mean Team A will win—it means that in similar conditions, they would win roughly 57 out of 100 games.
This approach differs from traditional previews, which often rely on narrative or recent performance trends. AI models focus on repeatable, data-driven relationships.
The Data Behind MLB Prediction Models
The strength of an AI forecast depends on the quality and depth of its data. Modern MLB models pull from several layers of information.
Player-Level Metrics
Advanced statistics are central to forecasting. These include:
Weighted on-base average (wOBA)
Expected ERA (xERA)
Strikeout and walk rates
Exit velocity and barrel rate
These metrics are more predictive than traditional stats like batting average or ERA because they capture underlying performance rather than outcomes influenced by luck or context.
Team Context
Individual performance is only part of the picture. Models also account for:
Lineup depth
Bullpen strength
Defensive efficiency
Ballpark characteristics
Some parks favor hitters, while others suppress scoring. These environmental factors are built into projections.
Short-term factors can shift probabilities significantly:
Starting pitcher matchups
Travel schedules and rest days
Weather conditions
For example, wind blowing out at a hitter-friendly park can increase expected run totals, while cooler temperatures may suppress offense. To learn how analysts quantify these individual player battles at a granular level, check out our guide on AI Pitcher vs Lineup Analysis: How to Build Predictive Models for MLB Matchups.
How AI Models Turn Data Into Probabilities
AI MLB forecasts typically combine statistical modeling with machine learning techniques. While the exact methods vary, most systems follow a similar structure.
First, raw data is adjusted for context. A hitter’s performance might be normalized for ballpark effects or opponent quality. Then the model evaluates which variables matter most, assigning weights based on historical predictive value.
Next, the model estimates expected runs scored and allowed for each team. These run expectations are then converted into win probabilities.
For example, if a model projects:
Team A: 4.7 runs
Team B: 4.2 runs
It doesn’t simply declare Team A the winner. Instead, it calculates how often that run difference leads to a win across many possible outcomes.
Simulation and Game-to-Game Variability
A key feature of AI MLB game forecasts is simulation.
Rather than calculating a single outcome, the model simulates the same game thousands of times. Each simulation introduces slight variations:
Pitchers perform slightly better or worse
Hit outcomes vary
Bullpen usage changes
Example Simulation
If a game is simulated 10,000 times:
Team A wins 5,800 times (58%)
Team B wins 4,200 times (42%)
Even with a clear favorite, the underdog still wins frequently. This reflects the inherent randomness of baseball, where a few key plays can swing the outcome.
Simulation allows models to capture that variability instead of ignoring it.
How to Interpret AI MLB Forecasts
Understanding how to read forecasts is just as important as understanding how they’re built.
Probability vs Prediction
A 60% probability is not a guarantee. It simply means the team is more likely to win than lose under similar conditions.
Fair Line Concept
Probabilities can be translated into implied odds:
60% probability ≈ -150 fair line
40% probability ≈ +150 fair line
This concept helps compare model outputs to market pricing. Differences between the two represent disagreement—not certainty.
Short-Term Variance
Even strong probabilities lose regularly. A team with a 65% chance to win will still lose about 35% of the time.
Looking at results over large samples is far more meaningful than focusing on individual games.
Where MLB Forecasting Models Break Down
No model captures every variable in baseball. Some limitations are unavoidable.
Late Lineup Changes
If a key player is scratched shortly before a game, forecasts may not fully adjust in time.
Bullpen Volatility
Relief pitchers can be unpredictable, and small changes in usage can affect outcomes.
Small Sample Sizes
Early-season data can be misleading, as player performance may not reflect true ability yet.
Managerial Decisions
In-game choices—such as pinch hitters or pitching changes—introduce uncertainty that models cannot fully anticipate.
Injury Information
Public data may not reflect a player’s true health status, especially for minor or undisclosed injuries.
Because of these factors, forecasts should be treated as structured estimates rather than precise predictions.
How ATSwins.ai Approaches MLB Forecasting
ATSwins.ai applies a data-driven framework that combines statistical modeling with simulation.
Instead of focusing on a single projected outcome, the platform emphasizes:
Probability distributions
Fair-line estimates
Scenario-based simulations
Market comparisons
A typical process includes:
Building baseline projections from player and team data
Running simulations to capture variability
Converting outcomes into probabilities
Comparing those probabilities to available market prices
This approach aligns with how analysts evaluate uncertainty. It focuses on understanding likelihoods rather than trying to predict exact outcomes.
Practical Uses for AI MLB Forecasts
AI MLB forecasts are most useful when applied as part of a structured analytical process.
Evaluating Matchups
Forecasts provide a consistent way to compare starting pitchers, offenses, and overall team strength.
Identifying Pricing Differences
Comparing model probabilities to market odds can highlight where expectations differ.
Tracking Performance Over Time
Evaluating results across many games helps determine whether a model is well-calibrated.
Scenario Analysis
Simulations allow you to explore how changes—like a different starting pitcher—affect outcomes.
What AI Forecasts Cannot Do
It’s important to understand the limits of these systems.
AI MLB forecasts do not:
Guarantee results
Remove randomness
Predict specific plays
Capture every real-time variable
Baseball’s unpredictability remains, regardless of how advanced the model is.
Using AI MLB Forecasts With Discipline
The most effective use of AI forecasts comes from consistency.
Rather than focusing on individual games, experienced analysts look at:
Long-term performance across many forecasts
Differences between model probabilities and market expectations
Stability and quality of model inputs
This approach treats forecasting as a process rather than a single prediction.
FAQ
What makes AI MLB forecasts different from traditional predictions?
AI forecasts rely on statistical models and simulations rather than narrative-based analysis. They quantify uncertainty by assigning probabilities instead of predicting a single outcome.
How accurate are AI baseball predictions?
Accuracy depends on calibration over time. Even strong models will have frequent short-term misses because baseball outcomes are highly variable.
Do AI MLB forecasts account for starting pitchers?
Yes. Starting pitchers are one of the most important inputs and heavily influence projected run totals and win probabilities.
Can AI forecasts adjust for weather and ballpark effects?
Many models include these factors when data is available, adjusting projections based on environmental conditions.
Are AI MLB forecasts useful long term?
They are most useful over large samples, where probabilities tend to align more closely with actual outcomes.
What AI MLB Forecasts Mean in Practice
AI MLB game forecasts provide structured probability estimates built from data, modeling, and simulation. They don’t remove uncertainty from baseball, but they help measure it in a consistent way.
The real value comes from how those probabilities are used—comparing them to expectations, tracking results over time, and understanding where models may fall short.
For those interested in a more analytical approach to baseball forecasting, platforms like ATSwins.ai offer tools designed around probability modeling, simulations, and fair-line evaluation.