

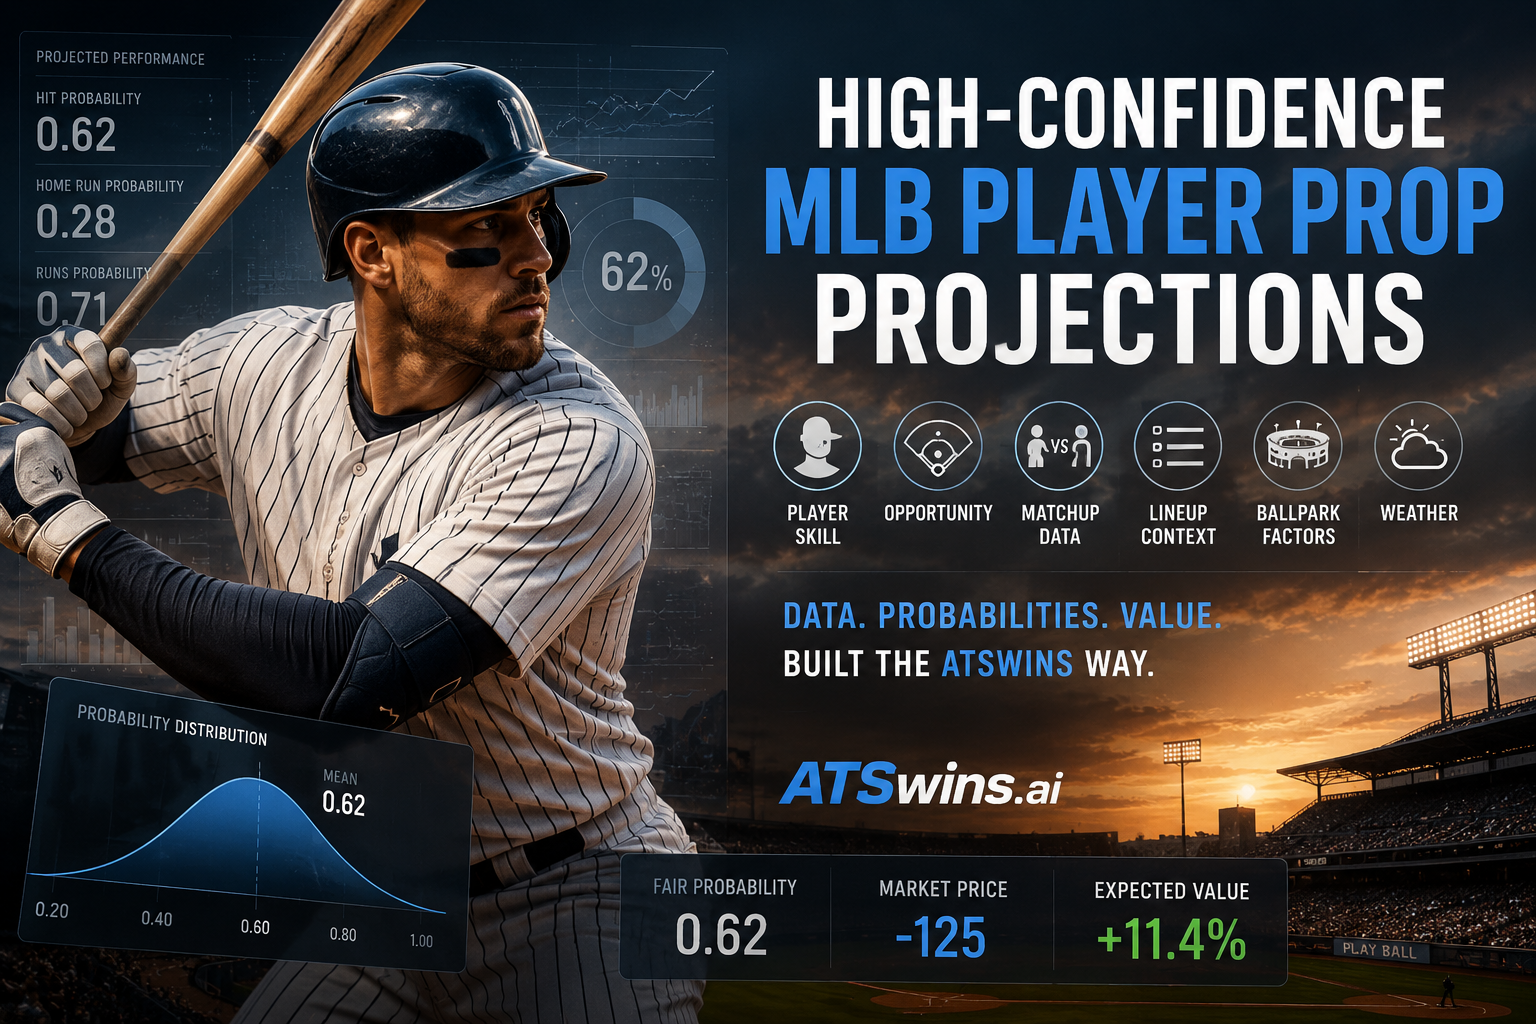
High confidence MLB player prop projections are not about finding a player who has been hot lately and assuming the trend continues. They are about estimating a player’s expected performance, measuring the uncertainty around that estimate, and then comparing the result with the price being offered by the market.
That distinction matters because baseball is extremely variable at the individual level. A hitter can make excellent contact and finish without a hit. A pitcher can generate weak contact and still allow several runs. A player projected for six strikeouts can finish with three, while another projected for three can record seven. A useful projection system does not eliminate that randomness. It measures it.
For MLB player props, the strongest analytical process combines player skill, expected opportunity, matchup characteristics, ballpark conditions, weather, lineup context, workload, recent information, and historical data. The result should be more than a single projected number. A good model should produce a probability distribution that explains how likely different outcomes are.
Table of Contents
- What Makes an MLB Player Prop Projection High Confidence
- The Data Behind Accurate MLB Player Prop Projections
- How Matchups and Opportunity Change Player Projections
- How Models Generate MLB Player Prop Projections
- Turning Projections Into Probabilities and Fair Lines
- How to Measure Confidence and Uncertainty
- Finding Value by Comparing Projections With the Market
- Applying High Confidence Projections to Bet Sizing
- How ATSwins Approaches MLB Player Prop Analysis
- Common Mistakes That Reduce Projection Quality
- Why High Confidence Does Not Mean Guaranteed Results
- Final Thoughts
- FAQ About High Confidence MLB Player Prop Projections
What Makes an MLB Player Prop Projection High Confidence
A high confidence projection does not mean a prediction is guaranteed to be correct. That would be an unrealistic standard for baseball.
Instead, confidence should describe the quality of the information behind a projection and how consistently the model performs when similar situations occur. A projection becomes more trustworthy when it is supported by reliable data, relevant features, appropriate modeling methods, strong validation, and good calibration.
Consider a simple strikeout projection. If a starting pitcher is projected for 6.2 strikeouts, that number alone does not tell you how confident the model should be. The model also needs to understand the opponent's strikeout tendencies, the pitcher's expected workload, projected pitch count, handedness matchup, lineup composition, and other factors that influence opportunities.
The same principle applies to hitter props. A projection for 1.4 total bases means something very different when the player is expected to receive five plate appearances against a pitcher whose pitch mix matches the hitter's strengths than when the player is batting eighth against a difficult matchup.
High confidence therefore comes from agreement between multiple relevant inputs rather than from one impressive statistic.
The goal is not to predict every individual outcome correctly. The goal is to estimate probabilities accurately enough that repeated decisions can be evaluated on their underlying quality rather than on short-term results.
The Data Behind Accurate MLB Player Prop Projections
The foundation of any MLB projection model is its data. A sophisticated model cannot compensate for incomplete, stale, or poorly structured inputs.
Traditional statistics still have a place in player projection. Hits, home runs, walks, strikeouts, runs, stolen bases, innings, earned runs, and other box-score outcomes describe what actually happened. But raw results do not always explain the underlying skill that produced them.
This is where Statcast-style data becomes particularly useful. Metrics such as exit velocity, launch angle, barrel rate, hard-hit rate, pitch movement, pitch velocity, and expected statistics provide additional information about the quality of individual events. MLB's Statcast expected statistics use characteristics such as exit velocity and launch angle to estimate expected outcomes, helping separate quality of contact from the actual result of a batted ball.
For hitters, a projection system can evaluate contact quality, strikeout and walk tendencies, platoon splits, power production, speed, and how those characteristics interact with the opposing pitcher.
For pitchers, the model can consider strikeout rate, walk rate, swinging-strike tendencies, pitch mix, velocity, pitch movement, contact quality allowed, expected statistics, and projected workload.
Historical data also needs to be time-aware. Using information that would not have been available before a particular game creates data leakage and can make a backtest look much better than the model would perform in real use.
A projection generated before a game should only use information available before that game.
How Matchups and Opportunity Change Player Projections
Player skill is only one part of an MLB prop projection.
Opportunity may be just as important.
For hitters, projected plate appearances are critical. A player batting near the top of the lineup may have a different expected number of opportunities than a player batting near the bottom. Lineup changes can therefore affect the probability of hitting, reaching base, scoring, driving in runs, or accumulating total bases.
The opposing pitcher also changes the environment. A hitter who performs well against a particular pitch type may receive more opportunities to exploit that strength if the opposing pitcher relies heavily on that pitch.
Pitcher props work in a similar way. A strikeout projection depends on both the pitcher's ability and the opposing lineup. A high-strikeout pitcher facing a contact-oriented lineup may have a different expected result from the same pitcher facing an aggressive lineup with several high-strikeout hitters.
Park factors can influence the projection as well. Ballpark dimensions, foul territory, altitude, and other environmental characteristics can affect offensive outcomes. Weather can introduce another layer of uncertainty, particularly through temperature, wind, and precipitation.
Bullpen context matters too. A hitter's plate appearances may eventually come against relief pitching rather than the starter. A pitcher may have a shorter leash if the bullpen is well rested or may be pushed further if relief options are limited.
This is why using a season average as the entire projection is usually insufficient. The question is not simply, "How good is this player?" It is, "What should this player's opportunity and performance look like in this specific game?"
How Models Generate MLB Player Prop Projections
There is no single modeling method that is automatically best for every MLB prop.
A useful system may begin with statistical baselines and then incorporate machine learning, regression, simulation, or ensemble techniques depending on the market.
For a simple count-based prop such as strikeouts, hits, walks, or runs, a model might estimate an expected rate and combine it with projected opportunity. More flexible models can incorporate nonlinear relationships between variables.
Tree-based methods such as gradient boosting are useful when interactions between features matter. A pitcher’s strikeout projection, for example, may depend on the combination of pitcher strikeout skill, opposing lineup strikeout tendencies, expected innings, handedness, and pitch-count expectations rather than any single feature.
Simulation can take the process another step further.
Instead of producing only one expected value, a model can simulate many possible game outcomes. Each simulated game produces a potential result for the player, creating a distribution of outcomes.
Suppose a model projects a hitter for 1.35 total bases. That does not mean the player is expected to record exactly 1.35 total bases. It means the average outcome across the modeled distribution is 1.35.
The distribution might contain many simulations with zero total bases, a large number with one or two total bases, and a smaller number with three or more.
That distribution is much more useful for prop analysis because sportsbook markets are normally based on thresholds.
The important question becomes whether the probability of exceeding the line is greater than the probability implied by the available price.
Turning Projections Into Probabilities and Fair Lines
A projection and a probability are not the same thing.
If a hitter is projected for 1.6 hits, that does not mean there is a 60% probability that he gets at least two hits. The distribution of possible outcomes determines the probability.
This distinction becomes especially important for discrete MLB props.
A model might project a pitcher for 5.3 strikeouts. From the underlying distribution, it could estimate the probability of recording at least five strikeouts, at least six strikeouts, or fewer than a specific threshold.
Once the probability is estimated, it can be converted into a fair price.
For example, imagine a model estimates that a player has a 58% probability of going Over a particular prop line. Ignoring the bookmaker's margin, the fair decimal price would be approximately 1.72. If the available market price is substantially better than that fair price, the difference may represent positive expected value.
The calculation should always account for the actual odds rather than simply comparing the sportsbook line with the model's projected average.
This is one reason high confidence MLB player prop projections should not be reduced to a leaderboard of the largest numerical differences. A projection of 5.8 strikeouts against a line of 4.5 may look attractive, but the price, probability distribution, workload assumptions, and uncertainty all matter.
How to Measure Confidence and Uncertainty
A projection model should know when it is uncertain.
This is one of the biggest differences between a serious forecasting system and a simple statistical trend.
Consider two hitters with the same projected total bases. One may have a large historical sample, a stable lineup role, predictable playing time, and consistent underlying contact metrics. The other may have limited MLB data, an uncertain role, and rapidly changing playing-time expectations.
Their average projections could be identical while their uncertainty is very different.
Confidence can therefore be evaluated using the width and shape of the predicted distribution, historical model error, sample size, data stability, and the sensitivity of the projection to individual assumptions.
Small samples deserve particular caution. A player's recent five-game stretch may contain useful information, but it should not automatically override a much larger body of evidence.
Recent form can matter when it reflects a genuine change in skill or role. It becomes dangerous when it is treated as proof that an unusual short-term result will continue.
Model calibration provides another important test. If a system assigns 70% probability to a certain class of outcomes, those events should occur roughly 70% of the time over a large enough sample. A model that produces impressive-looking projections but poorly calibrated probabilities is less useful for pricing props.
Finding Value by Comparing Projections With the Market
A high confidence projection becomes useful for betting analysis when it is compared with the market.
The sportsbook line represents a threshold and a price. The model represents an estimated distribution and probability.
The difference between the two is where analytical value may exist.
Imagine a sportsbook posts a hitter's total bases at 1.5. Your model estimates an expected total of 1.8 and, more importantly, calculates a 56% probability of going Over.
That does not automatically make the Over a bet.
The price matters.
If the market price implies a probability close to or above the model's estimate, there may be little or no value despite the favorable projection. If the market price implies a meaningfully lower probability, the discrepancy deserves further investigation.
This is also where line shopping matters. Two sportsbooks can offer different prices on the same underlying prop. A model's edge can disappear at one price and remain attractive at another.
The strongest process therefore evaluates the probability, the price, the expected value, and the uncertainty together.
Closing-line value can also provide useful feedback. If a model repeatedly identifies prices that later move in its direction, that is evidence worth tracking even when individual bets lose. It does not guarantee future profitability, but it provides another way to evaluate whether the forecasting process is identifying information the market later incorporates.
Applying High Confidence Projections to Bet Sizing
Even a strong projection should not justify unlimited exposure.
Baseball produces significant short-term variance. A hitter can have excellent underlying conditions and still go 0-for-4. A pitcher can project well for strikeouts and encounter an unusually low-strikeout game.
Bet sizing should therefore reflect both the estimated edge and the uncertainty surrounding it.
A fractional Kelly approach can be useful for bettors who want a mathematical framework, but using full Kelly sizing can create aggressive exposure when probabilities are estimated with error. A conservative fraction of Kelly is generally more appropriate for uncertain model outputs.
Another practical approach is to establish maximum exposure limits by player, game, market, and day. Correlation should also be considered. Several props can depend on the same underlying game environment, meaning that betting them independently may create much more concentrated exposure than it initially appears.
The purpose of sizing is not to make every good projection large. It is to make the portfolio resilient when projections inevitably encounter variance.
How ATSwins Approaches MLB Player Prop Analysis
ATSwins is built around the idea that sports forecasting should be treated as a probability and data problem rather than a collection of guesses.
For MLB player props, that means evaluating player performance through relevant statistical inputs, matchup conditions, opportunity, and market context. The objective is to estimate expected outcomes and probabilities while recognizing that no model can eliminate uncertainty.
A useful ATSwins-style workflow begins before looking for a betting angle. Data is collected and checked, player roles and game conditions are evaluated, and projections are generated from the available information. The model output can then be compared with market prices to determine whether a meaningful discrepancy exists.
That distinction is important. The purpose of a projection is not to produce a pick for every player on the board. Sometimes the correct analytical conclusion is that the model and market agree closely enough that there is no compelling opportunity.
That discipline prevents the process from turning into forced action.
ATSwins also fits player prop analysis into a broader forecasting framework that emphasizes probabilities, fair-line estimates, simulations, market evaluation, and data quality rather than guarantees. The underlying principle is simple: a projection should be judged by how well it estimates future distributions over a meaningful sample, not by whether one particular player went Over or Under on a single night.
Common Mistakes That Reduce Projection Quality
One of the biggest mistakes is relying too heavily on recent game logs.
A player going Over a prop in six consecutive games does not automatically make the next Over more likely. The reasons behind those results matter. If the player's opportunity, underlying skill, and matchup conditions remain favorable, the streak may contain useful information. If the streak is largely driven by unusually high conversion rates, regression is possible.
Another mistake is ignoring lineup uncertainty.
A projection created before the batting order is confirmed can become outdated if a player moves several lineup spots or is unexpectedly rested.
Ignoring workload is another problem, especially for pitcher props. Strikeout ability means little if the pitcher is unlikely to work deep enough into the game to create sufficient opportunities.
Models can also become overfit. Adding more variables does not automatically improve forecasting. Features should have a defensible relationship with the outcome and should be tested using time-aware validation rather than simply optimized against historical data.
Finally, analysts sometimes confuse model accuracy with betting profitability. A model can be reasonably accurate while still producing poor betting results if its estimates are not sufficiently better than the market price.
The objective is not merely to predict baseball. It is to estimate probability well enough to make informed decisions when the price is wrong.
Why High Confidence Does Not Mean Guaranteed Results
There is no such thing as a guaranteed MLB player prop.
Even the best projection is an estimate of a distribution of possible outcomes.
A player with a 65% probability of going Over still has a 35% probability of finishing Under. That does not mean the model failed when the Under occurs. If the probability was properly estimated, the result is part of the expected variance.
This is why individual outcomes are a poor way to judge a forecasting model.
A projection system should instead be evaluated over a sufficiently large sample using metrics such as calibration, log loss, Brier score, expected value, return on investment, and closing-line value where appropriate.
Model performance should also be monitored for drift. Player roles change. Pitchers change pitch mixes. Injuries alter playing time. League environments evolve. Market behavior changes.
A model that worked well several seasons ago may need to be retrained or recalibrated as the underlying conditions change.
High confidence therefore means confidence in the process and the quality of the probability estimate, not certainty about what will happen in one game.
Final Thoughts
High confidence MLB player prop projections are built from much more than player averages or recent streaks. The strongest projections combine skill, opportunity, matchup, environment, workload, lineup context, and uncertainty into a probability-based forecast.
The key step is turning a projection into something that can actually be evaluated against a market. A projected average is useful, but the probability of exceeding a specific line is more important when analyzing a prop. Once that probability is compared with the available price, the analyst can determine whether a meaningful discrepancy exists.
ATSwins approaches sports forecasting with that same emphasis on data, probability, simulations, and disciplined market evaluation. The goal is not to promise that every projection will be correct. It is to build a repeatable analytical process that makes uncertainty measurable and decisions more informed.
FAQ About High Confidence MLB Player Prop Projections
What are high confidence MLB player prop projections?
High confidence MLB player prop projections are model-based estimates supported by strong data, relevant matchup information, appropriate statistical methods, and calibrated probabilities. Confidence does not mean the outcome is guaranteed. It means the projection has a stronger analytical foundation and a measured level of uncertainty.
What data is most useful for MLB player prop projections?
Useful data depends on the prop. Hitter projections can incorporate contact quality, expected statistics, plate appearances, lineup position, handedness, pitcher characteristics, park factors, and weather. Pitcher projections can include strikeout and walk rates, pitch mix, opponent tendencies, expected workload, and contact quality. MLB's Statcast system provides advanced metrics such as exit velocity, barrels, xBA, and xwOBA that can help describe underlying performance.
Does a higher player projection automatically mean an Over bet?
No. The projection must be compared with the sportsbook line and price. A player projected above the line may still have insufficient expected value if the market price already reflects that expectation. Probability and price need to be evaluated together.
How does simulation improve MLB player prop projections?
Simulation allows a model to generate many possible game outcomes rather than relying only on one expected value. This produces a distribution that can be used to estimate the probability of reaching specific thresholds, such as a pitcher recording at least six strikeouts or a hitter finishing with two or more total bases.
Can high confidence projections guarantee profitable results?
No. Baseball contains substantial randomness, and even a well-calibrated probability can lose on an individual outcome. High confidence should describe the quality of the forecasting process, not a promise of winning. Long-term evaluation requires a sufficiently large sample and metrics that measure both probability accuracy and market performance.