

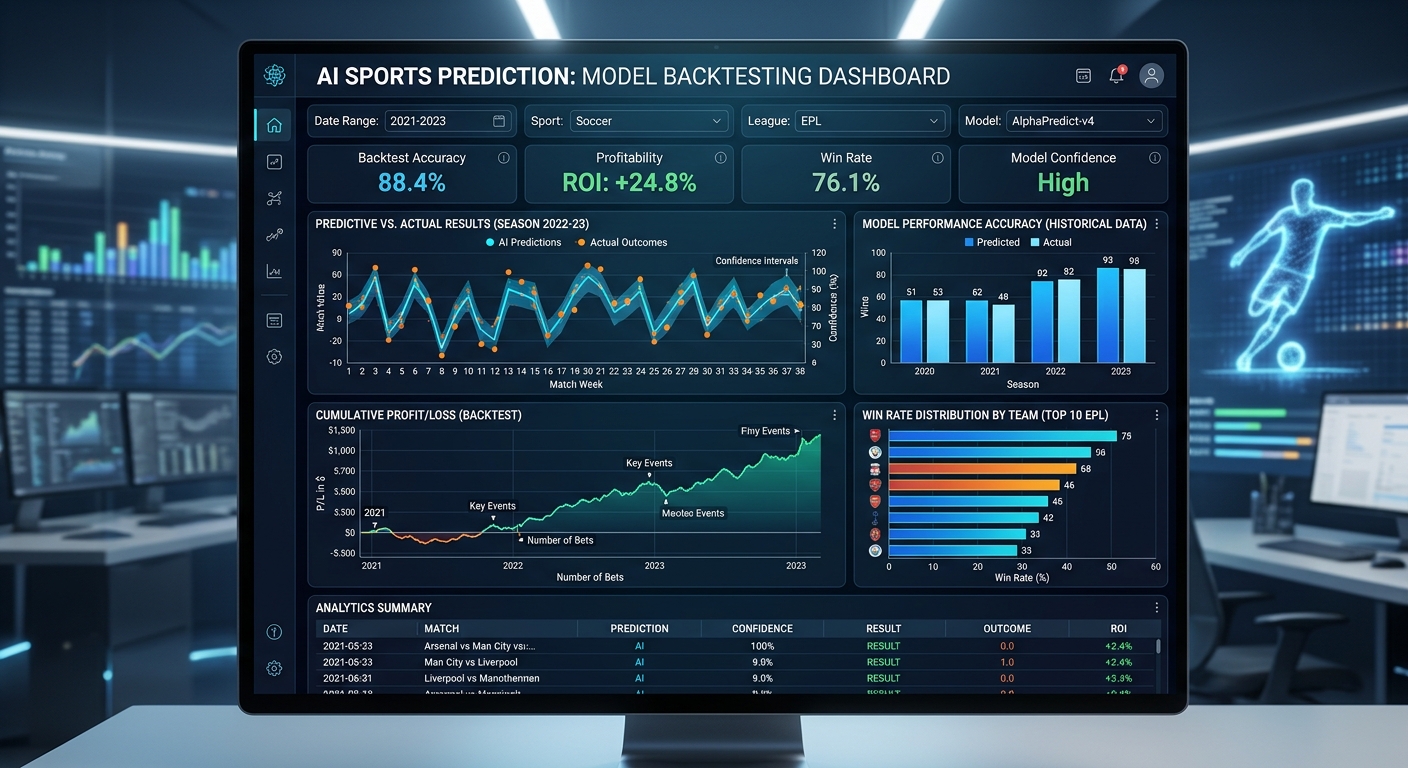
AI sports prediction model backtesting results show how a forecasting system would have performed against historical games under a defined testing process. But a high win rate alone does not prove that a model is accurate, well calibrated, or capable of producing useful forecasts in the future. The quality of the evidence depends on how predictions were generated, which data was available at the time, how probabilities were evaluated, and whether historical market prices were realistic.
For anyone evaluating an AI sports prediction model, the goal is to separate genuine forecasting skill from statistical noise and testing errors. That means examining out-of-sample performance, probability calibration, sample size, simulated returns, and closing-line value together. Each measure answers a different question, and none provides a complete assessment on its own.
What Backtesting Results Reveal
Backtesting applies a forecasting model to historical sporting events and compares its predictions with what actually happened. In a rigorous test, the model receives only information that would have been available before each game. Its predictions are recorded, outcomes are graded, and performance is calculated using predefined metrics.
The resulting report might include moneyline accuracy, spread performance, totals results, player-projection errors, probability calibration, or simulated return on investment. Which metrics matter depends on what the model is designed to predict.
A football match-outcome model, for example, should be evaluated on its home-win, draw, and away-win probabilities. An NFL point-spread model needs to account for predicted margins and the relationship between those margins and the market spread. A baseball player-projection model may be better assessed through errors in strikeouts, hits, or innings pitched.
These are different forecasting tasks. A single overall accuracy figure cannot adequately describe all of them.
Backtesting is also not the same as live performance. Historical testing estimates how a method behaves under specified past conditions. Live forecasting introduces operational problems, including delayed data, changing lineups, market movement, and information arriving later than expected.
A credible report therefore describes both its results and the conditions under which those results were produced.
Why Testing Methodology Matters
Use out-of-sample and walk-forward testing
A model should be evaluated on games that were not used to fit its parameters or select its features. Otherwise, the model may appear successful because it has learned patterns specific to its training data.
A chronological split is generally more appropriate than randomly mixing historical games. For example, a model could train on earlier seasons, validate its settings on a later period, and reserve the most recent period for a final test.
Walk-forward testing takes this idea further. The model trains on information available before a particular date, generates forecasts for a subsequent period, and then advances through time. Depending on the design, it may retrain weekly, monthly, or after each new batch of games.
This approach more closely resembles how a forecasting system operates in practice. It also reveals whether performance changes across seasons, teams, leagues, and market conditions.
The research literature on sports analytics methodology discusses the challenges involved in evaluating predictive models, including generalization and appropriate performance metrics.
Prevent data leakage
Data leakage occurs when a model uses information that would not have been available at the time of prediction.
Imagine testing an NBA model on games from a previous season. If the model uses a final version of a player availability field that includes information confirmed after tip-off, the historical forecast has an unfair advantage.
The same issue appears when season averages include future games, revised statistics are applied retroactively, or a model is tuned repeatedly against its supposed test set.
Odds require similar care. A model presented as producing an actionable forecast at noon cannot be evaluated using a price that only became available shortly before the game.
The solution is point-in-time data: preserve the forecast timestamp, the input values available then, the model version, and the relevant market price. Without those records, the reported result may be difficult to reproduce.
Include realistic execution assumptions
Even a sound prediction may not translate into a profitable strategy at the price used in a backtest.
Historical odds should reflect a price that was genuinely available, rather than an idealized price selected after the event. Commission, bookmaker margin, pushes, ties, voided markets, and realistic execution delays must be handled consistently.
If a strategy depends on obtaining an opening line, its results should use that opening price or a defensible record of the price actually available. A closing price cannot be substituted without changing the strategy being tested.
Metrics That Deserve Attention
The best AI sports prediction model reports several complementary measures rather than relying on one headline statistic.
Accuracy and hit rate
Accuracy measures the percentage of predictions that correctly identify the outcome under a specified grading rule. It is easy to understand, but it ignores the confidence assigned to each forecast.
Consider two models predicting the same 100 games. Both select the correct winner in 60 games. One assigns 55% probability to most selections; the other assigns 90%. Their hit rates are identical, but their probability estimates communicate very different levels of certainty.
Accuracy also depends on the task and the outcome distribution. In a three-outcome soccer market, the benchmark differs from that of a two-outcome market. Results should be compared against an appropriate baseline, not an arbitrary percentage.
Probability calibration and Brier score
Calibration asks whether events assigned a particular probability occur at approximately that frequency over a sufficiently large sample. Among forecasts assigned 70% probability, for example, roughly 70% should occur if the model is well calibrated over that group.
The Brier score measures the squared difference between a forecast probability and a binary outcome coded as zero or one. Lower scores are better.
Brier Score = (1/N) × Σ(pᵢ − yᵢ)²
Here, pᵢ is the predicted probability, yᵢ is the observed outcome, and N is the number of forecasts.
For a forecast of 70% followed by an event that occurs, the squared error is (0.70 − 1)² = 0.09. If the event does not occur, it is (0.70 − 0)² = 0.49.
This difference rewards forecasts that assign appropriate probabilities, not just the correct label.
For further background, see the academic review of proper scoring rules for estimation and forecast evaluation.
ROI and drawdown
Return on investment measures the net result relative to the amount risked or invested, according to the report's stated convention. Because ROI depends on prices, staking rules, and costs, it should not be inferred from accuracy alone.
A strategy can win more than half its wagers and still lose money if the prices are unfavorable. Conversely, a strategy can have a win rate below 50% and remain profitable when its successful outcomes pay enough to cover losses.
Drawdown describes the decline from a previous peak in cumulative results or bankroll. It reveals how uneven the simulated performance was and how severe the worst historical losing period became.
ROI without drawdown, bet count, stake assumptions, and a complete record leaves important questions unanswered.
Closing-line value
Closing-line value (CLV) compares the price obtained when a position was taken with the market's closing price. It can provide evidence about whether a model consistently identifies prices that subsequently move in a favorable direction.
For instance, obtaining a team at +120 when the comparable market later closes at +105 is generally favorable price movement for that selection.
However, CLV is not a guarantee of profitability. Market prices can be wrong, closing odds are not perfect estimates of true probabilities, and results vary across leagues and market types. It is a useful diagnostic, not a substitute for outcome evaluation.
A Worked Sports Model Example
Consider a hypothetical NBA moneyline model tested on 1,000 historical games. The following figures are illustrative, not reported ATSwins.ai results.
| Measure | Illustrative result |
|---|---|
| Historical forecasts | 1,000 |
| Correct selections | 560 |
| Hit rate | 56% |
| Test design | Walk-forward |
A 56% hit rate sounds promising in isolation, but several questions remain. Did the model beat a simple baseline? Were the predictions made before games using point-in-time data? Did the model assign reliable probabilities? Were the odds available at the time recorded accurately?
Suppose the model assigns a 55% win probability to a selection. Its corresponding fair decimal odds are:
Fair Odds = 1 / 0.55 ≈ 1.82
This means the selection would need decimal odds above approximately 1.82 to have positive expected value under the model's probability estimate, before accounting for additional execution costs. At exactly 1.82, the theoretical expected return is approximately zero.
Now imagine the model's estimated win probability is 55%, but the available decimal odds are 1.75. The expected net return per unit staked is:
EV = (0.55 × 0.75) − (0.45 × 1) = −0.0375
That is a theoretical expected loss of 3.75% per unit staked under those assumptions. The forecast might still identify the correct winner more often than not, yet the offered price would not justify the position.
This is why historical results need both probability evaluation and market-price evaluation. Predicting winners and identifying favorable prices are related but distinct tasks.
How to Read a Backtest Report
A useful report makes it possible to understand the testing process without trusting a headline claim.
| Report item | What to check |
|---|---|
| Sample size | Number of games and graded forecasts, broken down by market |
| Testing period | Seasons covered and chronological train/test boundaries |
| Model version | Whether the same version generated all reported forecasts |
| Probability quality | Brier score, calibration plots, or another suitable scoring rule |
| Financial assumptions | Historical odds, costs, staking rules, pushes, and voids |
| Stability | Results across seasons, leagues, teams, and confidence bands |
| Audit trail | Timestamped predictions and reproducible grading records |
Pay attention to how a report defines its denominator. One page might grade every game, while another reports only selections above a confidence threshold. A third might exclude games without archived odds. Those results are not directly comparable.
Confidence filtering deserves particular scrutiny. A model may perform well on a narrow subset while producing much weaker forecasts elsewhere. A credible report should disclose how many games remain at each threshold and whether the thresholds were chosen before the test.
Uncertainty also matters. Even a large backtest can conceal pockets of poor performance, especially when the model evaluates many leagues, prop markets, and confidence levels. Repeatedly searching for a profitable subgroup creates a risk of selecting a pattern that occurred by chance.
A report should show enough detail for readers to distinguish a prespecified evaluation from a favorable result discovered after extensive experimentation.
Common Backtesting Failures
Several mistakes repeatedly make sports forecasting results look more convincing than they deserve.
Overfitting historical games. A model is adjusted until it fits the quirks of a particular dataset. Its historical performance improves, but the pattern may not recur. Reserve untouched test data and limit repeated tuning against the same period.
Using a tiny sample. A few dozen successful predictions do not establish durable forecasting skill. Outcomes are noisy, and apparent advantages may disappear with additional games. Report the sample size alongside every rate.
Ignoring market prices. A correct winner is not necessarily a good decision at any price. Evaluate the actual odds and costs associated with the intended use case.
Mixing incompatible markets. Moneyline, spread, totals, and player props have different outcome structures and grading rules. Combining them into one percentage can conceal weaknesses.
Ignoring changes in the sport. Rules, tactics, player roles, pace, coaching, and roster composition evolve. Historical data remains useful, but older observations may require different weighting or explicit regime adjustments.
Changing the model without changing the report. If features, training windows, or probability-calibration methods change, historical results should identify which version generated each forecast. A model's strongest period should not stand in for the performance of every later version.
A good validation process attempts to disprove its own claims. It tests difficult periods, records failures, and checks whether an apparent advantage survives reasonable changes in assumptions.
Applying Backtesting to ATSwins.ai
ATSwins.ai describes its platform as combining sports projections, simulated outcomes, fair-line estimates, and market comparisons. Its public website also presents historical performance records and closing-line examples. These are relevant components of a broader evaluation process, but readers should distinguish a displayed historical record from a fully specified out-of-sample backtest.
Start by identifying the exact output being evaluated. A model's win probability, a simulated spread, and a player-stat projection require different grading methods. Next, establish the forecast timestamp, the applicable model version, and the historical odds used for comparison.
Where available, compare the platform's forecast with the market price and subsequent closing line, then review the final result separately. A favorable closing-line movement does not mean the game was won; a correct selection does not prove the probability estimate was calibrated.
ATSwins users can explore its sports projections and market-analysis platform and review the recent articles and analytics explanations for related context. Any specific performance claim should be evaluated against the corresponding period, sample size, market definition, and grading methodology.
The key standard is transparency: forecasts should be judged on what they predicted, when they predicted it, and how consistently those predictions performed outside the data used to develop the model.
Frequently Asked Questions
What are AI sports prediction model backtesting results?
They are measurements of how a sports forecasting model would have performed on historical events under a defined testing procedure. Results may include accuracy, probability calibration, prediction error, simulated ROI, drawdown, or closing-line value. Their credibility depends on whether the model used only information available before each event, whether testing data was kept separate from model development, and whether the grading and pricing assumptions were realistic. Historical performance is evidence about a method, not a guarantee of future outcomes.
What is a good win rate for an AI sports prediction model?
There is no universal benchmark. A meaningful rate depends on the sport, market, odds, sample size, and difficulty of the prediction task. A 60% hit rate at unfavorable prices may be less useful than a lower rate at prices that compensate for the risk. Evaluate accuracy alongside calibration, an appropriate baseline, historical pricing, and uncertainty. Always check whether the rate covers every forecast or only a selected group of high-confidence predictions.
How many games are needed for reliable backtesting?
There is no single minimum that applies to every sport or model. Required sample size depends on the size of the expected improvement, outcome variability, event frequency, and how many comparisons are being made. A larger sample generally provides more information, but thousands of games cannot repair data leakage or an unrealistic testing design. Look for results across multiple periods and report uncertainty rather than relying on an arbitrary game-count threshold.
Does positive backtested ROI mean a model will make money?
No. Backtested ROI describes a historical simulation based on specified prices, stakes, and assumptions. Actual performance may differ because of variance, market movement, execution constraints, and changes in the sport. The estimate can also be overstated if the model was repeatedly tuned to the same historical period. More credible evidence comes from a clean out-of-sample test, realistic costs, a transparent record of every eligible prediction, and subsequent live monitoring.
Turn Historical Results Into Better Analysis
AI sports prediction model backtesting results are most useful when they show more than a winning percentage. A sound evaluation combines chronological testing, clean data, probability calibration, realistic market prices, and enough historical observations to assess uncertainty. It also preserves losing periods and weaker market segments rather than reporting only the most favorable slice of performance.
For analysts, the objective is not to find a model that looks perfect on past games. It is to establish whether its forecasts remain informative when the data, teams, and market conditions change. That requires consistent grading and a willingness to revise assumptions when the evidence does not hold up.
ATSwins.ai provides a starting point for examining sports projections, simulations, fair lines, and market behavior. Use those outputs as inputs to a disciplined evaluation process, and judge any model by the quality and reproducibility of its evidence—not by a headline result alone.