

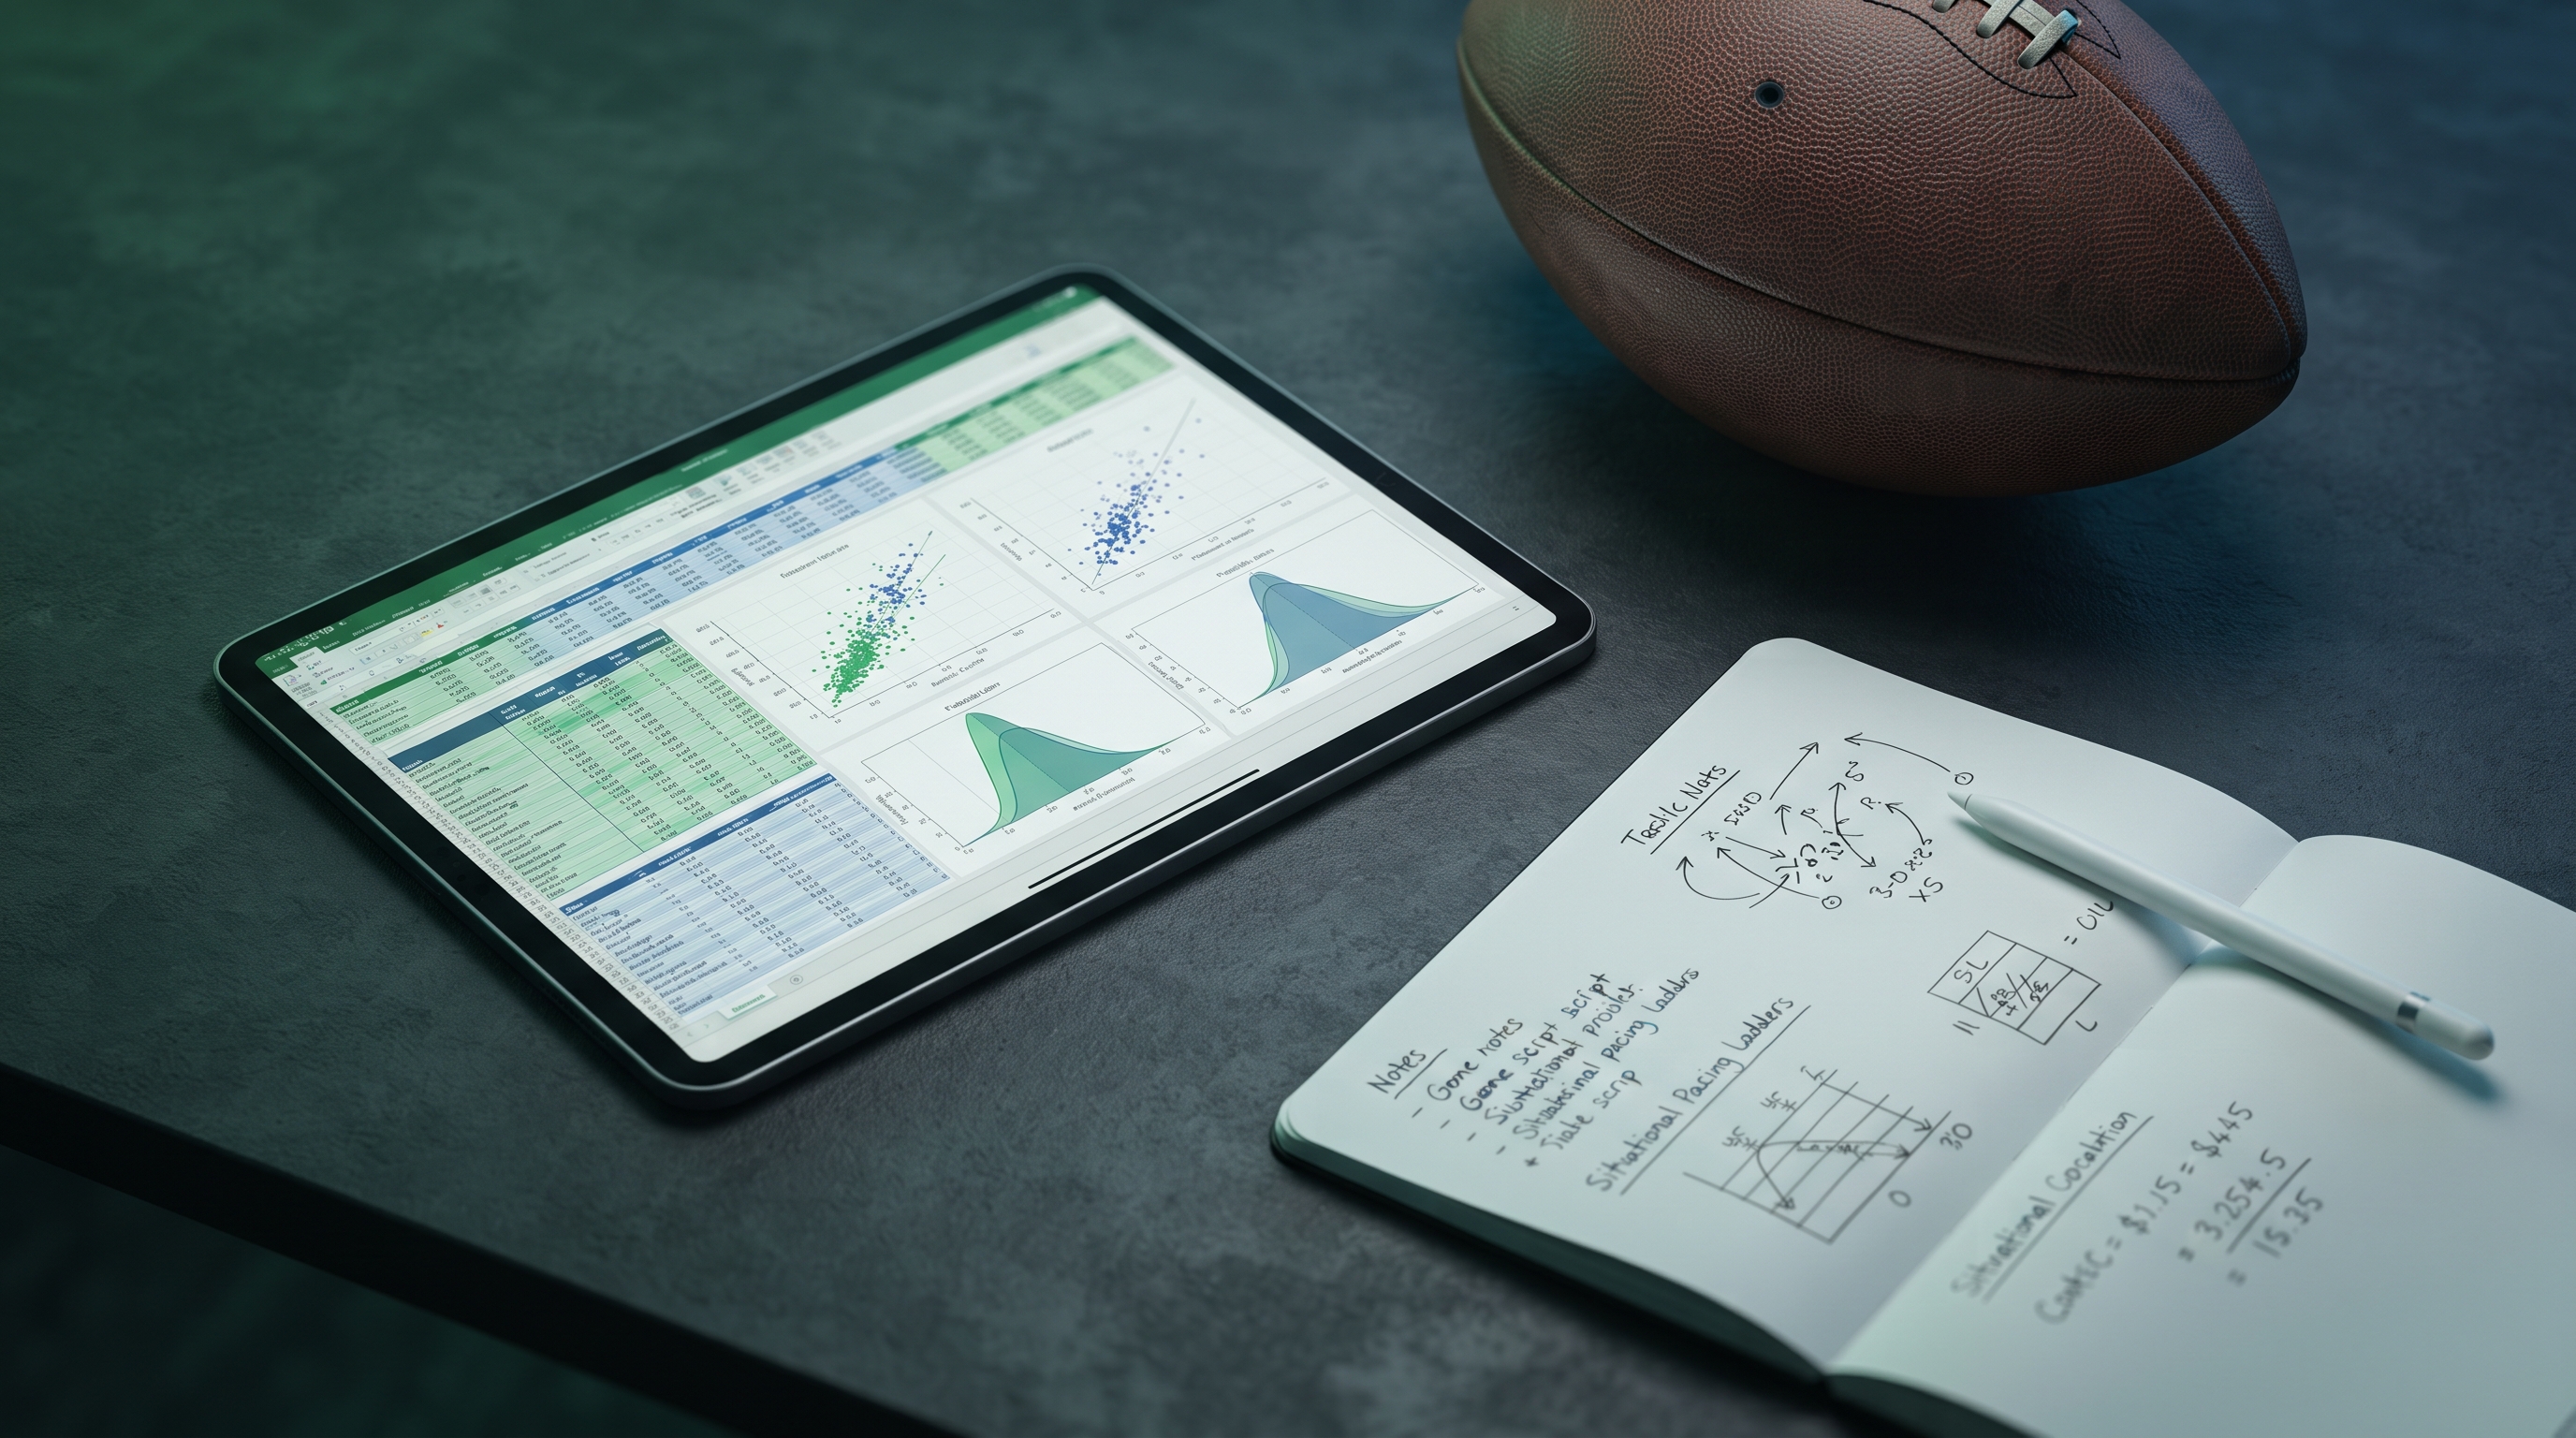
Game script is the broad arc of how a game is likely to play out. For college football props, it tells us who’s on the field, who’s touching the ball, and how often. When you look at front running scenarios, the favorite controls the game, leads early, and salts it late, which leads to a higher rush rate, slower pace after halftime, suppressed quarterback attempts, inflated running back carries, and backups seeing touches in the fourth quarter. On the flip side, back foot catch up situations happen when an underdog trails for long stretches, bringing elevated pass rates, more two minute snaps, more wide receiver and tight end targets, and higher sack risk. Shootouts occur when both sides score, pace stays fast, and passing rates climb on neutral downs, making it a great time to target wide receiver and tight end overs while watching running back receptions pop. Slogs feature low totals, slow pace, and defenses trading field position, which favors running back carries, unders on deep aDOT receivers, and lower quarterback yards unless one team falls behind. Scripts are never static since a game can flip from front running to catch up the second a fourteen point swing lands, but pre game lines like the spread and total, pace splits, and matchup traits let us set a base case before kickoff.
Mapping spread, total, and pace to actionable team metrics
To move from narrative to numbers, you need to map market and tempo to a few core rates that dictate game flow. Expected plays are driven by combined tempo measured in seconds per play, first down conversion probability, and how often drives extend, where a higher total paired with a fast tempo creates more plays. Neutral run and pass rate tracks a team’s play calling when the score is within seven points in the mid game, serving as your starting baseline for pass rate over expected by situation. Run and pass over expected measures how much a team passes compared to a baseline given down, distance, and time, which is useful for detecting coach tendencies and quarterback autonomy. Success rate predicts drive sustain and total plays, while explosiveness predicts chunk gains that shorten drives and spike scoring. Pressure and sack rate changes completion probability, depth of target, scramble rate, and interception risk while shifting the overall pass and run calculus on long downs. Garbage time effects take over when win probability climbs past ninety five percent late, causing pass attempts to crater for the leader while rush attempts from backups spike significantly. When you bind these scripts to metrics, front running lowers second half total plays and pass rate while pushing rush share up, catch up increases second half pass rate and no huddle usage, shootouts maximize total plays and pass rate over expected on both sides, and slogs drop total plays while increasing rush attempts.
Translating scripts to player level levers
For each position, you must connect the game script to its primary prop drivers so you can project performance accurately. For quarterbacks, attempts grow with trailing scripts and fast pace while contracting in front running blowouts, completions track attempts and short aDOT schemes while weather and pass rush lower completion percentages, yards multiply completions by yards per completion where depth of target and yards after catch matter, and interceptions climb with pressure rates, tight coverage, and catch up mode while dropping in sprints and run pass option heavy looks against soft zones. For running backs, carries spike in front running scripts and depress in catch up modes unless the coach is run centric, rush yards tie directly to carries and line yards where stacked boxes cut efficiency and light boxes help, and receptions pop in catch up spots and versus man match teams that blitz while falling in sprints or heavy precipitation. For wide receivers and tight ends, targets scale with pass rate, two minute snaps, and coverage shells where cover two helps the slot and tight end while single high safety looks help deeper outside shots, aDOT shifts based on weather and pressure, and yards per route run acts as a translator from snaps and routes to actual production. Blowouts suppress late pass attempts and boost backup running back attempts, and keeping track of that simple note pays a lot of tickets over the course of a long season.
Data inputs and sources
What inputs matter most
To build reliable models, you need to focus on the inputs that actually move the needle for player props. Opponent adjusted tempo and efficiency set the baseline for plays, success rate, and field position swings. Red zone trips and finish rates act as touchdown prop fuel and dictate running back and tight end usage near the goal line. Drive length and finishing affect total possessions, and remember that hyper explosive teams sometimes create fewer total plays despite scoring efficiently. Coaching fourth down aggressiveness keeps drives alive, raises total plays, and stabilizes underdog offenses. Rotations and depth charts dictate snap share, and specific two minute or red zone packages move props much more than casual fans think. Injuries and weather snowball into significant depth of target shifts, offensive line injuries spike pressure rates, and running back depth changes carry shares across the board.
Where to find it (and how I use it)
For foundational data, CollegeFootballData provides play by play logs and team rates for tempo splits, success rate, expected points added, pressure, coverage hints from formation rates, and situational pass rate over expected. For baseline plays per game and situational splits like home, away, or last three games to anchor possessions and seconds per play, TeamRankings CFB pace is an essential resource. Sports Reference CFB offers player logs, snap clues, target share proxies including receptions and yardage share, and opponent context. NOAA Weather provides game time wind and precipitation ceilings so you can adjust depth of target and pass rate when sustained winds climb above fifteen to eighteen miles per hour. Finally, I cross check fair lines, splits, and tracking with the AI powered prediction tools and profit logs inside ATSwins, which blends projections, betting splits, and unit performance seamlessly into my workflow. Beyond college football, bettors can leverage advanced platforms and a robust sports probability engine to evaluate probabilistic edges across multiple sporting disciplines, ensuring comprehensive data coverage year-round.
Modeling workflow and steps
Step 1: Derive expected possessions from spread, total, and tempo mismatch
Start with the market total to imply expected points, keeping in mind that a high total implies more drives or higher efficiency, with both paths pushing volume. Estimate baseline possessions using historical relationships between total, pace, and success rate, noting that average college football games land near twelve to fourteen possessions per team. Adjust for tempo mismatch because the faster team tends to drag the game upward in plays while the slow team can pull it down if they are favored and efficient. Sprinkle the spread into your script tree by recognizing that a favorite by fourteen or more points carries a higher probability of front running in the second half, which can slightly drop total possession counts late.
Step 2: Convert possessions to team plays using seconds per play and situation adjusted PROE
Pull offensive and defense tempo, then blend them using a sixty forty weight favoring the offense with the ball, adding one to one and a half seconds for road teams facing heavy crowd noise and subtracting time for hurry up programs. Success rate and explosiveness decide whether drives sustain, where a high success rate adds plays and high explosiveness can lower total plays while raising points. Use team baselines from the first half within seven points to set your starting pass and run mix, then build three separate situational ladders for trailing by eight or more, leading by eight or more, and two minute drills, each with an incremental pass rate over expected bump or drop. For weather adjustments, sustained wind over eighteen miles per hour calls for cutting team pass rate over expected by three to seven percent, while heavy rain requires shifting to a shorter depth of target and a one to three percent boost in rush rate.
Step 3: Allocate volume via player shares and opponent tendencies
Allocate rush shares so that the primary running back gets a specific percentage, the backup gets theirs, and the quarterback has a designated designed run and scramble bucket, making sure blowout probabilities slide backups up in the fourth quarter. Allocate target shares by role across outside receivers, slot options, field stretching tight ends, and checkdown running backs, setting separate shares for two minute and red zone packages. Use past route percentages when available, or anchor to snap share and team personnel usage like eleven or twelve personnel groupings. Factor in opponent coverage and box counts, noting that two high safety shells and light boxes improve running back efficiency and slot volume while single high safety looks increase outside receiver depth of target. If the offensive line is outmatched by the defensive line, raise the sack rate, lower the depth of target, and lift running back targets.
Step 4: Translate shares into stat lines
Calculate quarterback attempts by taking team pass plays and subtracting sacks and throwaways, then find completions by multiplying attempts by completion percentage adjusted for pressure and weather. Multiply completions by yards per completion to get passing yards, setting yards per completion from a blended depth of target and yards after catch profile. Multiply attempts by the interception rate, tying that interception rate to pressure, depth of target, and opponent havoc metrics. Multiply team rush plays by rush share to get running back carries, and multiply carries by yards per carry to get rush yards while adding scrambles to quarterback rush yards. Multiply targets by catch rate for receptions, and multiply receptions by yards per reception, noting that deep threats carry higher variance while slot options stay tighter. Convert expected points added per attempt and rush into touchdown probabilities per play, and use red zone play shares to refine the final numbers.
Step 5: Simulate 10,000 games, price edges, and respect limits
Simulate the distribution by varying script paths using spread implied win probabilities, sampling play counts, pass rate over expected ladders, and weather noise, while injecting correlations like trailing states increasing pass rates and pressure lowering depth of target. Compare your results to posted lines by computing the over and under hit rate, converting those probabilities to fair odds, and computing book hold and your personal edge. Prioritize larger edges with tighter variances first, such as receptions over yards for slot receivers or carries over yards for between the tackles runners, and focus on props aligned with multiple levers like script, matchup, and weather. Use fractional Kelly unit sizing to manage drawdowns, watch for sharp market movement, and log closing line value to validate your signal over time.
Practical heuristics and examples
If the favorite is large (≥ 17 points)
When a team is favored by seventeen or more points, the primary running back's over on carries is live, so you should catch those carries in the third quarter before backups enter the game. Quarterback attempts lean toward the under, and while completions and yards can still hit if early efficiency spikes, raw volume remains your enemy. Sprinkle backup running back attempts and receptions late at large plus prices, and take the under on secondary receiver and slot receptions unless the team funnels targets short by design.
If the total is high and both teams are top 20 tempo
When two fast teams clash with a high total, wide receiver and tight end receptions and yards overs become primary targets, prioritizing players with twenty five percent or higher target shares and high route rates. Secondary running back receptions overs are great plays because two high safety shells and nickel alignments leave plenty of underneath space. Quarterback interceptions are not an automatic over here, as high efficiency paired with run pass options and a quick game can lower turnover rates in clean weather.
If it is windy (sustained 18+ mph) or heavy rain
When sustained winds exceed eighteen miles per hour or heavy rain hits, lower your projected depth of target by ten to twenty five percent and expect quarterback passing yards to land under their lines, though completion percentages may hold if teams throw short. Running back rush yards overs are viable, but you must bake in the likelihood of stacked boxes and check offensive line health before forcing overs against heavy fronts. Longest reception unders make a lot of sense for perimeter wide receivers who rely on deep balls.
If facing a triple option or extreme ball control team
When playing against a triple option or extreme ball control offense, look for the under on opposing pass volume because there will be fewer possessions and long, grinding drives. Leading scripts compress second half pace, leaving less garbage time for the underdog to climb back into the game and inflate their stats.
Fast vs slow teams
Plays typically flow toward the tempo dictator if that dictator can actually score, but a fast underdog that cannot stay on schedule will not push total plays up. Fast games force substitutions and player rotations, so if a team is thin at wide receiver or running back, later game usage spikes for the healthy guys who are left on the field.
Pressure and sack rate as a lever
High pressure matchups against inexperienced quarterbacks result in more sacks, a shorter depth of target, more running back checkdowns, and wide receiver deep threats going under on their yardage props. Mobile quarterbacks can counter pressure with scramble yards, so look for rush attempts over or rush yards over instead of relying on traditional passing volume.
Templates and repeatable processes
A simple props worksheet (copy into a sheet)
To keep your process organized, set up a spreadsheet that includes game information covering the opponent, location, surface, weather conditions, spread, and total. Track tempo and plays including offensive and defensive seconds per play, blended pace, expected possessions, and expected plays. Map out your script ladders with neutral, leading, and trailing pass rate over expected along with two minute bumps. Include player inputs like snap rate, route rate, rush share, target share, depth of target, yards after catch, yards per route run, and explosive rates. Add matchup modifiers for box count tendencies, coverage shells, pressure rate deltas, and red zone usage. Output individual player projections for attempts, completions, passing yards, interceptions, rushes, rush yards, receptions, receiving yards, longest reception, and touchdown probability. Finally, compare these to the market by logging book lines, your calculated means, over probabilities, fair prices, edge percentages, fractional Kelly stakes, and relevant watchlist notes.
Game day checklist (90 minutes pre kick)
Ninety minutes before kickoff, confirm all inactives and participation limits to make sure no surprise scratches ruin your projections. Re check hourly NOAA wind and precipitation forecasts to update your depth of target and pass rate assumptions accordingly. Scan for late offensive and defensive line scratches, and update your pressure and sack rate metrics. Validate line movement and record any closing line value captured from earlier entry points. Lock in only the top edges that still exist in the market, and avoid taking on too much over exposure to a single game script.
Edge triage and grading
Grade your edges ruthlessly so you know where to allocate your capital. A level edges offer a five to eight percent or greater edge with controlled variance like receptions and carries. B level edges offer a three to five percent edge or involve higher variance markets like yardage and longest receptions. C level edges represent correlated but thin markets where you should only sprinkle small units for fun.
Validation, tracking, and risk
What to log and why it matters
Always log your pre bet line, closing line, and closing line value percentage, because consistent positive closing line value is the ultimate leading indicator that your process beats the market. Track your results and return on investment per prop and bundle broken down by week and season. Record the specific script label and environmental conditions for every bet, including whether it was a front running, catch up, shootout, or slog game accompanied by weather and injury notes. Keep track of your model version and any manual overrides you made so you can review your drift on a weekly basis.
Small edge filters and unit sizing
Filter out edges under two to three percent unless the variance is exceptionally low and sportsbook limits are friendly. For fractional Kelly staking, take your calculated win probability and book decimal odds, plug them into the Kelly formula, and use a quarter to half of that recommended fraction to drastically reduce volatility. For player props, always cap your maximum stake due to natural market fragility, and scale down your sizing if you notice high correlation across multiple bets in your slip.
Monitoring and documenting change
Conduct a weekly back test where you compare your projected plays, pass rates, and player usage to actual box scores, paying close attention to systematic misses caused by coaches shifting tendencies. Recalibrate your player shares immediately following injuries or depth chart role changes, since a single adjustment can swing ten to twenty percent of a player's expected usage.
Ethics and responsible betting
Stick strictly to regulated betting markets and keep your stakes proportional to your bankroll and risk tolerance. Be transparent with your records, and use tools that consolidate your wagers and performance to stay accountable. Always recognize when markets have grown too efficient, and remember that passing on thin edges is a core requirement for long term profitability.
Worked micro examples
Large favorite with mid total
For a matchup where Team A is favored by twenty one points with a total of forty nine, playing at home in mild wind, plays will run slightly below average because the favorite is likely to bleed the clock in the second half. The script points to front running with a heavy second half rush rate. For props, the running back one carries over is very attractive, so you should allocate fifty five to sixty percent of the rush share to him with a fourth quarter drop to forty five percent as backups enter. Quarterback attempts lean toward the under, especially if sportsbooks hang a neutral script number. Wide receiver one yards can still go over if early efficiency is high, but you should prefer receptions under if target volume gets muted late. Backup running back attempts serve as a great ladder option for small stakes in case the fourth quarter turns into pure garbage time.
Pick 'em shootout with top 20 tempo both sides
When Team B and Team C meet in a pick 'em with a total of seventy three where both teams play fast in low wind, plays will be elevated for both sides and you can expect seventy five to combined eighty five offensive plays per team if success rates hold. The script points to a pure shootout with minimal garbage time. For props, wide receiver one and two receptions and yardage overs are fantastic, and route rate matters much more than name value here. Running back receptions overs are great for pass catching backs, and you should bump their target shares against two high safety shells. Quarterback interceptions are not an automatic over, so check the pressure mismatch; if the offensive line holds up, the interception rate may stay right at average despite the massive volume.
Weather driven unders on aDOT
In a game featuring Team D at Team E as six point underdogs with a total of fifty five and sustained winds of twenty to twenty five miles per hour, plays will be modestly suppressed due to clock running rush plays, keeping completion percentages decent while depth of target plummets. The favorite will likely control the script while the underdog moves to a short passing attack to stay on schedule. For props, quarterback passing yards under for both sides look great at current numbers, and you should prefer completions over attempts for short game quarterbacks if books underprice completion percentages. Running back rush yards over makes sense for the favorite, but you must monitor stacked boxes before going heavy. Longest reception unders are strong plays for perimeter burners.
Triple option drag
When a triple option team faces a spread offense where the option squad is a ten point underdog with a total of forty four, plays will be compressed for both sides due to long, grinding option drives. The script is a slog unless an early turnover flips the field. For props, look for the opposing quarterback attempts under and wide receiver receptions under since the raw usage simply will not be there. Running back carries for the option team will be spread across fullbacks and a backs, so you need to check player logs to identify which back holds the rush share edge.
Common pitfalls and how to avoid them
Mistaking garbage time for a plan
Box scores from blowouts love to lie to you. That wide receiver three who finished with seven targets likely padded his stats in the fourth quarter when the game was already out of reach, so you must always use drive context and snap logs to separate meaningful production from garbage time fluff.
Misreading tempo
Overall plays per game can easily hide slow early pacing and heavily inflated late game two minute drills. Always segment your tempo analysis by score and quarter rather than relying on flat game averages.
Over weighting last week
Playing against a single opponent with an extreme scheme can completely warp a team's season long usage trends. Smooth out your projections by using three to five game rolling averages combined with proper opponent adjustments.
Ignoring offensive and defensive line health
Offensive line injuries swing sack rates, depths of target, and running back yards before contact more than almost anything else. Always check late injury scratches and move your pressure deltas accordingly.
Weather overreaction (or underreaction)
A light drizzle is nowhere near a monsoon, and sustained wind matters far more than rain alone. Always use hourly meteorological forecasts rather than generic weather app icons when adjusting your numbers.
Foundations mapped to position props (quick levers)
Quarterbacks
For quarterback attempts, look up when facing trailing scripts, fast pace, or fourth down aggressive coaches, and look down when dealing with big favorites, heavy wind, or run centric coordinators. For passing yards, look up in high depth of target matchups against single high coverage with clean pockets, and look down during pressure mismatches, two high cloud coverages, or winds over eighteen miles per hour. For interceptions, look up against blitz heavy defenses, trailing scripts, and quarterbacks forcing throws into tight windows, and look down when facing run pass option heavy play calling, screens, and neutral scripts with a lead.
Running backs
For carries, look up during front running scripts, with coaches who feature low pass rates over expected, and when playing on teams with thin running back rooms that consolidate volume, while looking down for underdogs with high pass rates over expected or heavy two minute scripts. For rush yards, look up against light boxes behind dominant offensive lines facing poor tackling defenses, and look down against stacked boxes, negative game scripts, or offensive line injuries. For receptions, look up against high blitz rate opponents, in trailing scripts, and with quarterbacks who excel in the quick game, while looking down during front running slogs, poor route roles, or weather that suppresses overall pass volume.
Wide receivers and tight ends
For targets, look up in pass heavy game scripts, two high safety funnels targeting slots and tight ends, and no huddle paces, while looking down in run first scripts, when deep threats are neutered by wind, or in spread offenses with heavy rotations. For depth of target and yards per route run, look up against single high coverages, weak cornerbacks, and clean pockets, and look down against cloud coverages, strong pass rushes, and heavy rain or wind.
Turning sources into a repeatable process
Data pulls and refresh cadence
On Monday, update your team tempo, success rate, expected points added, and pressure deltas from CollegeFootballData, refresh plays per game and pace splits from TeamRankings, and pull player logs and role notes from Sports Reference CFB. On Thursday, take your first pass at weather forecasts via NOAA and check stadium conditions, then draft your initial projections with base scripts and usage shares. On Friday night and Saturday morning, run your injury and inactive sweeps, finalize your scripts, and run your ten thousand game simulations.
Quick math checks to avoid errors
Remember that quarterback attempts can never exceed dropbacks, where dropbacks equal attempts plus sacks plus scrambles. Total team targets should roughly equal team attempts minus throwaways and spikes; if your sum of individual player targets equals one hundred thirty percent of team attempts, you have double counted your packages. Running back carry shares must sum close to non quarterback rush attempts, and you should always include quarterback designed runs separately from scrambles.
Situational wrinkles that often decide edges
Red zone concentration
Some college offenses love to run heavy thirteen personnel groupings inside the ten yard line, which makes tight end touchdown props far more interesting than raw yardage props. Quarterback power runs inside the five yard line act as a massive touchdown siphon, so you should fade running back touchdowns at poor prices whenever the quarterback takes over the high leverage rushing work.
No huddle and substitution stress
Fast offenses love to punish heavy defensive line rotations, meaning late game running back yards can spike significantly against gassed defensive fronts, supporting running back rush yard overs even in tight games.
Special teams and hidden possessions
Elite return units can consistently add short fields to an offense, increasing touchdown rates without needing to boost total offensive plays, which helps touchdown props without necessarily helping yardage or reception numbers.
Penalty profiles
Flag heavy secondaries extend drives and raise passing attempts, while holding heavy offensive lines can kill drives and suppress total play counts across the board.
Prioritizing props by variance
Lower variance markets are much better for larger stakes, including running back carries, wide receiver and tight end receptions especially from the slot, and quarterback attempts. Medium variance markets include running back rush yards and receiving yards for primary route runners. Higher variance markets like longest receptions and touchdown scorer props for ancillary players should only be sprinkled with small unit sizes. Always align your market variance with your script confidence, meaning that if you are less sure about how the game script will unfold, you should prefer lower variance markets that still benefit if your general read is roughly correct.
From projections to market: a quick comparison flow
Build your mean and your twenty fifth and seventy fifth percentiles for every statistical category straight from your simulation outputs. For an over bet, your calculated mean should exceed the sportsbook line by at least zero point three to zero point five standard deviations for medium confidence, or the probability of the over should be fifty five percent or higher at standard minus one hundred ten odds to turn into a solid edge after book hold. For an under bet, stronger edges often appear because betting markets tend to price ceiling performances much more aggressively than script driven floors. Always record the sportsbook line, your calculated probability, the fair price, and the offered price, making sure to shop around and select the best available number across books whenever possible.
Quick heuristics you can paste into your sheet
When a favorite is favored by seventeen or more points and the total is fifty four or lower, lock in running back one carries and late running back two carries while taking the quarterback attempts under. In pick 'em games within three points with totals of sixty five or higher, target wide receiver receptions and yards, running back receptions, and avoid quarterback interception overs unless the pressure delta is plus six to eight or higher. When winds hit eighteen miles per hour or steady rain falls, drop depths of target by fifteen to twenty five percent, take quarterback yards under, and look at rush yards over while keeping a close eye on offensive line versus defensive line matchups. Against triple option opponents, take opposing quarterback attempts under, concentrate running back carries for the option team, and look live for unders on longest reception props. When a fast favorite plays a slow opponent, total plays rise, so prioritize receiving overs and running back receptions, whereas if a slow team is favored and highly efficient, plays compress and you should lean toward rushing carries.
Little process add ons that help
If a running back never plays in two minute drill packages, cap his receptions no matter how strong the catch up script looks. If a team shifts heavily into twelve personnel against two high safety opponents, tight end routes will rise, making tight end receptions an intriguing contrarian angle. Some offensive coordinators love to script wide receiver screens early in games, meaning props for receptions can cash by halftime before stalling out if the script shifts later on.
Putting it all together on a Saturday
On Saturday morning, run your final updates on weather and inactives, regenerate your expected possessions, plays, and pass rate over expected ladders, and reallocate player shares to reflect any late depth chart changes. Run your simulations and export your top twenty edges categorized by script type. Before placing your wagers, stress test two or three core assumptions like tempo drag, coverage shells, or pressure deltas, asking yourself what breaks first if one of those assumptions flips. When executing, enter your A level edges first since markets move quickly on those numbers, use your B level edges selectively while watching for better live numbers if pre game lines are tight, and log every single play with its stake, sportsbook, timestamp, and core rationale so you can track your closing line value that evening.
Extra checks for live betting (if relevant to your book)
During the first two drives, perform a quick pace check; if both teams are snapping the ball under twenty two seconds per play with zero huddles, immediately lift your totals on receptions and quarterback attempts. Compare your projected pressure reality against what is happening on the field, and if a defensive line is completely dominating, pivot live to quarterback scramble overs or wide receiver depth of target unders. If a favorite races out to a fourteen to zero lead, quickly add backup running back props if they are posted and reduce your exposure to wide receiver and tight end overs.
A short FAQ I get from bettors
How do you decide between receptions vs yards?
Use receptions for slot and underneath receiving roles in catch up scripts or shootouts, and use yards for deep threats operating with clean pockets and zero wind. If weather conditions are poor, receptions can still easily win out, whereas yardage props often struggle to clear their numbers.
Are TD props worth it?
They are strictly price sensitive. You must use red zone shares and touchdowns per play to calculate a true fair price. Quarterback goal line siphons and specialized package players can easily kill running back touchdown value at minus one hundred twenty or worse.
What about INT props?
To bet interception overs successfully, you generally need three things: elevated passing attempts, a real pressure mismatch, and a quarterback style that aggressively forces throws into tight coverage windows. In true shootouts featuring low pressure, interception overs are frequently mispriced by the public.
How early do you bet?
You should bet early in the week if you fully trust your read and sportsbook limits are reasonable, as this is the best way to capture closing line value. Alternatively, bet on game days specifically for weather driven edges and official injury confirmations.
How ATSwins can streamline this workflow
I use ATSwins to centralize my bets, view betting splits for valuable market context, and audit my overall performance. Utilizing an advanced nfl player prop edge finder alongside ATSwins allows you to isolate high value player spots effortlessly. You can upload your projection sheet outputs, tag your wagers by script type, and watch your return on investment break down by category. It is a clean way to stop guessing whether your shootout wide receiver overs are actually making you money, and you can explore the advanced projection tools and tracking features directly on ATSwins. A great practical combo is to build your projections and sims, flag your top props and push them into ATSwins, track your closing line value, win loss record, and return on investment by position and script weekly, and iterate when your back foot scripts underperform by digging into your pass protection assumptions and adjusting your pressure deltas for the following week.
Sources and tools to keep open on prop days
CollegeFootballData is essential for play by play logs, expected points added, success rates, pressure metrics, and situational splits, making it great for pass rate over expected and tempo ladders. TeamRankings CFB pace offers plays per game and pace trends to cross check against your possession math. Sports Reference CFB provides player logs, usage clues, and quick splits for target and yardage shares. NOAA Weather gives you precise sustained wind and precipitation windows for real depth of target adjustments. Finally, ATSwins acts as your dedicated hub for AI powered picks, props, betting splits, and performance tracking that keeps your process fast and accountable, while incorporating specialized capabilities like ai baseball game analysis to support multi sport portfolio building during the summer months.
Conclusion
We learned how to turn spreads, totals, and tempo into college player props that actually make logical sense. The biggest takeaways are that scripts drive game volume, weather matters immensely, and you must always simulate before pricing and tracking your bets. Stick to the basics by checking injuries and pace, setting accurate player shares, and managing your risk carefully. Leverage the expert insights available at ATSwins, an AI powered sports prediction platform offering data driven picks, player props, betting splits, and profit tracking across the NFL, NBA, MLB, NHL, and NCAA, where free and paid plans help you act smarter and make more informed decisions every single week.
Frequently Asked Questions (FAQs)
What does college football player props based on game script actually mean?
It means you are setting or betting player props by first forecasting how the game will flow, including who leads, who trails, and how fast they play. When you build college football player props based on game script, you use likely scenarios like shootouts, slogs, or blowouts to estimate total plays, run and pass rates, and which specific positions will receive volume. If a team is a heavy favorite, the script often leans toward more rushing attempts late, whereas if they are chasing points, you should expect extra passing attempts and targets. It is a simple idea, but it matters immensely for your bottom line.
How do spreads, totals, and tempo shape college football player props based on game script?
Spreads hint at the lead and trail risk, totals point to overall scoring expectations, and tempo tells you how many snaps are likely to occur. When you tie those three factors together, you can accurately size volume for college football player props based on game script, where larger favorites mean more running back carries, tight high total games mean more quarterback attempts and wide receiver targets, and two fast teams mean more total plays for everyone involved. Remember that a slow opponent can drag down the entire game pace, meaning yards and receptions props may sit under their lines even if the offense is talented.
Which pregame stats should I check before building college football player props based on game script?
You should keep your research simple and focused on pace measured in seconds per play, drives per game, neutral run and pass rates, short yardage and two minute usage, target share and rush share history for each player, red zone trips and touchdown rates, wide receiver depths of target, and offensive line versus defensive line pressure rates alongside missed tackle percentages. These metrics help you convert a projected game script into fair numbers for college football player props based on game script by starting with volume through plays, moving to shares to see who gets what, and finishing with efficiency like yards per play and touchdown rates without overfitting a single week's box score.
How do weather and injuries change college football player props based on game script?
Weather can completely rewrite a game script overnight, as wind and heavy rain push teams toward shorter throws and more rushing attempts, leading to a lower depth of target, fewer deep shots, and sometimes elevated running back carries. Heat can force teams to rotate running backs much faster, while snow slows down overall game pace. When dealing with injuries, you adjust college football player props based on game script by shifting usage expectations, such as bumping target shares for the wide receiver two or tight end if the primary receiver sits out, or reducing yards per carry and sack adjusting quarterback attempts if a starting offensive lineman is ruled out. Late news moves volume fast, so rechecking everything sixty to ninety minutes before kickoff is essential for finding plus expected value.
How does ATSwins.ai help with college football player props based on game script?
ATSwins.ai is an advanced AI powered sports prediction platform that turns market odds, pace metrics, and team tendencies into data driven picks, player props, betting splits, and profit tracking across the NFL, NBA, MLB, NHL, and NCAA. For college football player props based on game script, the platform's models estimate total plays, pass and run mixes, and likely player usage so you can easily compare fair lines against the broader market. You gain access to transparent tracking, simple reads, and flexible plan options designed to help bettors make smarter, more informed decisions every weekend.