

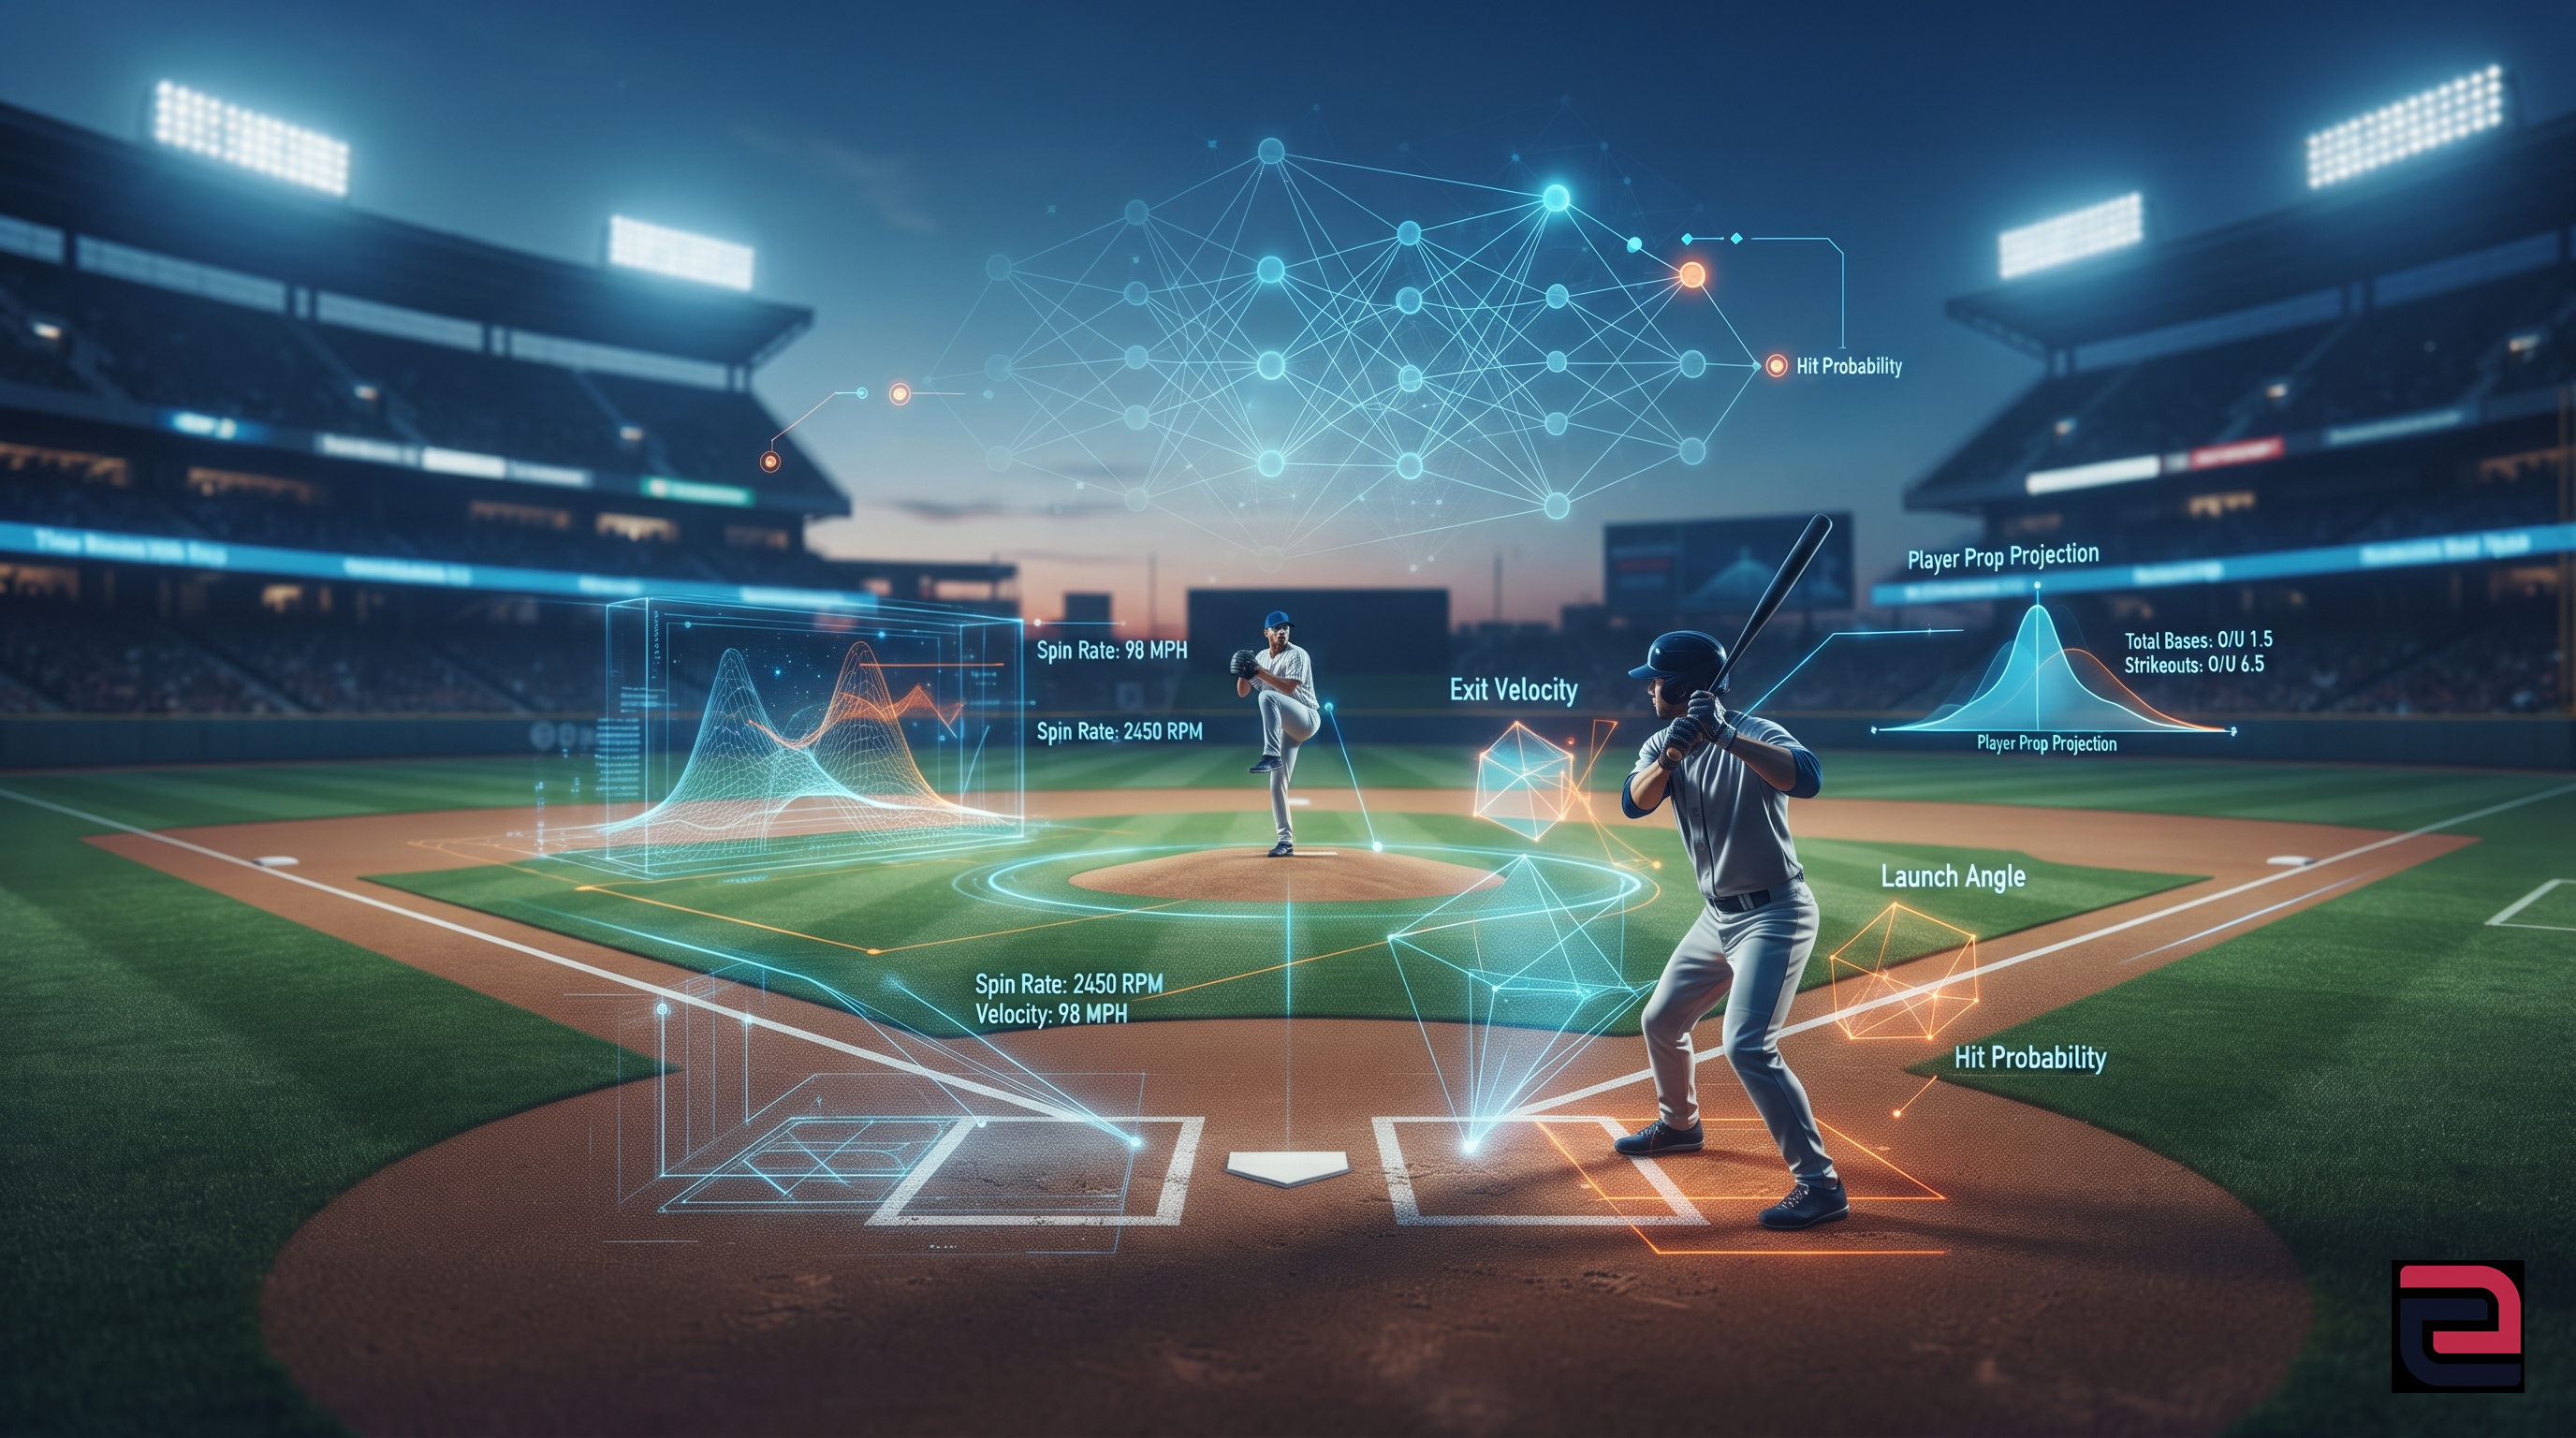
Evaluating baseball player performance on a nightly basis requires moving past simple season long averages and traditional box scores. A modern machine learning mlb player prop model transforms massive streams of tracking data into actionable probabilities for individual player achievements such as strikeouts, hits, and runs batted in. Building such a system demands a careful blend of statistical engineering, domain expertise, and rigorous testing against historical outcomes. Without a structured framework, analysts quickly drown in the immense variance inherent in a 162 game schedule. When building these systems, developers rely on structured data pipelines to process thousands of pitch events every single night. Platforms like ATSwins emphasize that modeling individual success relies heavily on isolating true talent from short term noise, ensuring that a projection reflects underlying capability rather than a lucky three game stretch.
Understanding MLB Player Prop Modeling
At its core, predicting an individual athlete's statistical output for a single game is vastly different from forecasting team outcomes. Team models can often rely on aggregate run differentials and bullpen health, but a MLB player prop value finder must zoom in on individual matchups, plate discipline metrics, and pitch mix interactions. A pitcher facing a lineup with high strikeout tendencies presents an entirely different distribution of outcomes than the same pitcher facing a disciplined, contact heavy batting order. Machine learning algorithms excel in this environment because they can ingest multidimensional datasets and uncover non linear relationships that traditional spreadsheets miss. Instead of assuming a linear relationship between past performance and future output, an algorithmic framework can test thousands of variables simultaneously to see which features actually predict future success. This approach shifts the focus from guessing what will happen to calculating the exact probability distribution of every possible game state.
Core Data Inputs and Feature Engineering
The reliability of any predictive system depends entirely on the quality of the data fed into it. Feature engineering is where the real work happens in sports analytics, transforming raw event logs into meaningful predictive signals. For a batter, raw stats like batting average or home run totals are often too noisy over small samples. Analysts instead rely on underlying Statcast metrics such as exit velocity, barrel rate, launch angle distribution, and whiff rates against specific pitch types. For pitchers, the feature set expands to include spin rates, extension, horizontal and vertical break, and platoon splits against left and right handed hitters. Furthermore, contextual variables such as rest days, travel fatigue, and umpire tendencies play a subtle yet vital role in shaping the final output. By feeding these granular features into a structured pipeline, the algorithm learns how a pitcher's slider movement interacts with a batter's historical vulnerability to breaking balls located low and away.
Choosing the Right Algorithmic Approach
Once the feature set is built, choosing the appropriate machine learning architecture is the next critical step. Different statistical problems require different mathematical tools. Gradient boosting machines and random forests are frequently favored in sports forecasting because they handle tabular data exceptionally well, manage interactions between variables without requiring explicit feature scaling, and resist overfitting when properly regularized. Neural networks can also be deployed, particularly when handling sequential data such as pitch by pitch sequences or batter versus pitcher encounter histories. However, simpler generalized linear models often serve as a reliable baseline to prevent overcomplication. The goal is not to find the most complex algorithm imaginable, but rather the one that generalizes best to unseen data. Overfitting is a constant danger in baseball analytics, where a model can easily memorize past noise and fail miserably when confronted with a new series of games.
Accounting for Ballpark Factors and Weather
Environmental variables can dramatically alter the expected output of any player prop market. Evaluating a hitter without considering the physical dimensions of the stadium is a recipe for forecasting failure. A fly ball with a 102 mile per hour exit velocity and a 30 degree launch angle results in a home run in a hitter friendly park with short porches, but often dies on the warning track in a spacious coastal venue with heavy marine layer air. Machine learning models must explicitly incorporate park factors, altitude adjustments, and atmospheric conditions such as temperature, humidity, barometric pressure, and wind speed and direction. When the wind is blowing outward at Wrigley Field at twenty miles per hour, the entire probability distribution for extra base hits shifts upward. Advanced models ingest real time weather feeds minutes before first pitch to dynamically adjust their projections, ensuring that the final output reflects the actual physical environment the players will encounter on the field.
Calibrating Probabilities and Finding Value
A model that spits out raw numerical projections is only half the battle. Those projections must be converted into true probabilities and compared against available market prices to determine where an edge might exist. This is where probability calibration comes into play. If a model projects a starting pitcher for 6.2 strikeouts, it must also calculate the exact probability that the pitcher records 5 or fewer, exactly 6, or 7 or more, accounting for the natural variance of game outcomes using Poisson distributions or negative binomial regressions. Once these fair probabilities are established, analysts compare them against the implied probabilities derived from sportsbook lines. Finding a discrepancy between a model's true probability and the market price is the foundation of disciplined sports investing. For those looking to streamline this evaluation process, utilizing advanced tools like Oddsmaker Pro can help automate the comparison between model projections and live market offerings.
Common Pitfalls in Baseball Forecasting
Even the most sophisticated algorithms fall victim to common traps that sabotage predictive accuracy. One of the most frequent mistakes is sample size neglect, such as drawing sweeping conclusions from a hitter's first twenty plate appearances of a new season. Regression to the mean is a powerful force in baseball, and failing to weight historical baseline talent heavily enough in early season projections leads to wild errors. Another major pitfall is ignoring late breaking lineup changes or unexpected weather delays. A model trained on a projected lineup becomes instantly inaccurate if a star player is scratched twenty minutes before game time due to tightness or rest. Maintaining disciplined validation protocols and continuously monitoring model error rates helps analysts catch these issues before they compound into costly forecasting mistakes.
Frequently Asked Questions
How does a machine learning model handle player injuries?
Injuries introduce significant uncertainty into sports forecasting. Models typically address this by tracking recent injury reports, monitoring changes in player velocity or sprint speed, and adjusting baseline projections downward when a player is returning from a multi week absence. If a player is scratched entirely, the model must quickly reevaluate the entire context of the game.
Why are baseball player props harder to model than game outcomes?
Individual player props carry much higher variance than full game outcomes. While a team might score close to its expected runs over the course of a game due to the law of large numbers, an individual batter only gets four or five plate appearances. That tiny sample size magnifies the impact of luck, umpire ball and strike calls, and random variance.
Can historical data alone predict future MLB player props?
Historical data is essential, but it is rarely sufficient on its own. Future performance is heavily influenced by current health, fatigue, specific matchup dynamics, and environmental factors like weather. The best models combine long term historical talent baselines with real time, context specific adjustments.
How often should a machine learning sports model be retrained?
Models should be continuously evaluated and retrained periodically as new seasonal data becomes available. Retraining too frequently can cause the model to overfit to recent anomalies, while retraining too rarely means the system misses subtle shifts in league wide scoring environments or pitching trends.