

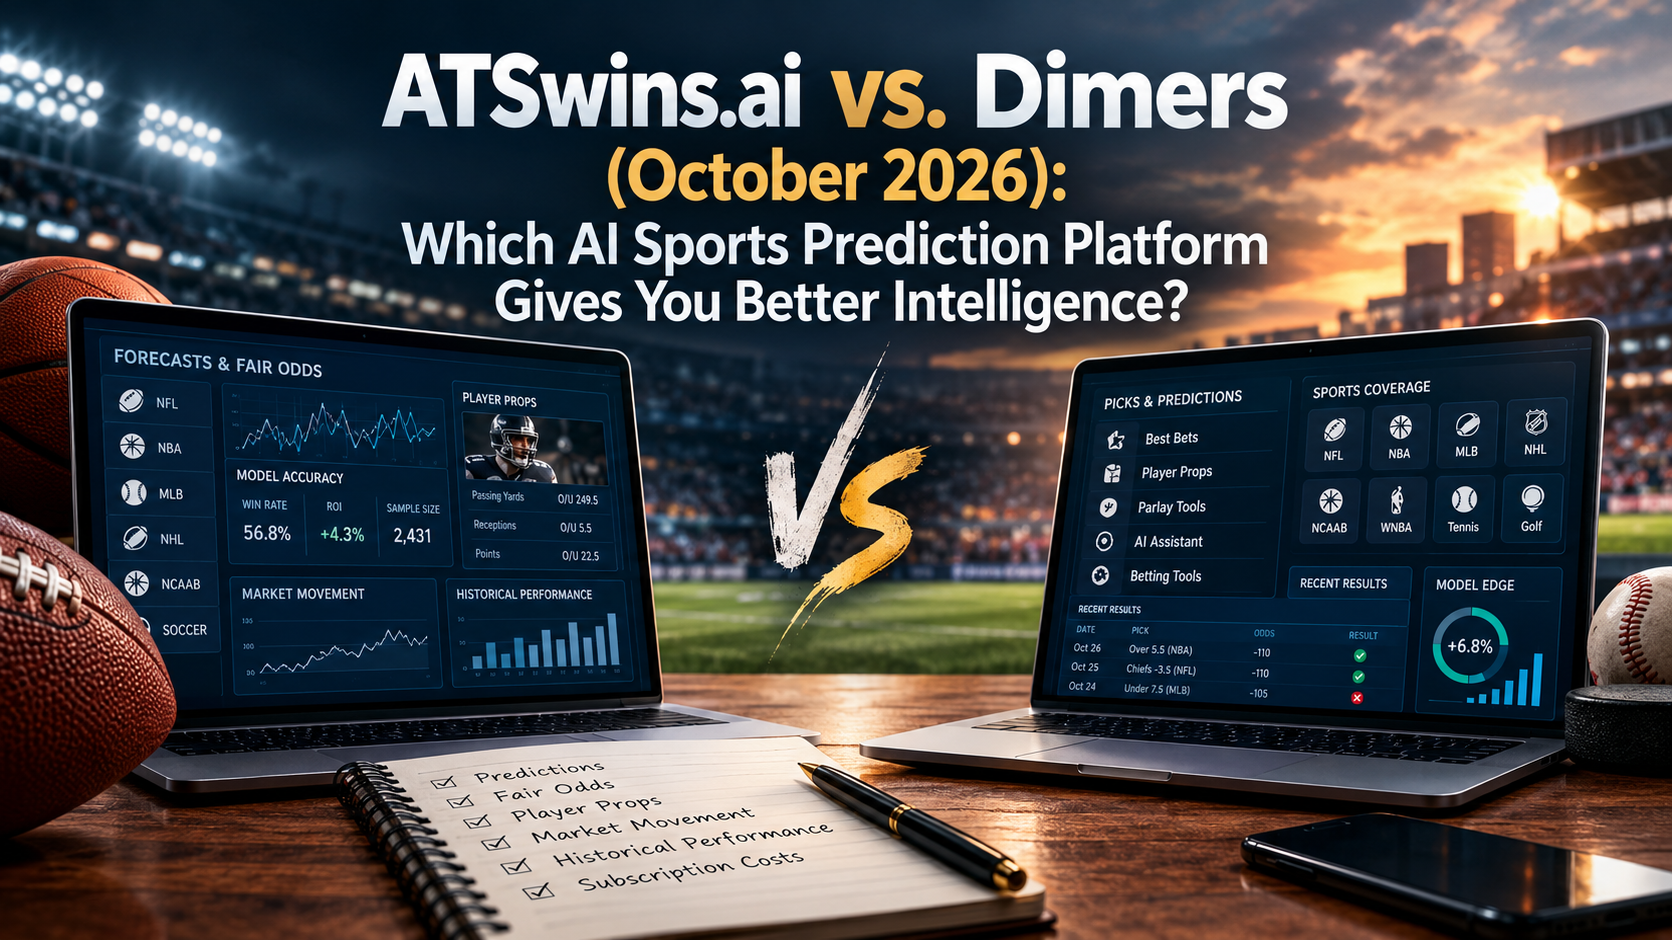
An independent comparison of forecasting methods, market intelligence, historical performance, player props, and subscription costs.
Choosing between ATSwins.ai and Dimers comes down to what you want from a sports prediction platform. Are you looking for a streamlined betting assistant that highlights picks, player props, and potential value across a busy sports schedule? Or do you want a deeper market intelligence platform that lets you compare independent forecasts against sportsbook prices, study model disagreement, and audit performance over time?
Both platforms offer data-driven predictions, simulations, and tools for identifying potential betting value. The difference is how their features support the decision-making process. Dimers emphasizes accessible predictions, a mobile-friendly experience, player projections, and an AI betting assistant. ATSwins puts additional emphasis on model-derived fair prices, the relationship between forecasts and market movement, and historical results that include losing records.
This comparison uses publicly available platform information as of October 29, 2026. Published features and prices can change, and the performance data discussed below should be understood in its stated timeframe rather than as a guarantee of future results.
Executive Verdict: Which Platform Is Better for Your Workflow?
ATSwins.ai is the stronger fit for bettors who want to examine the relationship between model forecasts, fair odds, and sportsbook markets. Its published interface brings together AI projections, simulation results, historical records, and comparisons with Pinnacle opening and closing lines. Its public results also show performance by sport and market, including examples where the numbers are less impressive than a promotional headline might suggest.
AI-Driven Sports Projections+1
Dimers is the stronger fit for bettors who prioritize convenience and breadth of betting tools. Its Pro subscription includes an iOS and Android app, unlimited picks and predictions, player projections, best bets, parlay tools, and Dimebot AI. Its monthly subscription provides a lower initial commitment than ATSwins' stated three-month entry plan.
Neither conclusion establishes that one platform predicts games more accurately. A defensible accuracy comparison requires both services to be tested on the same events, with timestamped predictions, comparable sportsbook prices, identical grading rules, and an out-of-sample evaluation. Without that test, feature comparisons are more reliable than declaring a predictive winner.
At a Glance: ATSwins.ai vs. Dimers
Feature | ATSwins.ai | Dimers |
Primary focus | Forecasting, fair prices, market intelligence | Predictions, best bets, props, and betting tools |
Forecasting methods | AI Model, Simulation Engine, model-derived fair lines | In-house machine learning models and thousands of simulations |
Historical results | Published records by sport, market, grade, and engine | Historical model performance and published betting recaps; available reporting varies |
Team-specific history | Team pages with AI and simulation records and game logs | Game predictions, team analysis, and model-performance tools; equivalent public matrix not established |
Market intelligence | ATSwins Open, Pinnacle comparisons, line movement, and CLV | Odds shopping, model probabilities, edge signals, and betting trends |
Customization | Fixed model outputs from two forecasting approaches | Dimebot AI, filters, Parlay Picker, and other user-facing tools |
Player props | Player projections and graded signals | Player projections, prop recommendations, and best bets |
Sports coverage | NFL, NBA, MLB, NHL, NCAAF, NCAAB, soccer, UFC | NFL, NBA, MLB, NHL, college sports, WNBA, tennis, golf, soccer, and others |
Mobile access | Web-based research and platform tools | Website plus iOS and Android apps |
Entry pricing | $149 for three months, according to the supplied pricing brief | $29.99 monthly on the standard monthly plan shown publicly |
Dimers' official subscription page lists its mobile apps, AI assistant, unlimited picks, player projections, and additional research tools. ATSwins' public site emphasizes forecast-to-price comparisons and historical performance.
Prices and promotions can change. Check the ATSwins website and Dimers subscription page before purchasing.
Historical Transparency: What Happens When the Models Lose?
One of the biggest problems with sports prediction services is selective reporting. A platform can promote a winning weekend, showcase a handful of profitable picks, and leave users without enough information to understand what happened during the losing weeks.
A meaningful audit needs more than a winning percentage. Bettors should be able to identify the market being evaluated, the number of graded predictions, the period covered, the odds available when the prediction was made, and whether pushes or half-wins are included. A 60% record across 20 selections is not equivalent to the same record across 2,000 selections, and neither figure automatically proves profitability.
ATSwins' historical results pages provide records over the last 10 days, the last 30 active days, and the season to date. The platform separates its AI Model and Simulation Engine and presents results across moneyline, spread, and totals markets, with confidence grades from A through D. Its individual sport pages also expose dated game logs, letting readers inspect individual outcomes rather than relying entirely on a summary percentage.
The published figures illustrate why this matters. On the homepage's last-30-active-days snapshot, the NFL AI Model recorded 33 wins and 27 losses on the moneyline, a 55% win rate. Its spread record was 30-27-3, or 52.6% wins when pushes are excluded. Meanwhile, the NFL Simulation Engine's moneyline record was 29-30-1, or 49.2% wins excluding the push. These figures are a dated snapshot of the displayed records, not permanent performance estimates.
That sub-50% simulation record is useful information, not something to conceal. It shows that one engine can struggle in a particular market even while another performs better over the same general period. It also prevents readers from assuming that every ATSwins model output is automatically profitable.
The distinction between accuracy and profitability is essential. At standard -110 spread odds, a bettor needs to win approximately 52.38% of decisions to break even before other costs, assuming every wager has the same odds and there are no pushes. A model winning 52% of its bets can therefore still lose money. Moneyline betting is even more dependent on price because a 65% win rate on heavy favorites can produce a different return from a 45% win rate on plus-money underdogs.
Dimers also publishes performance-oriented material. Its NFL predictions page describes model testing and its Sweet Spots feature, which tracks bet types and edge ranges alongside the number of bets behind each result. Its recent NFL recap articles publish weekly results, including a 13-3 spread record in one Week 4 recap. These are useful reporting features, although a strong individual week is not sufficient to establish long-term profitability.
The practical difference is that ATSwins makes a particularly clear case for inspecting records by sport, market, timeframe, and forecasting engine. Dimers provides performance summaries and betting-focused tools, but its public reporting should be evaluated page by page to determine whether the same historical depth is available for the market you care about.
Player Props: Projections, Results, and Return on Investment
Player props are difficult to evaluate because the projected statistic is only one part of the problem. A quarterback's passing-yard projection, for example, does not tell you whether the over is a good wager at 224.5 yards, 239.5 yards, or 254.5 yards. The posted line, odds, playing-time assumptions, and available alternatives all influence the decision.
ATSwins publishes player-prop projections with confidence grades and covers major leagues including the NFL, NBA, MLB, NHL, NCAAF, and NCAAB. Its player-prop analysis emphasizes comparing estimated performance with the sportsbook's expectations rather than treating a projection as a guaranteed result.
For a rigorous audit, the ideal record would include the player and market, projected figure, actual outcome, sportsbook line, odds, selected side, grade, final result, net units, and ROI. Those fields allow bettors to distinguish a good forecast from a profitable wager. A projection might be close to the final outcome but still lose because the sportsbook set a more demanding line. Conversely, a forecast can miss its central estimate while a wager still wins.
There is an important limitation here: I could not verify a current, comprehensive public ATSwins prop-results dataset containing all those fields and reliable grade-by-grade ROI figures across the NFL, NBA, NHL, MLB, and NCAAF. The platform's older user guide explicitly described its player props as projections whose results were not tracked in that version. That document may not reflect the current platform, but it means specific claims such as double-digit MLB Grade A ROI or negative NHL Grade A ROI should not be presented as confirmed current statistics without a live audit trail.
Dimers offers unlimited player projections, player-prop recommendations, and best bets through Pro. Its NFL tools, for example, include player projections and daily prop recommendations, while its subscription page lists these features among its paid benefits.
For bettors, Dimers' advantage is the convenience of moving from a player projection to a suggested bet within one workflow. ATSwins' analytical appeal is its broader emphasis on comparing forecasts with market prices. Neither advantage proves superior prop returns. A valid comparison needs matching markets, timestamped odds, consistent grading, sample sizes, and net returns after accounting for the prices actually available.
Individual Team Accuracy: Can You Inspect Model Disagreement?
A league-wide record can hide important differences between teams. A model might perform well on favorites but poorly on underdogs, or produce reasonable moneyline forecasts while struggling with totals. Team-level history helps reveal these differences.
ATSwins publishes individual team pages with recent projections and results. The Green Bay Packers team page includes projected scores, final scores, moneyline results, spread results, totals results, and separate sections for ATSwins projections and simulations. Its dated game log gives readers a way to examine the models' actual calls over individual games.
That structure is useful because the AI Model and Simulation Engine should not be assumed to perform identically. One may favor a team by a wider margin, project a different total, or disagree with the other model's assessment of a matchup. The disagreement itself is informative, although it does not tell you which forecast is correct.
For example, a comparison showing a 76% historical success rate for one model and 38% for another would be worth investigating, but only if the figures use the same team, market, timeframe, and grading rules. Those specific percentages are not verified here as current Boston Bruins or Green Bay Packers records, so they should not be treated as published results.
Dimers offers team predictions, projected scores, probabilities, and model-performance tools. Its NFL prediction page also describes Sweet Spots, which break down performance by bet type and edge range. However, I could not verify a directly equivalent public team-by-team matrix with separate AI and simulation accuracy for moneyline, spread, and totals.
The advantage for ATSwins is inspectability: a dated team game log lets you examine where forecasts succeeded and failed. For Dimers, the key question is whether the available performance views offer the same level of granularity for your chosen sport and market.
Oddsmaker Pro and Market Convergence
The central idea behind ATSwins' Oddsmaker Pro is to separate a model's assessment of a game from the price eventually offered by sportsbooks. That distinction matters because predicting the likely winner and finding a profitable bet are two different tasks.
ATSwins describes a workflow that begins with its own forecast and fair-price estimate, then compares that estimate with sportsbook openers and subsequent market prices. Its public homepage displays examples of ATSwins Open alongside Pinnacle opening and closing lines, the final result, and a CLV indicator.
Consider a hypothetical example. Suppose a model estimates that a team has a 55% chance of winning. Its fair decimal odds would be approximately 1.82, before accounting for any desired margin of safety. If a sportsbook offers decimal odds of 2.00, the price implies a 50% break-even probability. The difference could represent value if the model's estimate is well calibrated and the price is genuinely available.
That final condition is important. A probability gap does not automatically mean a profitable wager. The model might be wrong, the market may have incorporated information the model missed, or the offered price may disappear before a bettor can act.
Market convergence adds another layer. When an independent forecast, sportsbook opening price, sharp-market movement, and broader public consensus point in different directions, the disagreement can identify a game worth investigating. It does not prove that one side is informed or that the market is wrong.
Dimers approaches the same broad problem through probability and edge displays, odds shopping, High Edge and Sweet Spot signals, and filters for sorting opportunities. Its app promotes bet previews, smart notifications, sharp signals, and an AI assistant.
The distinction is one of emphasis. ATSwins makes the relationship between its own fair prices and the market a central part of its public-facing research workflow. Dimers focuses on turning its forecasts and price comparisons into accessible betting recommendations.
Closing Line Value: Does the Model Beat the Market?
Closing Line Value, or CLV, measures whether a bettor obtained a better price than the market's closing price. It is useful because closing prices often incorporate information that becomes available after opening lines are released.
Suppose you back a team at decimal odds of 2.10, and the market closes at 1.90. You obtained a more favorable price than the closing market. That is evidence of positive CLV, although the bet can still lose. The reverse can also happen: a winning bet can have negative CLV if the price moves against you before the event begins.
ATSwins' public Oddsmaker material includes comparisons of ATSwins Open with Pinnacle Open and Pinnacle Close, alongside final game outcomes and CLV indicators. Some examples show favorable market movement, while others demonstrate why every forecast should be evaluated individually.
A stronger audit goes beyond selected examples. It would report average absolute forecast error, the proportion of predictions that beat a defined closing benchmark, the sample size, and results by sport and market. It should also show instances where Pinnacle's closing number performed better than the model's opening estimate.
This last point matters. Pinnacle's closing line is not a perfect prediction of the final score, and its error cannot be compared directly with a moneyline forecast unless the metrics are appropriately normalized. Still, openly showing when the market outperforms a model is a valuable diagnostic practice.
Dimers offers model probabilities, odds comparisons, and value-oriented signals. Its public materials also discuss testing its models against historical games. However, I could not verify an equivalent public audit that consistently reports ATSwins Open versus Pinnacle Open and Close, final margin, average absolute error, and market-beat percentage in one standardized dataset.
For bettors who care about CLV, the important question is not whether a platform advertises sharp picks. It is whether you can independently examine the prices, timestamps, sample sizes, and methodology behind its claims.
Sports Coverage and Subscription Costs
Both platforms cover the major North American leagues, but Dimers has a broad selection of additional competitions. Its official subscription page lists NFL, college football, NBA, WNBA, MLB, NHL, men's and women's college basketball, tennis, golf, soccer competitions, and other sports.
ATSwins' published coverage includes NFL, NBA, MLB, NHL, NCAAF, NCAAB, soccer, and UFC. That mix makes it relevant to bettors interested in major American sports alongside selected international competitions and combat sports.
Dimers has a clear convenience advantage for mobile users. Its subscription includes iOS and Android access, and its AI assistant and filters support a workflow that can move quickly from a daily slate to a shortlist of bets. Its monthly plan also lets users start without committing to an entire season.
The supplied ATSwins pricing brief lists three plans: $149 for three months, $279 for six months, and $499 for one year. Those amounts work out to approximately $49.67, $46.50, and $41.58 per month, respectively. The same brief specifies a seven-day trial. However, the current public ATSwins information I could verify mentions a five-day trial, and I could not independently confirm all three subscription prices. These figures should therefore be checked against the live checkout page before publication.
Dimers' standard subscription page lists $29.99 monthly, $149.99 for six months, and $199.99 annually, while promotional prices may be lower. Its monthly option is the easier way to test the service with less upfront spending.
The pricing trade-off is straightforward. ATSwins may appeal to users who expect to spend more time comparing forecasts, prices, and historical records. Dimers is easier to try on a monthly basis and bundles mobile access with its broader set of betting tools. A lower subscription cost, however, says nothing by itself about the value of the predictions.
Final Verdict: Which Platform Should You Choose?
ATSwins.ai and Dimers solve overlapping problems, but they serve somewhat different workflows.
Choose ATSwins.ai if you want to study model-derived fair opening lines, compare forecasts against sportsbook prices, inspect Pinnacle market movement, and review results across different sports, markets, and forecasting engines. Its public team pages and historical results provide a useful foundation for evaluating how predictions perform beyond a handful of promoted picks.
Choose Dimers if you want an accessible betting assistant with mobile apps, player projections, parlay tools, daily recommendations, and a flexible monthly subscription. Its broad sports coverage and integrated research tools make it a practical option for bettors who want to evaluate opportunities without building their entire workflow around market auditing.
For serious bettors, the deciding factor should be the quality of the evidence, not the confidence of the marketing. Compare calibrated probabilities, the odds available at the time of each prediction, closing-line performance, net returns, and the size of the historical sample. Also consider whether the platform reports underperforming markets as openly as successful ones.
Neither platform has established a universal accuracy advantage in this comparison. That would require an identical, timestamped, out-of-sample test using matched events, prices, and grading rules.
Frequently Asked Questions
1. Is ATSwins more accurate than Dimers?
There is not enough comparable evidence to make that claim. ATSwins publishes sport- and market-specific records, while Dimers provides model-performance information and selected historical recaps. A fair comparison requires matched predictions, timestamps, sportsbook prices, and consistent grading rules. Overall win rates from different samples are not sufficient to determine which model is better.
2. Does ATSwins publish losing predictions?
Yes. Its public historical results include losses and pushes alongside wins, with records organized by sport, market, forecasting engine, timeframe, and confidence grade. Its published NFL Simulation Engine moneyline record of 29-30-1 in the referenced 30-active-day snapshot is one example of a sub-50% result.
3. Can ATSwins show the historical accuracy of a specific team?
Yes. Its Green Bay Packers team page provides recent projected scores, final scores, and moneyline, spread, and totals results. Separate projection and simulation records help users investigate model performance at the team level.
4. What does Dimers offer that ATSwins may not?
Dimers offers an integrated iOS and Android experience, Dimebot AI, Parlay Picker, player projections, and a wide selection of betting tools. Its published coverage also includes sports such as WNBA basketball and golf. These are meaningful advantages for users who prioritize mobile convenience, accessible recommendations, and broad sports coverage.
5. Which platform is cheaper to start with?
Dimers has the lower upfront commitment with its standard $29.99 monthly plan. The ATSwins pricing brief lists a three-month entry plan at $149, equivalent to $49.67 per month. Because ATSwins' current public pricing and trial duration could not be fully verified against that brief, confirm the current checkout terms before purchasing.
Official Sources and Further Reading
ATSwins.ai homepage and public performance records: https://atswins.ai/
ATSwins.ai methodology and platform information: https://atswins.ai/learn-more/
ATSwins.ai historical soccer results example: La Liga Results
ATSwins.ai team-level records: Green Bay Packers
ATSwins.ai player-prop analysis: MLB Player Prop Edge
Dimers official website: https://www.dimers.com/
Dimers subscription and current pricing: https://www.dimers.com/subscription
Dimers mobile app features: https://www.dimers.com/app
Dimers NFL predictions and model information: https://www.dimers.com/nfl/predictions
Dimers betting picks and sports coverage: https://www.dimers.com/picks