

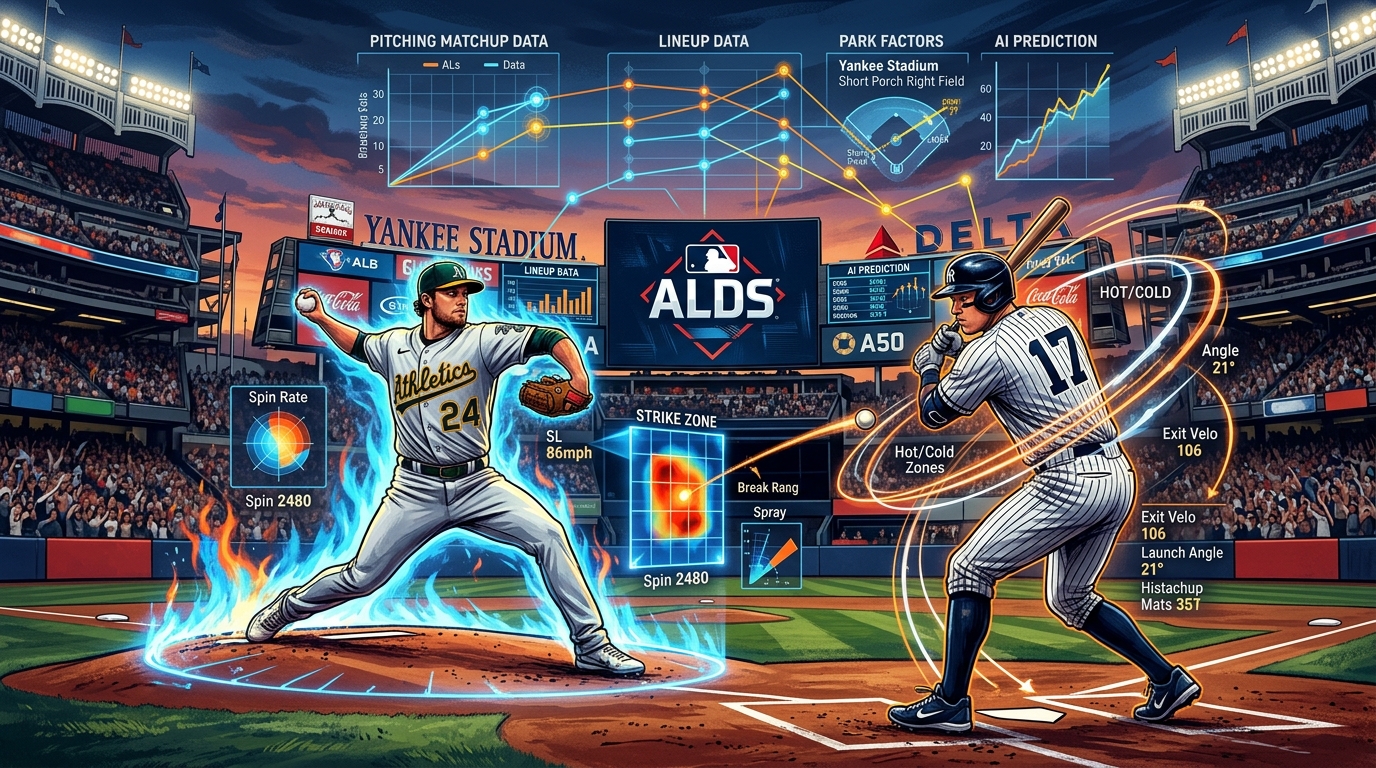
October baseball has a different feel to it.
During the regular season, there is usually time for a bad week, a cold hitter, or a bullpen mistake to disappear into the bigger picture. Over 162 games, things tend to even out. The playoffs do not give you that luxury.
The American League Division Series is only a few games long, and that changes almost everything.
A starting pitcher can have one bad inning and put his team in a hole that is almost impossible to climb out of. A reliever who normally gets one day off can suddenly be asked to throw two innings. A bench player who barely mattered during the regular season can end up getting one of the biggest at-bats of the series.
That is why I think ALDS predictions need to go a little deeper than simply comparing regular-season records.
I want to know who has the better starting pitching, but I also want to know how those starters match up with the opposing lineup. I want to know which bullpen is actually available tonight, not just which bullpen had the better ERA over six months. I want to know whether the weather is helping the offense, whether the park fits the hitters, and whether one team has a platoon advantage that could become important in the seventh or eighth inning.
There is also the betting side of it.
A team can be better and still be a bad bet if the price is too high. Another team can have obvious weaknesses and still be worth backing if the market has gone too far in the other direction.
That is where data and modeling become useful.
I am not trying to predict exactly what happens in every inning. Nobody can do that consistently. The idea is to build a realistic range of outcomes, figure out which situations favor each team, and then compare those probabilities with the available betting prices.
That approach is especially useful in a short series because small advantages have less time to disappear.
Table of Contents
ALDS Landscape and Series Format
Pitching Hierarchies and Rest Days
Hitting Profiles and Run Creation Paths
Context Edges That Move ALDS Predictions
Scenario Modeling and Risk Ranges
Practical Workflow Using ATSwins Tools
Hitting, Run Creation, and Defense
Context and Leverage
Scenario Modeling and Risk Ranges
Templates and Quick Reference Tools
Practical Examples of Turning Analysis Into Bets
Data and Verification Resources
Putting Everything Together
Quick FAQs for ALDS Modeling
Closing Workflow
Conclusion
ALDS Landscape and Series Format
Why the Best-of-Five Format Changes Everything
The American League Division Series is a best-of-five series, normally played in a 2-2-1 format.
The higher seed gets Games 1 and 2 at home. The series then moves to the lower seed for Games 3 and, if necessary, Game 4. If the series reaches a deciding fifth game, it goes back to the higher seed.
On paper, that sounds pretty straightforward.
In practice, it creates a lot of different strategic situations.
A team that wins the first two games suddenly has a chance to finish the series on the road. A team that loses the first two is basically playing elimination baseball immediately. A split in the opening two games creates a completely different situation when the series moves to the other ballpark.
That is why I don't like looking at an ALDS as five completely separate games.
The games are connected.
What happens in Game 1 can affect Game 2 because of bullpen usage. What happens in Game 2 can affect the travel day. What happens during that travel day can determine which relievers are available for Game 3.
The same thing happens with starting pitching.
A team that has a chance to finish the series in four games may use its rotation differently from a team that knows it needs to prepare for a potential Game 5. An ace who might normally be held to a normal rotation schedule can suddenly become an option on short rest.
Those decisions are hard to capture with basic season statistics.
You need to think about the actual path of the series.
Why Game 1 Deserves Extra Attention
Game 1 does not technically count more than any other game. It is still just one win.
But winning it can change the entire shape of the series.
If the home team wins Game 1, it gets to enter Game 2 without the same level of pressure. If the visiting team steals the opener, suddenly the higher seed has to respond immediately.
From a betting perspective, that means the Game 1 number deserves more attention than just looking at the two starting pitchers.
I want to know what happens if the game is close after five innings. Which bullpen is likely to take over? Who is available? Which manager is more likely to use his best reliever before the ninth?
Those questions can matter just as much as the difference between the two starting pitchers.
Home Field Is Helpful, But It Is Not Magic
Home field obviously matters in the postseason, but I think bettors sometimes give it too much credit.
The park itself matters.
Some stadiums are better environments for home runs. Others suppress home runs but create more doubles or triples. Certain parks can reward pull-heavy hitters, while others give outfielders more room to cover.
So instead of simply adding a generic home-field adjustment, I would rather look at the specific environment.
A team playing at home in a park that fits its offensive profile may deserve more of an adjustment than a team whose home park does not really complement its strengths.
Travel also matters.
If the schedule gives a bullpen an extra day of rest, that can be significant. If a team has used its top relievers heavily before a travel day, that day can essentially act as a reset button.
That is particularly important in October because managers are much more willing to use their best pitchers in high-leverage situations.
Rest Versus Rust
There is another interesting issue when a team has several days off before the ALDS begins.
Rest is obviously valuable for pitchers.
A starting pitcher gets additional recovery time. Relievers can enter the series without having worked several games in a row.
Hitters are a little harder to evaluate.
Some players may benefit from the break. Others may need a few at-bats before their timing feels normal again.
I would not put a huge penalty on a team simply because it had several days off. That would be too aggressive.
Instead, I think it makes sense to recognize that there may be a little more uncertainty in the first game.
Maybe the offense comes out swinging. Maybe it looks rusty for a few innings. There is no reason to pretend we know which one will happen.
The model can simply allow for a slightly wider range of possible outcomes.
Pitching Hierarchies and Rest Days
Starting pitching is usually where I begin an ALDS projection.
It is easy to look at ERA and decide who has the better rotation. That is also probably not enough.
I want to know how the pitcher is actually getting his outs.
Is he missing bats?
Is he walking too many hitters?
Is his velocity stable?
Has his pitch mix changed recently?
Is he giving up hard contact?
Does he have a big platoon split?
How long can he realistically stay in the game?
That last question is especially important.
A pitcher who is great for five innings is not necessarily as valuable as a pitcher who can consistently get through six or seven. At the same time, a manager with a dominant bullpen may not care as much about getting seven innings from his starter.
The context matters.
Projecting the Starting Rotation
The first step is to map out the expected starters.
Game 1 will normally feature the ace or best available starter. Game 2 usually goes to the second starter. Games 3 and 4 can get more complicated.
That is where you may see a fourth starter, a short-rest option, a bulk pitcher, or some kind of combination.
Game 5 is the most unpredictable.
If everything comes down to one game, normal pitching plans can disappear.
An ace might be brought back on short rest. A reliever might be asked to cover several innings. A starter who normally throws 90 pitches could be pulled after five innings if the bullpen is fully available.
That is why I would never build an ALDS model by assigning a fixed pitcher rating to every game before thinking about the series state.
The situation matters.
Third-Time-Through-the-Order Risk
One of the most important things to consider with postseason starters is how they perform as the lineup sees them again.
Some pitchers are excellent the first two times through the order and become much less effective the third time.
During the regular season, teams may accept that because they need innings.
In October, a manager might not.
If the opposing lineup is getting to a starter for the third time and there is a strong bullpen waiting, there is a good chance the manager makes the move earlier.
That can make a starter's raw innings projection misleading.
A pitcher with a six-inning average might only be expected to go five in this particular matchup.
That means the bullpen needs to cover more outs, which then affects the later games in the series.
Bullpen Availability Is a Huge Piece of the Puzzle
This is one of the biggest things I would watch in an ALDS.
Season-long bullpen statistics are useful, but they do not tell you who is actually available tonight.
A closer with a 2.30 ERA is not the same pitcher in terms of expected value if he threw 30 pitches yesterday and 20 the day before.
The same goes for setup pitchers.
If a manager used his three best relievers in a tight Game 1, that might not matter much if Game 2 is a blowout. But if Game 2 is another one-run game, those missing innings suddenly become a major issue.
That is why bullpen modeling should include availability probabilities.
A reliever who threw 10 pitches yesterday might be highly likely to pitch again.
A reliever who threw 35 pitches may technically be available, but his expected workload and effectiveness could be lower.
Those are two different things.
Pitch Mix Can Create Hidden Matchups
Pitch type is another area where broad statistics can miss something.
Suppose a team struggles against sliders but hits fastballs extremely well.
Now imagine its opponent has a starter who throws a slider nearly 35% of the time and two relievers with excellent sliders.
That is a very different matchup from simply saying the offense ranks fifth in the league.
The same thing works in reverse.
A team might have mediocre numbers against left-handed pitching overall but perform extremely well against the exact pitches thrown by the opposing left-handed starter.
That is the type of detail I want to capture.
The goal is to connect what the pitcher throws with what the hitter actually does well.
Hitting Profiles and Run Creation Paths
Once the pitching side is understood, I turn toward the offenses.
This is where things can get really interesting because playoff lineups are often constructed around specific matchups.
A team might have one group of hitters who are dangerous against right-handed starters and another group that becomes much more important when a lefty enters.
That means the lineup you see in the first inning may not be the lineup that matters most in the eighth.
Power Versus Contact
Power is obviously valuable in October.
One swing can change a game.
But power also creates variance.
A team that depends heavily on home runs can score five runs in one inning and then go quiet for the next seven. A contact-oriented lineup may not have the same home-run ceiling, but it can create pressure by putting runners on base more consistently.
Neither approach is automatically better.
The question is whether the style fits the pitching staff.
If the opposing starter gives up a lot of hard fly balls, power can become especially valuable.
If the opposing pitcher is extremely difficult to square up but occasionally loses the strike zone, patience may be more useful.
Platoon Splits
Platoon splits can become one of the biggest edges in a short series.
A lineup may be loaded with right-handed hitters who crush left-handed pitching. If the opponent has a left-handed starter, that could look like a huge advantage.
But what happens after that starter leaves?
If the opposing bullpen has two quality right-handed relievers, the advantage may shrink.
This is why I like thinking about the entire pitching staff instead of just the starter.
You can have a great platoon matchup in the first five innings and a completely different matchup in the final four.
That matters when evaluating full-game totals and team totals.
Bench Depth
Bench players are another thing that can become much more important in the postseason.
A player who barely starts during the regular season might have an important role as a pinch hitter.
If a team has a left-handed bench bat who hits right-handed pitching well, the manager can save him for exactly the right situation.
The same applies to speed.
A pinch runner can change the value of a single late in a close game.
A defensive replacement can also matter if the team is protecting a lead.
These are not massive adjustments by themselves, but playoff games are often decided by very small differences.
Context Edges That Move ALDS Predictions
Baseball statistics are important, but context can change how those statistics behave.
The ballpark matters.
The weather matters.
The umpire matters.
Roster health matters.
Managerial tendencies matter.
None of these should completely take over a projection. But ignoring them would leave a pretty obvious hole in the analysis.
Park Factors
I would rather look at park factors as a collection of effects than simply call a stadium good or bad for offense.
A park may suppress home runs while increasing doubles.
Another might increase home runs for one type of hitter but not another.
This is especially relevant when evaluating player props.
A hitter with strong pull-side power may benefit more from a certain park than a hitter who relies on opposite-field contact.
That can influence total bases, home-run probability, and even team scoring expectations.
Weather
Weather is one of those factors that can be easy to overuse.
You do not want to see a warm night and immediately bet the over.
But you also do not want to ignore a strong wind blowing toward the outfield.
Temperature and wind can affect how far the ball carries. In borderline situations, that can turn a warning-track fly ball into a home run.
The important thing is to keep the adjustment realistic.
Weather should move your projection.
It should not completely rewrite it.
Umpire Tendencies
The home plate umpire can also affect the game.
A larger strike zone may create more called strikes, fewer walks, and more opportunities for pitchers to get ahead.
A tighter zone can force pitchers to throw more hittable pitches.
That can influence strikeout props, walk projections, and overall run expectations.
I would keep these adjustments fairly small.
One of the easiest ways to mess up a model is to pile small adjustments on top of each other until the final projection becomes unrealistic.
If the umpire is slightly pitcher-friendly, make a modest adjustment.
There is no need to turn a normal game into a projected 2-1 pitching battle just because of the plate umpire.
Lineup Health
Injuries become much more important in a five-game series.
During the regular season, losing a hitter for a week or two is obviously bad, but there are still plenty of games left.
In the ALDS, there may only be a handful of games.
If a team loses a middle-of-the-order hitter, the replacement does not just remove that player's projected production. It can move several other hitters into different lineup spots.
The bench also becomes thinner.
A player who was supposed to be available as a pinch hitter may now have to start.
That creates a chain reaction.
Managerial Tendencies
Managers are another variable that does not always show up in traditional models.
Some managers are very aggressive with their closers.
Others prefer to keep the closer in the ninth.
Some will pull a starter quickly if the lineup starts getting comfortable.
Others are willing to let the starter work through trouble.
You do not have to predict every managerial decision.
But knowing the manager's general tendencies can help establish more realistic assumptions.
Scenario Modeling and Risk Ranges
This is where I think ALDS analysis becomes much more useful.
Instead of asking, "Who is going to win?"
Ask:
"How can each team win?"
That is a better question.
Maybe Team A has the better rotation but Team B has the better bullpen.
Maybe Team A is much stronger at home but Team B has a lineup that matches up extremely well against the opposing starters.
Maybe one team has a clear advantage in Games 1 and 2 but becomes weaker if the series reaches Games 4 and 5.
Those paths should be part of the model.
Building Series Win Probabilities
Start by projecting each possible game.
For every game, estimate the expected scoring environment and win probability based on the likely starters, lineups, park, weather, and bullpen situation.
Then connect those games through the actual 2-2-1 format.
A Monte Carlo simulation can help here.
Instead of running the series once, run it thousands of times.
In one simulation, the favorite's ace might dominate.
In another, he might leave early.
In another, the underdog's bullpen might collapse.
In another, a lineup that was expected to be quiet might hit three home runs.
The point is not to predict which specific scenario happens.
The point is to understand how often each type of scenario happens.
Running 50,000 or more simulations can provide a useful distribution of possible series results, assuming the inputs and assumptions are sensible.
Do Not Hide the Assumptions
A model is only as good as the assumptions behind it.
If you are projecting a starter for six innings, write down why.
If you think a closer has a 75% chance of being available, document the reason.
If you are giving weather a small run-scoring adjustment, keep that assumption visible.
This helps prevent hindsight bias.
After the game, it is very easy to look back and say, "I knew the bullpen would be tired."
If you did not write that down before the game, you probably did not actually know it.
Keeping a record of assumptions forces the process to remain honest.
Game One Can Move the Entire Series
The first game has an outsized effect on the rest of the series because the state of the series changes immediately.
If the favorite wins Game 1, its overall series probability can rise substantially.
If the underdog steals the opener on the road, the market has to reconsider the entire matchup.
That does not mean Game 1 should automatically be weighted more heavily in a mathematical sense.
It means the result changes the conditions surrounding every remaining game.
Bullpen usage changes.
Rotation decisions change.
Managerial risk tolerance changes.
That is what makes the first game so important.
Injuries and Rainouts
A rainout can completely change a short series.
An extra rest day could make a starter available sooner than expected.
It could give a tired bullpen time to recover.
At the same time, a schedule change could create a compressed stretch later in the series.
When something like that happens, I would rerun the series rather than simply making a small manual adjustment.
That keeps the model consistent.
Practical Workflow Using ATSwins Tools
A good ALDS workflow does not have to be complicated.
The biggest thing is consistency.
I would rather have a simple process that gets updated correctly every day than a massive model that takes hours to maintain and ends up using outdated information.
ATSwins can fit into that process by giving bettors a place to work with data-driven projections, betting information, player props, and performance tracking.
The important thing is to use those tools as part of a repeatable process.
Start With the Pitchers
The first thing I want to confirm is the pitching matchup.
Then I look at pitch mix, recent velocity, strikeout and walk tendencies, contact quality, expected workload, and platoon splits.
Recent information is useful, but I would not completely throw out the season-long baseline.
A pitcher who has suddenly gained two miles per hour of velocity is worth investigating.
A pitcher who simply posted two excellent starts is not automatically a completely different pitcher.
That distinction matters.
Build the Lineup
Once the starters are known, I look at the expected lineup.
Who hits well against this pitch mix?
Who struggles?
Which hitters are likely to be protected by the batting order?
Which bench players could enter later?
This is where the matchup starts becoming much more specific.
Add the Bullpen
Then I look at relief usage.
Who pitched yesterday?
Who has pitched three times in four days?
Who is likely unavailable?
Who is the manager's preferred option when the game is tied?
Those questions help turn a generic bullpen rating into a more realistic game projection.
Add Park and Weather
Then I add the environment.
Is this a park where home runs tend to carry?
Is the temperature unusually cold?
Is the wind blowing toward the outfield?
None of these factors should dominate the model, but together they can move the expected scoring environment.
Compare the Projection With the Market
This is the final step.
Suppose your model makes a team a 58% favorite.
If the betting market implies 58%, there may not be much to do.
If the market implies 51%, now you have a potential difference worth investigating.
But even then, I would ask why the market disagrees.
Maybe your model missed an injury.
Maybe the bullpen availability assumption is wrong.
Maybe the market is reacting to information you have not incorporated yet.
That is where the real work starts.
Hitting, Run Creation, and Defense
Defense is often treated as a secondary factor.
In October, I think it deserves a little more attention.
When the expected scoring environment is low, one defensive mistake can be enormous.
An outfielder who takes away a potential double can save a run.
An infielder who turns a difficult double play can end an inning.
A catcher who controls the running game can reduce an opponent's ability to manufacture a run.
That does not mean defensive statistics should suddenly become the most important part of the model.
It means their relative value can increase in the right matchup.
Baserunning
Baserunning works the same way.
A team that consistently takes an extra base can create scoring opportunities without needing another hit.
That becomes especially useful against elite pitching.
If singles and walks are hard to come by, turning first-to-third into a realistic option can be valuable.
But aggressive baserunning also comes with risk.
A caught stealing can erase the benefit of reaching base.
The model should therefore consider both the upside and the cost.
Outfield Defense
Outfield range is particularly interesting in large parks.
A strong defensive outfield can reduce extra-base hits and turn balls that would normally reach the wall into outs.
That can matter when facing a team built around gap power.
Again, it is about matchup context.
The same defensive advantage may not be as meaningful in a smaller park.
Context and Leverage
The deeper I get into playoff modeling, the more I think about leverage.
Not every inning has the same value.
A run in the first inning is useful, but a run in the eighth inning of a one-run game is obviously more important from a win-probability perspective.
That is why bullpen roles matter.
A manager is not simply deciding which reliever is best.
He is deciding which reliever is best for a particular moment.
A setup pitcher who is dominant against right-handed hitters might be used against the middle of the opposing order in the seventh, even if the closer is technically the team's best reliever.
That kind of decision can change the late-game matchup.
Why Small Edges Add Up
A lot of bettors look for one huge edge.
Sometimes those exist.
Most of the time, they do not.
More often, the useful information comes from several smaller edges pointing in the same direction.
Maybe the starting pitcher has a pitch-mix advantage.
Maybe the bullpen is fresher.
Maybe the park fits the offense.
Maybe the lineup has the better platoon options.
None of those alone may be enough to justify a bet.
Together, they might create a meaningful difference.
That is the kind of edge I want to find.
Scenario Modeling and Risk Ranges
A good way to test a projection is to deliberately try to break it.
Suppose Team A has a 60% series probability.
Now change one assumption.
What if its Game 1 starter only goes five innings?
What if the closer is unavailable?
What if the star hitter is scratched?
What if the wind shifts?
What happens to the series probability?
If one tiny adjustment changes the model from 60% to 42%, the original projection may have been too fragile.
That is useful information.
You want to know where the model is sensitive.
Pregame Versus Live Information
The same idea applies during the game.
If a pitcher loses significant velocity in the first two innings, that can be meaningful.
If he gives up one hard-hit ball, that is probably not enough to change everything.
If the umpire's zone is clearly different from expectations, that may deserve an adjustment.
The key is not reacting to every event.
Live betting can become expensive very quickly if every single pitch changes your opinion.
The best live decisions usually come from identifying information that changes the underlying probability.
Templates and Quick Reference Tools
I like keeping a simple series worksheet.
The first section should cover the starting pitchers and expected workloads.
Then come the bullpen tiers and recent usage.
After that, add offensive splits, pitch-type strengths, power, contact, defense, baserunning, park, weather, and umpire information.
The goal is not to build a giant spreadsheet just for the sake of having one.
It is to make sure you do not forget something important when the day gets busy.
Bullpen Availability
A simple bullpen tracker can be incredibly useful.
For every important reliever, record the last appearance, pitch count, whether he has worked on consecutive days, and your estimate of availability.
A reliever who threw 12 pitches is probably in a much better position to pitch again than someone who threw 35.
But do not treat that as a hard rule.
Pitcher recovery varies, and managers have different tendencies.
The best model treats availability as a probability rather than a yes-or-no decision.
Practical Examples of Turning Analysis Into Bets
Once all the analysis is finished, the actual betting decision should be fairly simple.
You have a projection.
You have a market price.
Now you compare the two.
If your projection does not differ meaningfully from the market, there may not be a bet.
That is okay.
One of the hardest parts of betting is accepting that sometimes the correct decision is doing nothing.
Moneyline
The moneyline is the most straightforward market.
If your projected win probability is meaningfully higher than the probability implied by the price, there may be value.
But always check the reason for the difference first.
You do not want to discover after placing the bet that your model was using an outdated lineup.
First Five
First-five markets can be useful when the starting pitcher matchup is much clearer than the bullpen matchup.
If one starter has a significant advantage and both bullpens are uncertain, isolating the first five innings may make sense.
If the stronger team has a massive bullpen advantage, the full-game market may be more attractive.
Team Totals
Team totals are useful when the scoring environment is particularly clear.
A power-heavy lineup facing a pitcher who gives up a lot of hard contact in a favorable park could create an interesting over situation.
A weak offense facing an elite starter in cold conditions with the wind blowing in could create an under situation.
Again, the point is not to bet based on one factor.
The factors should support each other.
Player Props
Player props are where pitch-level information can become especially valuable.
A hitter facing a pitcher whose primary pitch happens to be his biggest strength may have more upside than a basic projection suggests.
Strikeout props can also benefit from looking at the opposing lineup's contact rate and the umpire's strike zone.
The best prop decisions usually come from finding a specific matchup rather than simply betting a player's recent streak.
Data and Verification Resources
Reliable information is critical for postseason analysis.
Official MLB information is useful for schedules, lineups, roster moves, starting pitcher announcements, and game updates.
Pitch-level data can provide information about velocity, pitch usage, movement, contact quality, and matchup tendencies.
Advanced baseball statistics are useful for offensive splits, pitching performance, bullpen usage, and player projections.
Historical information can help with context, but I would be careful with playoff samples.
A hitter going 6-for-12 in a previous postseason does not suddenly mean he has some magical playoff ability.
The sample is simply too small.
The same warning applies to pitchers.
One strong October performance can be memorable without being particularly predictive.
That is why I prefer to use historical postseason information as context rather than as the foundation of the projection.
Putting Everything Together
At this point, the process is pretty straightforward.
In the morning, check the expected starters, schedule, park, and weather.
Then build the pitcher profiles.
After that, work through the expected lineups and platoon matchups.
During the day, keep an eye on bullpen usage and roster news.
About an hour before the game, confirm the lineups and make the final adjustments.
Then compare your numbers with the market.
That last step is important.
Your job is not to predict what everyone else thinks.
Your job is to determine whether the available price is better or worse than your estimate of the true probability.
If the market moves, investigate it.
Do not automatically assume the market is right.
Do not automatically assume your model is right either.
Figure out what changed.
Live Betting
Live betting should start from the pregame number.
That gives you something to compare against.
If the starter loses velocity, you can adjust.
If he is throwing normally but gives up a cheap single, there is probably no reason to panic.
If the bullpen's best reliever starts warming up earlier than expected, that can change the late-game projection.
The same goes for weather.
A sudden wind shift can affect home-run probability.
But again, do not react to every little thing.
The goal is to update when new information actually changes the expected outcome.
Postgame Review
The postgame review is where the process gets better.
Look back at what you expected.
Did the starter throw the number of innings you projected?
Did the manager use the bullpen as expected?
Did the lineup produce the matchup opportunities you thought it would?
Was the weather what you expected?
If the answer is no, figure out why.
Do not rewrite the original prediction after seeing the result.
That is one of the easiest ways to fool yourself.
The point of keeping records is to learn whether the process works, not to make every old prediction look smarter than it really was.
Quick FAQs for ALDS Modeling
How much should recent form matter?
Recent form is useful, but I would keep it in perspective.
A starter who has gained velocity, changed his pitch mix, or clearly improved his command deserves an adjustment.
A hitter who has gone 10-for-25 over the last week does not necessarily deserve a massive upgrade.
The larger sample should usually remain the foundation.
Recent information is there to tell you whether something may have changed.
Is starting pitching more important than the bullpen?
It depends on the series.
Starting pitching has a huge effect early in games, but playoff managers can use their best relievers much more aggressively.
If two starters are close and one team has a much better bullpen, the relief advantage can become extremely important.
That is one reason I like separating first-five projections from full-game projections.
How important is home field?
It matters, but I would not treat it as an automatic game-changing advantage.
The actual park, travel schedule, roster construction, and pitching matchups all influence how valuable home field is.
A team playing in a park that fits its offensive profile may benefit more than a generic home-field adjustment suggests.
Should weather be included?
Absolutely.
Weather can affect how the ball carries, especially when temperatures or wind conditions are unusual.
But it should be a modest adjustment unless conditions are extreme.
Weather should complement the matchup analysis, not replace it.
How can ATSwins fit into an ALDS betting process?
ATSwins can be used as part of a broader data-driven workflow for sports predictions, player props, betting analysis, and performance tracking.
The biggest benefit of having a consistent platform and process is that you can compare information in one place instead of making every decision from scratch.
For a short playoff series, that consistency is important because information changes quickly.
Closing Workflow
If I had to reduce the entire ALDS process to one workflow, it would look like this.
Start with the schedule.
Know the home sites, travel days, and possible Game 5 situation.
Then map out the rotation.
Look beyond ERA and focus on pitch mix, velocity, strikeouts, walks, contact quality, workload, and third-time-through-the-order risk.
After that, evaluate the bullpens.
Do not just look at season ERA. Figure out who is actually available.
Then move to the lineups.
Look at handedness, pitch-type matchups, platoon splits, contact, power, and bench options.
Add the park and weather.
Make reasonable adjustments without letting one variable take over.
Then create game-level probabilities.
Connect those games into a series simulation.
Finally, compare the resulting probabilities with the market.
If there is a meaningful difference and you understand why it exists, you may have something worth considering.
If there is not, there is no reason to force a bet.
That last part is important.
The goal is not to have an opinion on every game.
The goal is to have better opinions when the price gives you a reason to act.
Conclusion
ALDS baseball is one of the best examples of why sports betting is not simply about figuring out which team is better.
The regular season gives us a huge amount of information.
The postseason forces us to figure out which pieces of that information actually matter.
A team's overall record matters.
But so does the starting pitcher.
The starting pitcher matters.
But so does his pitch mix against this particular lineup.
The lineup matters.
But so does the bullpen waiting on the other side of the fifth or sixth inning.
The bullpen matters.
But so does whether its best relievers are actually rested.
Then there is the ballpark, the weather, the umpire, the bench, the defense, the manager, and the state of the series.
That is a lot to keep track of.
It is also why I like using a structured model rather than relying on a quick gut feeling.
The model does not need to be perfect.
In fact, it will never be perfect.
There will always be random events that nobody could have predicted. A bad hop, a bloop hit, a missed call, a hanging slider, or a ball that barely clears the wall can completely change a playoff game.
That randomness is part of baseball.
The point of modeling is not to eliminate it.
The point is to understand the probabilities surrounding it.
If one team has a 60% chance to win, that does not mean it is supposed to win every time. It means the team should win roughly six out of ten similar situations over a large enough sample.
That distinction is incredibly important.
It also explains why a good prediction can lose.
You can have the right process and still get the wrong result.
The real test is whether the process continues to identify value over time.
For ALDS betting, I would rather have a realistic probability range than a fake sense of certainty.
I would rather know that my projection is sensitive to bullpen availability than pretend the number is exact.
I would rather understand three or four realistic ways a team can win than simply say, "They are the better team."
And I would always rather have a smaller edge that I understand than a huge edge that depends on several questionable assumptions.
That is where the combination of baseball data, matchup analysis, probability modeling, and disciplined betting becomes useful.
ATSwins can be part of that process by helping bring together data-driven sports forecasting, player prop analysis, betting information, and performance tracking. The goal is not to replace the bettor's judgment. It is to give that judgment a stronger foundation.
October baseball is going to be unpredictable no matter how good the model is.
That is what makes it fun.
The best approach is not trying to predict every twist.
It is building a process that can handle those twists when they happen.
Look at the starters.
Understand the lineups.
Track the bullpen.
Check the environment.
Run the scenarios.
Compare your probability with the price.
Then make the decision.
That is the basic ALDS workflow I would trust going into October.