

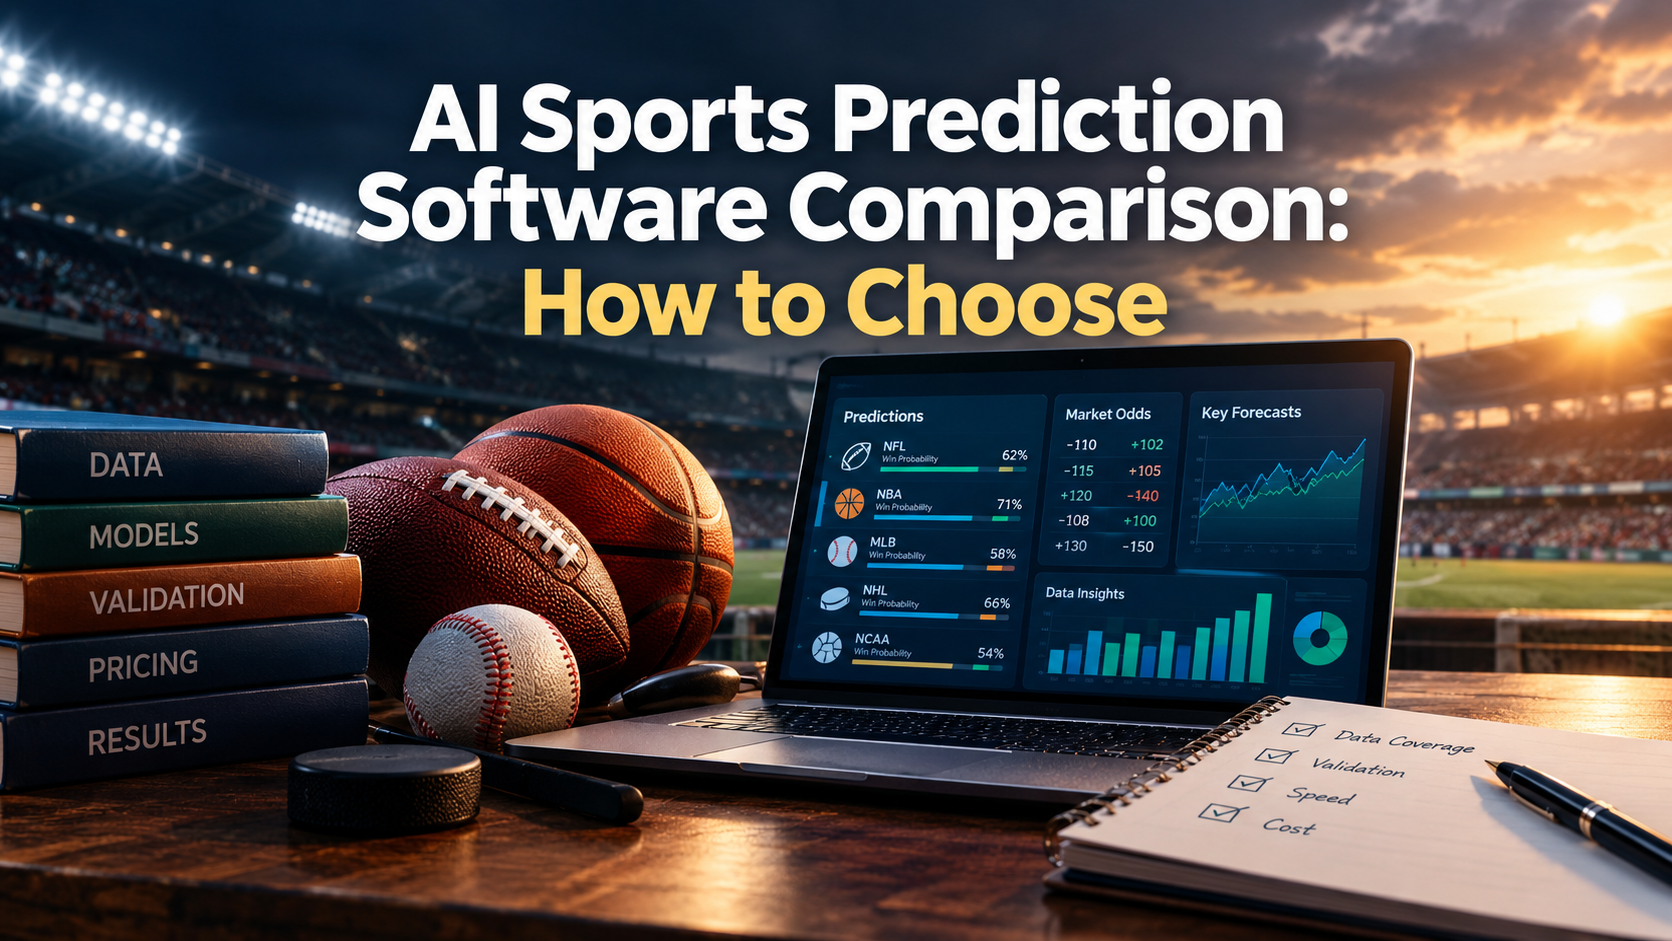
If you're looking into an AI sports prediction software comparison, you probably want something more useful than another list of platforms claiming to have the best picks. The real question is whether the software produces reliable projections, explains its numbers, and updates quickly enough to help you make informed decisions.
A good platform should do more than predict winners. It should help you understand probabilities, compare projected odds with available prices, evaluate player props, and recognize when the numbers do not support a wager. Data quality, validation, speed, transparency, and total cost all matter.
In this guide, we'll break down what to look for, how to test a platform's claims, and which warning signs deserve attention. The goal is to make your comparison practical, repeatable, and based on evidence instead of marketing promises.
Table of Contents
Market Scope and Evaluation Criteria
Data Pipelines and Feature Engineering
Modeling Approaches and Validation
Pricing, Costs, and Integrations
Transparency, Governance, and Risk
How to Test a Platform Before Committing
Putting It Into Practice With ATSwins.ai
Conclusion
Related Posts
Frequently Asked Questions
Key Takeaways
Reliable probability estimates matter more than confident-sounding picks. Compare Brier scores, log-loss, calibration, and closing line value when evaluating performance.
Use chronological backtests and forward testing instead of trusting impressive historical win rates. A two-to-four-week pilot can help reveal practical strengths and weaknesses.
Strong software depends on accurate statistics, timestamped odds, injury information, and dependable updates. Versioning and audit trails make results easier to verify.
Risk management should be part of the process from day one. Start with small stakes, establish exposure limits, and reassess your approach when performance or calibration deteriorates.
ATSwins.ai provides AI-powered sports projections, fair lines, player prop projections, and betting splits across the NFL, NBA, MLB, NHL, and NCAA. Its free and paid plans give users options for exploring data-driven insights and building more informed betting workflows.
Market Scope and Evaluation Criteria
What Does an AI Sports Prediction Software Comparison Actually Cover?
An AI sports prediction software comparison looks at platforms that turn sports data into forecasts for games and betting markets. These can include moneylines, point spreads, totals, and player props. Some tools focus on pre-game predictions, while others provide live forecasts that change as a game develops.
These categories should not automatically be treated as interchangeable. In-play prediction requires rapid data ingestion and frequent recalculation. Pre-game models have more time to process team performance, player availability, travel schedules, and matchup information.
You should also distinguish between team-level and player-level projections. A team model might estimate win probability or expected points, while a player model estimates minutes, targets, shots, or scoring statistics. Each requires different inputs and validation methods.
The biggest distinction is between a forecast and a pick. A pick tells you which outcome a platform favors. A useful forecast also provides a probability or projected value that you can compare against the available odds. Without that context, it becomes difficult to judge whether a prediction represents a meaningful edge.
The Criteria That Matter Most
Start by checking which leagues, markets, and data sources the platform supports. Look for clear information about update frequency, injury adjustments, and odds coverage. A tool that covers several sports may be convenient, but broad coverage alone does not guarantee accurate projections.
Next, evaluate model transparency and testing. The provider should explain its general modeling approach, how it evaluates forecasts, and whether its historical results reflect predictions made before games began. Also consider integrations, export options, customer support, and the full cost of operating the platform.
During an initial demonstration, request timestamped predictions, a description of the available fields, and examples of recent model updates. You want to see actual probabilities rather than a collection of winning picks. If the provider cannot explain how its results were generated, be careful about treating its performance claims as established evidence.
Data Pipelines and Feature Engineering
Why Data Quality Makes Such a Difference
Even an advanced model can produce poor predictions when its inputs are incomplete, outdated, or incorrect. Sports outcomes depend on changing conditions, so reliable software needs accurate statistics, market odds, injury reports, confirmed lineups, and relevant game context.
Useful contextual information includes rest days, travel distance, venue conditions, weather, team pace, player roles, and recent workload. The importance of each factor depends on the sport and market. Weather can influence football totals and baseball outcomes, while projected minutes and usage can be especially important for basketball player props.
Odds also need timestamps. Without them, you cannot tell whether a projection was available before a market moved or whether the comparison relies on prices that appeared later. That distinction matters when testing whether a model could have provided actionable information.
A dependable data pipeline validates incoming records, removes duplicates, handles corrected events, and flags missing values. It should also track which source supplied each field and when that information became available. These details make it possible to investigate unusual predictions instead of guessing where something went wrong.
How Feature Engineering Improves Projections
Feature engineering turns raw statistics into information a model can use. For team markets, this may involve opponent-adjusted scoring differences, recent performance, strength ratings, pace, schedule density, and matchup characteristics. Rolling averages can help capture current form, but they should not replace broader context or account for every situation equally.
Player prop models need a more specific view. Basketball projections may depend on minutes and usage, football models may consider routes and target share, baseball models may account for batting order and handedness, and hockey projections may consider line assignments and power-play opportunities.
Injury information deserves particular attention. A player listed as questionable does not have the same expected role as a confirmed starter. Strong systems account for when an update became available and how much uncertainty remains. This is especially important when late lineup news changes projected playing time.
Every feature should be calculated using information available at the time of the forecast. Accidentally including later information creates data leakage, making a model look more accurate in testing than it would be in real use. Versioned features, documented transformations, and regular data checks help prevent this problem.
Modeling Approaches and Validation
Different Models Serve Different Purposes
Sports prediction software can use several modeling approaches. Gradient-boosting models are useful for classification and regression because they can identify nonlinear relationships in structured data. Logistic regression provides a simpler baseline for estimating win probabilities, while Bayesian hierarchical models can help account for differences between teams and players when available samples are limited.
Count-based models can be useful for outcomes such as goals, runs, or player scoring statistics. More complex neural networks may help with detailed sequences of plays or possessions, but their additional complexity should produce measurable benefits before it is considered worthwhile.
Many practical systems combine multiple models. A player prop workflow, for example, might estimate playing time first and then use that projection to estimate a player's statistical output. The important question is not whether a platform uses the newest model architecture. It is whether its approach performs reliably on data it has not already seen.
How to Validate Prediction Accuracy
Historical testing should follow the timeline of real events. Randomly dividing sports data into training and testing groups can allow information from the future to influence a model's apparent performance. Chronological splits and walk-forward tests provide a more realistic picture of how it might perform during an actual season.
Probability quality deserves more attention than headline win rate. The Brier score measures the difference between predicted probabilities and actual outcomes, while log-loss penalizes predictions that assign very low probabilities to events that occur. For both metrics, lower scores are generally better when comparing equivalent datasets and tasks.
Calibration is another essential check. If a model labels 100 independent outcomes as having a 60% chance of occurring, roughly 60 would be expected to happen over a sufficiently large, representative sample. Actual results will vary, but persistent gaps between predicted probabilities and observed frequencies can reveal a problem.
For player projections, compare predicted values with actual results using suitable error metrics, such as mean absolute error. Also examine prediction intervals to see whether the stated ranges capture outcomes as expected.
Finally, check whether historical performance holds up in forward testing. Freeze the model, record predictions before events begin, and evaluate results after outcomes are known. Closing line value, or CLV, can provide another useful signal by showing whether your recorded odds compare favorably with closing prices. However, CLV and short-term profit are not guarantees of long-term success.
Pricing, Costs, and Integrations
Understand the Full Cost
Sports prediction platforms may charge per user, through usage-based fees, or with a subscription that includes additional charges for higher usage. The advertised subscription price is only one part of the picture.
If you are building an internal system, remember to account for data licensing, computing resources, storage, monitoring, maintenance, and engineering time. More advanced models may also require specialized infrastructure. These expenses can add up even when the software itself looks affordable.
For individual bettors, the more practical questions are whether the available plan covers the sports and markets they follow, whether useful projections are included, and whether a paid upgrade offers enough additional value to justify the cost.
Check Integrations and Update Speed
A platform should fit the way you actually work. Depending on your needs, useful features may include a web interface, downloadable data, an API, automated alerts, or connections to analysis tools. Clear rate limits and documentation make integrations easier to assess.
Update speed is just as important. If an injury changes a player's expected role, how quickly does the projection reflect that information? If odds move significantly, does the platform refresh its fair line promptly?
Ask about model retraining schedules, release notes, support response times, and the way unexpected errors are handled. These details can tell you more about a platform's day-to-day reliability than a long list of technical features.
Transparency, Governance, and Risk
Look Beyond the Marketing Claims
Trustworthy software should explain what its forecasts represent, what data informs them, and where its limitations lie. Version histories and readable update notes help users understand why a projection changed. Validation reports should identify the testing period and method rather than relying on an unexplained accuracy percentage.
Data and model drift also deserve attention. A model developed using earlier seasons may become less reliable as team strategies, player roles, or league conditions change. Monitoring prediction errors and calibration can help identify when a model needs review or retraining.
Explainability can make unusual outputs easier to investigate. Feature importance summaries and individual prediction explanations may reveal whether a projection is being driven by reasonable factors or by a questionable input.
Make Risk Management Part of the Process
No prediction system can eliminate uncertainty. Even a well-calibrated forecast will sometimes be wrong, and a short winning streak does not prove that a model has a durable advantage.
Set limits before evaluating results. Flat staking can make exposure easier to manage, while a conservative fractional Kelly approach requires a credible estimate of the edge and the odds. In either case, establish daily or weekly limits and avoid increasing stakes simply because recent outcomes have been positive.
If calibration worsens, data quality deteriorates, or results diverge sharply from expectations, pause and investigate. Review the inputs, recorded prices, and model changes before continuing. Responsible use means treating projections as decision support, not as guarantees or reasons to chase losses.
How to Test a Platform Before Committing
A short proof-of-value test can help you separate useful software from attractive marketing. Start by recording pre-game predictions, fair lines, available odds, and timestamps for two to four weeks. Keep the evaluation rules consistent so you are not changing your standards after seeing the results.
Compare probability accuracy against a reasonable baseline, then review calibration, CLV, and simulated returns. Pay attention to whether updates arrive promptly after important injury announcements or lineup changes. Large changes in projections should have understandable explanations.
Keep the original predictions rather than allowing historical results to be overwritten by later model updates. This creates a record you can evaluate fairly. Remember that a short test is useful for finding problems, but it usually cannot establish a reliable long-term betting edge on its own.
Putting It Into Practice With ATSwins.ai
ATSwins.ai offers a practical starting point for bettors who want sports projections without having to build an entire modeling system themselves. Its coverage includes the NFL, NBA, MLB, NHL, and NCAA, with team projections, player prop projections, fair lines, and betting splits.
Start by exploring the markets you actually follow. Compare the platform's projections with your own estimates and the odds available to you. When the numbers differ substantially, investigate the reasons rather than automatically trusting either side.
Betting splits can add context by showing how betting activity is distributed, but they should not be treated as proof that a particular outcome will happen. Combine market information with your own assessment of price, probability, and uncertainty.
ATSwins.ai has free and paid plans, allowing users to begin with a smaller evaluation before deciding whether additional features are worth paying for. Keep a record of your findings and judge the platform against your original criteria rather than a few memorable wins or losses.
Conclusion
Choosing AI sports prediction software comes down to evidence, not hype. Data coverage, probability calibration, validation quality, update speed, integrations, and total cost should all influence your decision.
Use chronological testing, preserve timestamped predictions, and compare results against sensible baselines. Make sure you understand the software's limitations and have a clear plan for managing risk.
ATSwins.ai brings together sports projections, fair lines, player prop projections, and betting splits across major North American sports. Whether you are a casual bettor or a more analytical user, the best approach is to test the available insights carefully and decide how well they fit your needs.
Related Posts
Explore more sports prediction and betting analysis guides on ATSwins.ai.
Frequently Asked Questions (FAQs)
What does an AI sports prediction software comparison cover?
It evaluates how platforms use sports data to produce forecasts and probabilities. The main factors include data freshness, supported markets, model validation, calibration, update speed, integrations, transparency, and cost. A useful comparison should help you identify platforms worth testing rather than simply ranking products by their advertised win rates.
How can I verify a platform's performance claims?
Record predictions before games begin and preserve the odds available at the time. Evaluate probability quality with Brier scores and log-loss, check whether predicted probabilities match observed outcomes, and compare available prices with closing lines. Forward testing helps reveal whether historical results translate into live conditions. Remember that short samples can be misleading.
Which data sources matter most?
Look for accurate game statistics, timestamped odds, injury reports, confirmed lineups, and sport-specific contextual information. Weather, rest, travel, playing time, and player roles may also matter depending on the market. Equally important is knowing when information became available, since later information must not leak into earlier predictions.
How does ATSwins.ai fit into this comparison?
ATSwins.ai provides data-driven projections, fair lines, player prop projections, and betting splits across the NFL, NBA, MLB, NHL, and NCAA. Its free and paid plans offer different ways to explore its insights. Users should still evaluate projections against their own requirements and consider accuracy, usability, and cost before deciding which features suit their workflow.
What should I monitor after choosing a platform?
Continue tracking probability accuracy, calibration, CLV, update speed, and any changes in model behavior. Review results regularly and document meaningful updates. If performance deteriorates, investigate data quality and model changes before relying on the projections again. Keep risk limits in place regardless of how promising recent results appear.