Smart betting starts with clean data and a clear edge. As a sports analyst who builds AI models, I want to show how to turn team form, injuries, travel, and odds into prices that make sense—and how to act on them with discipline. This guide breaks down practical steps, simple workflows, and real examples that you can start using today, even if you’re new to modeling.
Table Of Contents
- Building an AI Model for Sports Betting That Respects the Odds
- Problem framing, ethics and compliance
- Data pipeline and feature engineering
- Modeling and training
- Evaluation and backtesting
- Deployment and monitoring
- How-to: step-by-step from clean slate to live bets
- Practical templates you can reuse
- A quick comparison: moneyline vs totals vs ATS
- Tactics that help in real leagues
- Common pitfalls and how to avoid them
- How ATSwins-style workflows make this easier
- Helpful references and tools
- Quick internal pointers
- Frequently Asked Questions (FAQs)
Building an AI Model for Sports Betting That Respects the Odds
Problem framing, ethics and compliance
The first step in any AI betting model is defining your objective. Don’t rush into code. You need to decide whether you’re focusing on moneyline, totals, or against the spread (ATS).
Each one changes what data you use, how you design your features, and how you measure success. Trying to optimize for all of them at once just leads to confusion.
For example:
Moneyline means predicting which team wins.
Totals means projecting whether the combined score goes over or under a line.
ATS means figuring out if a team will cover the spread.
We’ll use ATS as the main example because it’s a great middle ground between skill, data, and market behavior.
A common mistake is to treat betting like simple predictions. But this isn’t about guessing winners—it’s about pricing outcomes. The market offers a price, and you build a model that estimates fair probability. The edge comes from the difference between your fair price and the market’s implied one.
For ATS, this means predicting cover probabilities, converting the market’s spread into a fair number, and betting only when your edge is strong enough to beat risk and fees.
That’s how serious bettors think: price the game, not the team.
Jurisdictions and responsible play
Only operate where betting is legal. Different states and countries have different rules about data use and wagering. Make sure you comply with them.
If you ever automate bets, follow the operator’s policies. And most importantly—play responsibly. Set limits on your bankroll, daily exposure, and loss triggers. When you hit a limit, stop.
ATSwins follows this same philosophy. Their platform uses data-driven insights to inform decisions, not force them. Users can track volatility, profits, and risk across leagues like the NFL, NBA, MLB, NHL, and NCAA, and adjust their risk accordingly.
Bankroll rules you can actually stick to
A model is useless if you can’t manage money. Simple bankroll rules go a long way:
Use 0.5% to 1% of your bankroll per bet. Flat staking works great for beginners, while fractional Kelly works for advanced users with stable models.
Resize weekly, especially during bad streaks, so you don’t overbet. Set a stop-loss—like pausing new bets if you lose three units in a day.
Even the best model can lose short-term. Without bankroll discipline, variance will break you before your edge shows up.
Verifiable data sources and time-aware validation
There’s a lot of messy data out there. Stick to official league sources, reliable event data, verified injury reports, and market odds you can trace.
For each game, you need:
Schedules and results from verified league sources.
Box scores or play-by-play stats.
Injury and rest-day reports.
Weather forecasts for outdoor games.
Market odds with timestamps (open, current, close).
Validation is crucial. You can’t let your model “peek” at data it wouldn’t have had when the bet was made. That means using time-aware validation, not random splits.
Rolling-origin cross-validation is a strong method—it tests your model forward through time, just like real betting. Always record when data was available, what was known, and what wasn’t.
Risk control is built into this mindset. You train only on data your model would realistically see.
Data pipeline and feature engineering
Once your sources are clean, build a repeatable pipeline. Each step should handle schedules, results, box scores, injuries, travel, and market odds.
For feature engineering, focus on what matters to bettors:
Team form over the last 5–10 games, but don’t forget season averages so you don’t overfit. Track player availability and rest. For football, track expected snap shares; for basketball, player minutes and rotations.
You can also create opponent-adjusted metrics like SRS (Simple Rating System) or your own normalized net ratings.
Other great engineered features include:
Elo or SRS ratings that update after every game.
Poisson-based scoring rates for goal sports like soccer or hockey.
Fatigue indicators like back-to-backs, 3-in-4 nights, or long road trips.
Travel miles and time zone shifts.
Even market data can be used as a signal. Track how lines move—open to close—and measure whether your fair odds consistently beat the closing line. That’s how you know your model’s extracting real value.
To prevent data leakage, lock every feature to the time you’d actually bet. If you’re betting two hours before a game, then only use data that existed two hours before. That includes official injury updates, odds snapshots, and rest info.
This is where timestamp alignment becomes critical. Every piece of data must be tied to a decision time, so you can recreate exactly what was known at the moment of placing a bet.
Modeling and training
Start with calibrated baselines
Before diving into advanced methods, start simple. Baseline models like logistic regression help you test ideas without overfitting.
For moneyline bets, logistic regression using Elo differences, rest, injuries, and venue is solid. For totals, try regression on pace, possessions, and efficiency. For ATS, model the probability of covering the spread using team strength differences, rest, and travel.
Once you have a base, calibrate it. Raw model probabilities are rarely accurate. Use techniques like isotonic regression or Platt scaling to make sure your model’s predicted 60% actually happens about 60% of the time.
Then, build from there.
Tree ensembles and gradient boosting
Once your baseline’s calibrated, you can move to gradient boosting models. They’re great for handling non-linear relationships and interactions between features.
Tuning parameters can improve performance, but don’t overcomplicate it early. The goal isn’t to overfit—it’s to find stable, repeatable patterns.
Address class imbalance where needed and blend your model’s outcomes with market priors during early seasons to avoid noisy starts.
Neural networks for sequences and tracking
Neural networks can help when you’re working with sequence data, like possessions or plays. Simple recurrent or convolutional models can process these sequences effectively.
But be cautious—they’re complex, harder to calibrate, and often overkill for small datasets. Use them only when you have deep data, like player tracking or event-level stats.
Rolling-origin cross-validation and time-based splits
Sports data changes over time. Always test your models forward in time, not randomly.
For example, train on 2018–2020 and test on 2021, then roll forward. That’s how to simulate real-world betting. Adjust for season changes, new rules, or shifts in scoring trends.
Converting prices, removing vigorish, and estimating edge
This step is where math meets money.
Convert model probabilities into fair odds, compare them to the market, and remove the vigorish (the bookmaker’s cut).
Your edge equals your model probability minus the fair market probability. If the edge is positive and above your threshold (like 2%), you’ve found a potential bet.
Expected value per dollar depends on both your edge and payout structure.
Always set clear thresholds and avoid small edges that don’t cover risk.
Evaluation and backtesting
You can’t trust a model you don’t test. Backtesting reveals how your system would perform under real conditions.
Metrics that matter include log loss and Brier score for accuracy, ROI and CLV (closing line value) for financial validation.
If your average line beats the closing number, your process is solid—even if short-term results fluctuate.
ATSwins users pay close attention to these measures. It’s about process, not streaks.
Backtest across different scenarios: early season, mid-season, playoffs, home vs away, rest variations, and volatile vs calm weeks.
Stress tests help reveal where your edge actually comes from.
Then track performance by factor: whether profits came from model signals, situational spots, injuries, or stale lines.
For staking, simulate both flat and fractional Kelly strategies. Flat staking is safer for beginners, while fractional Kelly maximizes long-term growth for advanced users.
Always cap daily exposure and avoid stacking correlated bets.
Finally, keep an audit trail. Record every model version, decision time, odds snapshot, and reason for each bet. Reproducibility turns a model from a hobby into a professional operation.
Deployment and monitoring
When you go live, automation becomes your best friend.
Automate ETL (data extraction, transformation, loading) so your data updates on schedule. Version your models so you know which one made which predictions.
When testing two models, split bets evenly for comparison. Track CLV, calibration, and drawdowns to see which performs better.
Build dashboards that show calibration drift, average edge, and CLV trends over time.
Retrain your models when:
A new season starts.
League rules change.
Major roster or performance trends shift.
Calibration decays noticeably.
Consistent retraining and monitoring keep your system sharp and prevent drift.
How-to: step-by-step from clean slate to live bets
Pick your bet type—moneyline, totals, or ATS—and define your decision time (like 2 hours before game).
Build a dataset with multiple seasons, aligned timestamps, and realistic features.
Train a simple baseline, then validate it.
Integrate market priors to stabilize early results.
Upgrade to gradient boosting once your baseline’s calibrated.
Define your edge thresholds and staking plan.
Backtest using rolling validation.
Automate your data and prediction pipeline.
Monitor CLV, calibration, and performance regularly.
These steps form the backbone of a repeatable system that can evolve over time.
Practical templates you can reuse
When tracking your bets, keep detailed records.
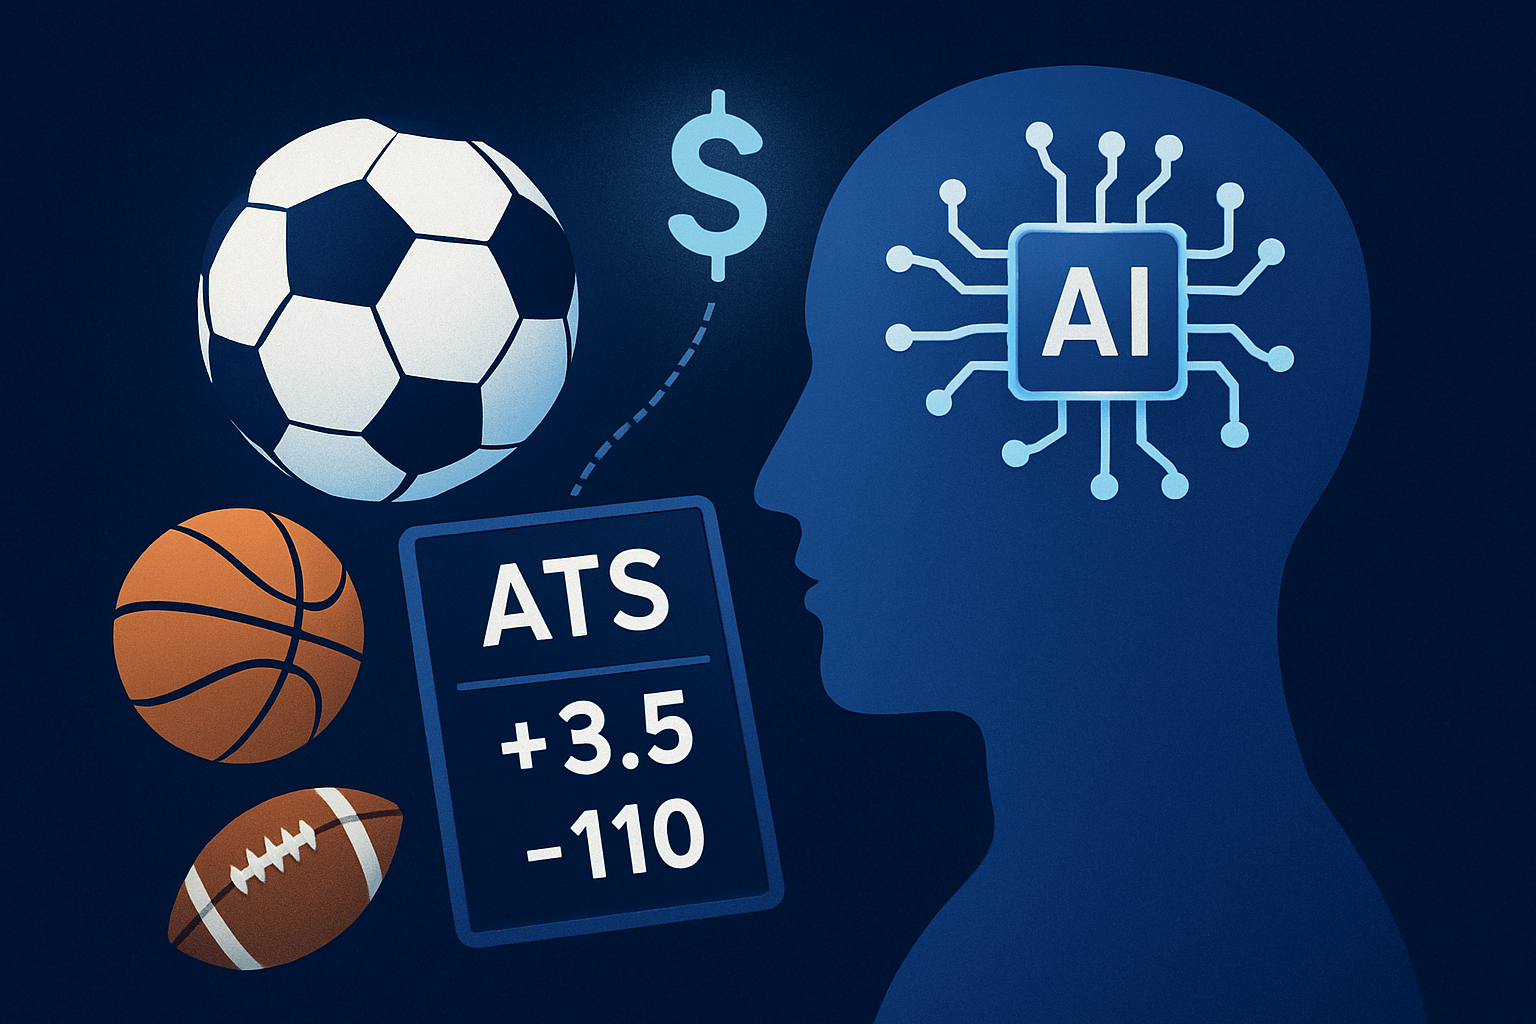
Example Bet Ticket:
Event: Team A vs Team B
Market: ATS, Team A -3.5 (-110)
Decision time: recorded
Model probability: 0.545
Market fair probability: 0.515
Edge: +0.030
Stake: 1.0 units
Model version: noted
Notes: team rest, injury updates, and special conditions
Evaluation Template:
Include total bets, ROI, CLV, calibration, and drawdowns. Segment by home vs away, rest days, and spread size.
Tracking and reflection are what turn data into insight.
A quick comparison: moneyline vs totals vs ATS
Moneyline bets focus on who wins. Totals focus on how many points are scored. ATS focuses on whether a team covers the spread.
Each requires different features and calibration sensitivity. Moneylines react directly to team strength; totals rely on pace and efficiency; ATS demands the most precise balance between both.
Player props behave differently—they’re more sensitive to injuries, rotations, and minute projections. Limits are also smaller, so execution timing matters even more.
Tactics that help in real leagues
NFL and NCAA football
Model drives, field position, and weather. Don’t overreact to single-game noise since the schedule is short.
NBA
Travel and rest are critical. Late injury updates change everything. Focus on pace, possessions, and player impact.
MLB
Pitching and bullpen quality dominate early and late games. Park factors and weather matter a lot.
NHL and soccer
Use goal-based metrics and adjust for travel and fatigue. Expected goals (xG) help stabilize your understanding of real strength.
Common pitfalls and how to avoid them
Data leakage: fix it with timestamp audits.
Overfitting: fix it with rolling validation and testing across seasons.
Ignoring calibration: fix it by adjusting with isotonic or Platt methods.
Chasing every edge: fix it by setting minimum thresholds.
Betting emotionally after losses: fix it with pre-set rules and stop limits.
How ATSwins-style workflows make this easier
At ATSwins, the focus is on giving bettors structure. The platform’s tools center on clarity and discipline—data-driven picks, transparent probabilities, and profit tracking.
Users can view player props, public splits, and their own results by league. The system helps you spot trends, measure performance, and manage risk responsibly.
It’s about fewer bets, higher conviction, and cleaner records. Once you track your edges, odds, and outcomes, you start to truly understand your process—and that’s when confidence builds.
Helpful references and tools
You don’t need fancy systems to start. Just use common data modeling and tracking tools available to most analysts. Keep your processes transparent, documented, and reproducible.
Basic experiment tracking, calibration plots, and dashboards can be set up with simple analytics tools. The goal is to keep learning as you scale.
Quick internal pointers
If you’re debating model upgrades, revisit calibration first.
If results vary by season, check your validation method.
If your model starts missing the close, inspect data drift.
Keep your focus on improvement, not perfection.
Conclusion
Building a sports betting AI model is all about clean data, calibrated probabilities, and disciplined bankrolls. Use time-aligned features, rolling validation, and focus on pricing edges, not predicting winners.
Start small, track everything, and iterate. For help, ATSwins offers a transparent, AI-powered platform that supports smarter decisions through data-driven picks, props, and performance tracking across major leagues.
Smarter betting starts with structure.
Frequently Asked Questions (FAQs)
What is an AI model for sports betting?
It’s a scoring system that converts game data into fair probabilities and expected value. Instead of picking winners, it prices games and compares your odds to the market. When your fair probability beats the market’s, that’s your edge.
Which data should I use?
Team form, player minutes, injuries, rest, travel, pace, and odds history. Always time-align features so you’re using data that would’ve existed when placing the bet.
How do I know if my model works?
Track calibration, Brier score, log loss, CLV, and ROI. A strong model shows stable calibration and beats the closing line consistently.
How should I size bets?
Flat stakes or fractional Kelly based on your edge. Keep each bet small (around 1% of bankroll) and never chase losses.
How does ATSwins help?
ATSwins provides AI-powered picks, player props, and transparent tracking tools that show real performance across NFL, NBA, MLB, NHL, and NCAA. Whether you’re new or experienced, it helps you make smarter, data-based decisions without guesswork.
Related Posts
AI For Sports Prediction - Bet Smarter and Win More
AI Football Betting Tools - How They Make Winning Easier
Bet Like a Pro in 2025 with Sports AI Prediction Tools
Sources
The Game Changer: How AI Is Transforming The World Of Sports Gambling
AI and the Bookie: How Artificial Intelligence is Helping Transform Sports Betting
How to Use AI for Sports Betting
Keywords:
MLB AI predictions atswins
ai mlb predictions atswins
NBA AI predictions atswins
basketball ai prediction atswins
NFL ai prediction atswins