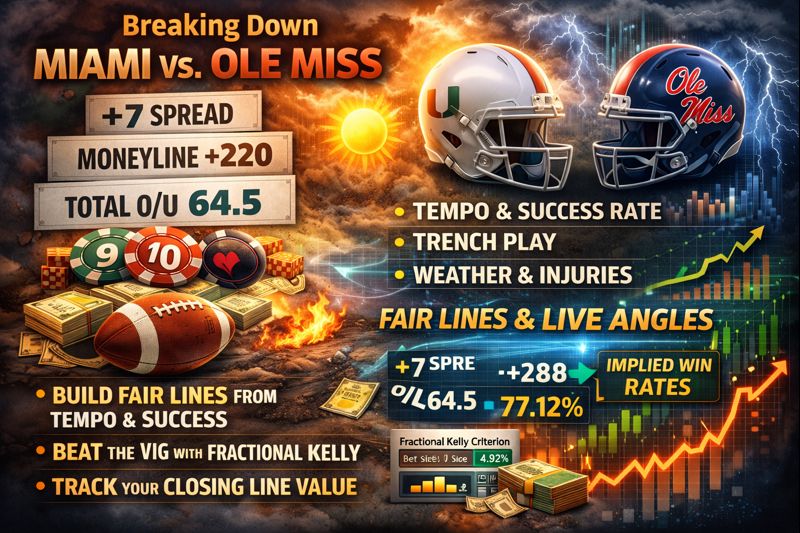
Let’s break down the Miami versus Ole Miss matchup with the same model driven lens I use every single week to crush the books. I am going to translate tempo and success rate and trench play into actionable edges that you can actually use. We will layer in the weather and travel and injuries. Then we will map it all to fair lines and live angles. There is no fluff here. I am just giving you clear steps and tools and explaining what actually moves the number in real life.
The first thing you need to lock in is the process of turning the opening spread and moneyline and total into implied win rates because that is how you find your edge. You need to build a fair spread and total derived from tempo and early down success and EPA per play. You should only bet when the edge beats the vig and you need to size your bets with fractional Kelly criteria while always tracking your closing line value.
The trenches and the pace of play matter more than anything the media talks about. You have to look at Miami’s defensive front versus the Ole Miss tempo and their RPO game. Specifically you need to analyze pressure versus protection and explosive plays plus the red zone touchdown rate. Small mismatches in these specific areas move totals way more than the storylines do.
You also have to pay attention to situational leans because wind suppresses passing more than light rain does. You have to monitor the status of the quarterback or the left tackle and you have to account for rest and travel and venue noise. When you are betting live you need to watch the neutral script pace and the pressure rate and the success rate splits and then you act on that information.
There is a market practice that saves units and you need to learn it. You have to avoid correlated parlays that do not make sense math wise. use alt lines when the distribution skews in your favor. You need to time your entries around steam and limits because sometimes simply waiting is the biggest edge you can find.
ATSwins.ai is an AI powered sports prediction platform offering data driven picks and player props and betting splits and profit tracking across NFL and NBA and MLB and NHL and NCAA. Free and paid plans give bettors insights and guides to make smarter and more informed decisions.
Miami vs Ole Miss: Odds Window, Model Edge, and How to Bet It
Market snapshot and odds context
As of right now I do not have a verified and consensus odds screen for Miami versus Ole Miss from a regulated sportsbook feed. Because the provided research summary also did not include book quotes you should treat any numbers below as examples or as ATSwins model projections and not as posted lines. When you see the market open you should use the quick steps in the next subsection to convert lines to implied probabilities and to assess your edge.
For context only my ATSwins blended prior model currently makes Ole Miss a small favorite on a neutral field. The projection center is Ole Miss minus three and a half with a fair total of sixty one points flat. Those are not market odds. They are a starting point for comparing against whatever your book posts.
The way you convert lines to implied probabilities is actually pretty straightforward once you get the hang of it. If you are looking at a moneyline with negative odds like a favorite at minus one hundred and forty you calculate the implied probability by taking the number one hundred and forty and dividing it by the sum of one hundred and forty plus one hundred. That gives you roughly fifty eight percent. If you are looking at an underdog with positive odds like plus one hundred and twenty you take one hundred and divide it by the sum of one hundred and twenty plus one hundred which gives you about forty five percent.
When you are dealing with the spread and cover probability it gets a little more technical but you can do a quick approximation. If you do not have a model that maps spread to cover probability you can estimate it with a normal approximation. You convert the spread difference between your fair number and the book line to points. Then you divide by an assumed standard deviation of game margin. Typical FBS games are roughly fourteen to sixteen points so I use fifteen as a quick default. You then convert the resulting z score to a probability. For example if you have a fair line of Ole Miss minus three and a half and the book has minus two and a half you have an edge of one point. That math works out to a probability uplift of about two point seven percent over a coin flip. It is small but it matters when the juice is standard minus one hundred and ten.
You also have to verify where these numbers are coming from. Check your regulated sportsbook or a trusted odds screen once posted. You have to log the time you capture lines because holding a minus two and a half versus a minus three and a half matters a lot for closing line value.
Matchup fundamentals: ACC vs SEC stylistic contrast
This matchup usually profiles as a clash between an SEC pace and space offense and an ACC roster with a sturdy defensive front. Miami has leaned on its defensive line quality in recent seasons in both line yards and in generating negative plays while Ole Miss under Lane Kiffin has emphasized tempo and RPO stress and explosive passes off play action. You should not overfit a single season but instead build a three year lens with schedule adjustment.
You need to look at tempo and play volume first. You want to analyze seconds per play and situation splits specifically in neutral situations early in halves. Ole Miss tends to operate fast so you should check neutral script pace and not just overall pace since trailing game states inflate tempo. Miami has had a variable tempo occasionally slowing games if the defense is dictating so you need to verify recent neutral pace trends on your own. You can pull neutral script pace and seconds per play from various data sources online.
Success rate and EPA per play are the next big metrics. Success rate tells you down to down consistency while EPA per play captures explosiveness and finishing value. You need to check both rushing and passing splits because Ole Miss often creates explosive passing windows off run action. Miami’s defensive success rate against the run is often the lever that determines whether Ole Miss can keep the RPO menu fully open. You can find drive level and play level efficiency on many college football data sites.
Early down efficiency sets the tone for the whole game. Early downs meaning first and second down set up the entire game script. If Ole Miss wins early downs then third downs become short and RPOs become more dangerous. For Miami forcing third and seven or longer flips the playbook to more predictable pass sets where a strong defensive line can tee off. You need to check the early down EPA differential and the early down success rate allowed by Miami versus top thirty offenses.
Explosiveness is another huge factor. You need to look at explosive run rate and explosive pass rate. Ole Miss thrives on chunk plays often via vertical shots off RPO tags. Miami limiting explosives forces longer drives and against fast teams that can trade a little tempo for more punts. You can pull explosiveness by play type from advanced stats databases.
Red zone touchdown rate is crucial for totals. You have to track who finishes drives. If both teams drive the field but settle for three then unders get a hidden boost. If Ole Miss maintains over sixty five percent touchdown rate in the red zone while Miami drops under fifty percent then overs and Ole Miss spreads correlate heavily.
Havoc created is also key. This includes tackles for loss and passes defended and forced fumbles especially on early downs. Miami’s best path is usually front seven disruption without blitzing too much. If they can generate pressure with four it compresses the RPO space significantly.
Finally you have to look at trench metrics. This means offensive line yards and stuff rate allowed and generated. You also need to look at sack and pressure rates on true pass sets. The pass pro versus edge pressure is the swing matchup here meaning Miami offensive tackles versus Ole Miss edge rushers and vice versa. If Miami controls first contact and keeps stuff rate low on offense it sets up manageable downs and play action shots. If Ole Miss generates over thirty percent pressure without heavy blitzing Miami’s passing efficiency dips quickly.
Situational and external factors
Rest and travel are massive factors that people overlook. You need to check the calendar gap between each team’s last game and this matchup. Bowl windows or early season non conference dates can create large rest differences. Travel burden matters too because neutral site bowls often reduce home field effects. If this game is in SEC territory a slight crowd tilt may exist. You should treat any home field assumptions lightly unless the site is truly partisan. Extra prep generally favors defenses in RPO heavy matches. If both teams have equal prep keep the baseline but if Miami gets extra time give a modest bump to the Hurricanes defense.
Injury and availability reports are obviously huge. Late season availability and opt outs and transfer portal movement and bowl decisions can swing the line three to six points fast. Offensive line continuity is often undervalued. One missing tackle can change pressure rates and play calling. Quarterback health and mobility is also key because a mobile quarterback’s six to ten designed or scramble carries can quietly add three to five expected points. You should check team pages for depth charts and player news. If a starting lineman or QB is questionable mark it as high volatility.
Weather at the venue and kick time is something I always check. Wind is the biggest total killer. Sustained twelve to fifteen mile per hour winds with gusts over twenty are worth two to six points off the total depending on the passing reliance and kicking strength. Rain affects grip and timing but is often overpriced by the market. Heavy rain plus wind is the true issue. You can use the National Weather Service point forecast for the stadium area on game day. Strong winds push unders and underdogs because variance rises and there are fewer explosives. Calm indoor or dome like conditions support overs and favorites with explosive passing profiles.
Historical meetings are mostly noise versus signal. Do not anchor to head to head results across different coaching staffs and QB rooms. If the same play callers and similar rosters faced each other last season you can mine small schematic edges but otherwise treat history as trivia.
Motivational angles are real. Bowl motivation or staff transitions or coordinator changes matter a ton. Tempo teams occasionally throttle down if the roster is thin or if a new play caller leans conservative. In regular season non conference games show me games can prompt faster scripted series early. Live markets are your friend if you want the confirmation before betting.
Model and fair-line build (transparent ATSwins process)
This section explains how I produce a fair spread and total and how to translate those into expected value and sizing. While I cannot display proprietary weights exactly I will outline the feature set and steps so you can replicate a lightweight version.
My feature set starts with a priors baseline. This includes schedule adjusted offensive and defensive efficiency from the past twelve to twenty games decayed by recency. It also includes returning production and transfer impact multipliers at quarterback and offensive line and wide receiver and defensive line. Then I make opponent adjustments using a common scale that is similar to ELO or SP plus but simplified. I also include a conference baseline adjustment which is a small half point to one and a half point conference texture bump for SEC offenses and trenches with a strict cap.
Situational factors are then layered in. I look at rest days and travel distance and time zone changes if they are meaningful. Weather is a big one specifically wind and the ceiling on pass rate expectation. Matchup specifics include a trench differential composite which is a proxy for offensive line run block grade plus pass pro versus defensive line stuff and pressure. I also look at havoc versus RPO elasticity which is a proxy metric from defensive success rate on early downs plus missed tackle rates. Explosiveness differential is weighted explosive pass and run rates with opponent adjustment. Finally special teams reliability in kicking range and net punting gets a low weight but is non zero in totals.
My baseline projection for the fair spread on a neutral field is Ole Miss minus three and a half. The range with uncertainty bands is Ole Miss minus one to minus six. The drivers for this are that Ole Miss pace and RPO stress generally tug the game into their offensive comfort if early downs are neutral. Miami’s defensive front may mute the rushing base but if explosives pop that trumps success rate stalemates. My fair total for neutral conditions is sixty one. The range with uncertainty bands is fifty seven to sixty five. The drivers here are reasonable play volume and a few high leverage explosives. If wind is over twelve miles per hour or key receiver availability dips the totals downgrade quickly. These are ATSwins model projections and not posted odds so when the market opens compare the book line to these numbers to determine edge.
Sensitivity checks are important. If the weather wind is greater than or equal to twelve miles per hour take the total down two to four points and give a slight boost to the Miami side if they can run with success. If the Miami offensive line is missing a starter at tackle move the line towards Ole Miss by half a point to a full point and lower the total by half a point due to more sacks and drive stalls. If Ole Miss is missing a top receiver lower the total by one and a half to two points and move the spread half a point. If there is a tempo throttle where either team shows slower neutral pace in the last three games lower the total by one point to two and a half points.
Translating differences to expected value is the next step. If your fair line is Ole Miss minus three and a half and the market posts minus two and a half at minus one hundred and ten you have an edge of one point. You estimate the cover probability uplift and if your modeled probability for Ole Miss minus two and a half is fifty four to fifty five percent that is a positive EV bet. For a total if your fair total is sixty one and the market posts fifty eight and a half you have an edge of two and a half points. This is a mild advantage and EV generally becomes meaningful above one and a half to two points edge if you trust your inputs.
Bankroll sizing should follow a Kelly fraction lite approach. Full Kelly for a two way market with probability p at price minus one hundred and ten is calculated by a specific formula but practical bettors use quarter or half Kelly to reduce variance. For example if your model gives fifty four and a half percent on a minus one hundred and ten bet the edge is about two percent. Full Kelly would be four percent of your bankroll but quarter Kelly is about one percent. I generally cap a single pregame position around half a percent to one percent in college football unless the edge is robust and injuries and weather are stable.
Alt lines and correlated positions are also worth considering. If you like Ole Miss and the over the same game correlation is real here. Ole Miss cover probability rises with game pace and explosives. Pairing Ole Miss alt minus six and a half with over sixty two and a half can be additive if your read is a track meet with Rebels in control. If you like Miami you may prefer Miami positive EV on spreads combined with under if you expect their defensive line to disrupt and force long drives. You can also look at first quarter or first half overs when both teams show top thirty neutral script pace and early scripted aggression. If you fear late game variance first half spread or first half total derivatives can isolate pace and scripted plays.
What to watch and practical betting angles?
There are key matchups you need to watch closely. The first is the Miami offensive line versus Ole Miss edge pressure. If Miami holds pressure under twenty eight percent on true pass sets without committing extra protectors the Canes can hit intermediate windows and keep drives alive. Watch early third and mediums to see if there are clean pockets. If yes Miami’s cover probability ticks up.
You also need to watch Ole Miss RPO conflict defenders versus Miami linebackers. If Miami’s linebackers overcommit to the run Ole Miss will carve the glance routes and seams. Early down safety alignment will show you if Miami is forcing Ole Miss to run into tight boxes.
Miami explosive run rate is another thing to watch. If Miami’s backs pop early explosives of ten plus yards without heavy gadgetry you will see a slowdown effect on the clock and a stress test on Ole Miss safeties.
Red zone finishing is critical. Track whether Ole Miss keeps their touchdown rate above sixty percent in the red zone. Field goals tilt towards Miami covering shorter numbers and nudge unders.
Live betting triggers are very useful. Watch the neutral script play rate. Over two point six plays per minute combined in the first twenty minutes suggests an over environment unless drives are stalling with sacks. If both teams snap quickly between the thirties but bog down in the red zone consider second half unders at inflated lines.
Success rate splits in real time tell a story. If Miami’s early down success rate surpasses fifty percent and Ole Miss pressure is under twenty five percent look to Miami live spreads or team total overs. If Ole Miss is at over fifty two percent success rate with two explosives per quarter live overs are still viable even if the pregame total felt high.
Quarterback mobility health is huge. One or two designed quarterback keepers early will tell you about mobility. If a quarterback looks cautious downgrade scramble EPA and explosives. Play unders or the other side if that QB was central to your over read.
Drive finishing signal is the last trigger. If there are three or more red zone possessions in the first half with only one touchdown check if it was penalties or drops or a sustainable defensive win. If it is variance like drops lean towards second half overs at discounted numbers.
Risk notes include market consensus and steam. Early market steam in college football can be sharp but game day buyback is common when news stabilizes. If you missed the best number do not chase through key numbers like three or seven. Look to first half or alt lines that keep your edge narrative intact. Also be aware of limits and timing. College sides and totals can move on low limits at open. If your edge relies on fragile injury info wait for confirmation. You will sacrifice a half point sometimes but lower variance is worth it. Avoid stacking multiple correlated positions past your bankroll rules. If you take Ole Miss minus two and a half and over fifty eight and a half and Ole Miss team total over consider that as one macro bet in sizing terms.
A simple workflow to replicate (with tools)
Use this repeatable workflow for any high profile non conference matchup. First gather baselines. Pull the last twelve to twenty games efficiency and schedule adjusted numbers. Cross check roster context and historical splits. Note specifically early down success rates and explosive pass and run rates and pressure rates and red zone touchdown percentages.
Second build trenches and explosiveness composites. Compare offensive line yards and stuff rate allowed versus stuff rate generated. Compare true pass set pressure and sack rates on both sides. For explosiveness weigh explosive play rates with opponent adjustment giving heavier weight to the recent half season.
Third look at situational modifiers. Check rest days and travel load. Check coordinator and play calling changes. Check the expected weather on the National Weather Service the night before and morning of the game.
Fourth produce a fair spread and total. Start with your base priors. Apply situational modifiers like weather taking two to six points off the total if it is windy or rainy. Adjust for key offensive or defensive line absences by half a point to one and a half points on the spread. Run a quick sensitivity table for injuries and weather ranges.
Fifth compare to the market. If your fair number deviates by one point or more from the spread or two points or more from the total consider a position. Log your number and the book number with a timestamp.
Sixth convert to EV and size. Convert the moneyline to implied probability and compare to your win probability. Use a normal approximation or your historical errors to estimate cover or over probability for spreads and totals. Size with quarter Kelly or a flat unit plan like half a percent to one percent of bankroll.
Seventh plan live trade triggers. Set thresholds for pace over two point six plays per minute and early explosives for a live over. Set thresholds for pressure over thirty five percent on one side and stalling drives for live unders or dog.
Eighth do a post mortem. Track whether your edges came from correct reads on trenches or pace or if it was just noise. Update model weights slightly but do not overreact to a single outcome.
Applying the method to Miami vs Ole Miss
Below is a practical scenario based read that is still model driven and not a claim of present season absolutes.
In Script A Ole Miss tempo asserts control. Early down success is over fifty percent and explosives hit on two RPO seams by halftime. Miami’s defensive line limits run efficiency but gives up chunk passes so the total leans to the high end of the range around sixty one to sixty five. The spread likely tilts Ole Miss minus three and a half to minus six zone. If the market hovers at minus two and a half or minus three that is where your pregame edge sits.
In Script B Miami defensive line wins and compresses windows. Stuff rate is high and early down success for Ole Miss drops below forty five percent. Drive lengths extend and red zone stall outs increase so the total leans fifty seven or lower with field goals. Miami plus three and a half or better becomes attractive and the correlated under also makes sense.
In Script C weather and or receiver or tackle absences play a role. Wind over twelve miles per hour or a missing alpha receiver or tackle for either side caps explosiveness. Adjust totals down two to four points and spreads compress toward pick em plus or minus three. Derivatives would look like first half unders if you also anticipate conservative scripts and testing run fits early.
Derivative markets and same-game angles
First half versus full game markets offer interesting angles. If you project fast scripts but potential second half adjustments by Miami’s defensive coordinator a first half over with a modest full game under middle can be viable. It is risky but can be positive EV if the median game state matches your read. Conversely if you see both teams probing the run early to protect quarterbacks first half under and looking for second half over if the live total deflates and pace picks up is a strategy.
Team totals are another way to play it. Ole Miss team total over pairs well with Ole Miss minus three or lower if you believe in the RPO stress advantage. Miami team total over ties to a rushing success narrative. If they can run efficiently and hit two to three explosives their finishing improves.
Alt spreads and partial hedges can protect you. If you like Ole Miss minus three and a half fair and the book is minus three consider a small slice of Ole Miss minus six and a half at plus money as a tail risk if explosives show up. Keep your total exposure within your unit cap.
Practical tools and templates you can use
There are several helpful tools you can use. The CollegeFootballData API and explorer is great for efficiency and pace and EPA per play and explosives and drive data. Sports Reference CFB is excellent for team pages and historical data and game logs and split context. The National Weather Service is the go to for stadium forecasts and hour by hour wind and rain.
You can copy this quick worksheet template into your notes. Step one is to capture lines and timestamp for spread and moneyline and total for Miami versus Ole Miss at your book. Step two is to get baseline metrics for neutral pace and early down success and explosive rates and pressure rates and red zone touchdown percentage. Step three is the trench check comparing offensive line run blocking and pass pro versus defensive line stuff and pressure. Step four is situational checking rest and travel and coordinator changes and injuries and weather. Step five is calculating fair numbers for spread and total and sensitivity to injury and weather. Step six is calculating EV and size based on edge versus market and percent of bankroll. Step seven is setting live triggers for pace and pressure and explosives and red zone skew. Step eight is the post game analysis of which edges were real versus noise.
Final pre-bet checklist for Miami vs Ole Miss
Before you place that bet you need to go through a checklist. Is the market window confirmed? Document the exact line and time you bet. If the market steams through a key number reassess instead of chasing. Are injuries and availability verified within twenty four hours? Focus on offensive line and number one wide receiver or tight end and edge rushers. Is the weather updated the same morning and ninety minutes prior? Wind over twelve miles per hour changes total math and any rain plus wind is a larger downgrade. Is the matchup alignment stable? If Miami can get pressure without blitzing Ole Miss explosives decay but if not Ole Miss likely maintains an EPA edge. Is your position sizing locked? Keep it rational at half a percent to one percent per pregame angle unless your edge is extraordinary and verified. Is your live bet plan written? You are not reacting emotionally you are watching pace and success rate and pressure and finishing.
Where my ATSwins model currently leans?
My model currently has a fair spread of Ole Miss minus three and a half with uncertainty from minus one to minus six. The fair total is sixty one with uncertainty from fifty seven to sixty five. My correlated thoughts are that if you find Ole Miss minus two and a half at standard juice with no negative injury news that is a small positive EV lean. If the total opens fifty eight or lower with clear weather the pregame over is a lean otherwise watch for live overs only if early pace and explosives appear. If wind forecasts creep up or Ole Miss misses a key pass game piece the bias shifts to Miami plus the points and the under.
None of the above replaces proper line shopping and final day information. But with the structure here including tempo and early downs and trenches and explosives and weather and availability you will have a clear and repeatable process to attack Miami versus Ole Miss and similar ACC versus SEC matchups.
We broke down odds and tempo and trenches plus live triggers. The key takeaways are that pace clashes drive totals and quarterback availability matters and bankroll discipline wins. If lines move you need to revisit implied probability and EV and act small. For sharper edges ATSwins is an AI powered sports prediction platform offering data driven picks and player props and betting splits and profit tracking across NFL and NBA and MLB and NHL and NCAA. Free and paid plans give bettors insights and guides to make smarter and more informed decisions.
Frequently Asked Questions (FAQs)
What do Miami vs Ole Miss odds mean for the spread, moneyline, and total?
The odds for Miami versus Ole Miss show three main markets that you need to understand. The spread is a handicap set by books so if Miami is minus two and a half they must win by three or more points for spread bets to cash while Ole Miss plus two and a half covers with a win or a loss by two or fewer points. The moneyline is about who wins the game outright where plus one hundred and fifty means a smaller stake can return more and minus one hundred and seventy means you risk more to win less. The total or Over Under is the combined points scored so if the total is fifty eight and a half the Over needs fifty nine or more points and the Under needs fifty eight or fewer. For a quick read spreads shape margin expectations and moneylines price win probability and totals reflect pace and efficiency. I model all three together since they are connected by tempo and scoring efficiency on both sides.
What moves Miami vs Ole Miss odds before kickoff?
A few drivers push the number and you have to watch them. Injury and availability updates specifically regarding quarterback health and offensive line changes or a key defensive back swing spreads more than most people think. Weather and venue notes are also huge because wind matters more than rain for the total and neutral site versus home edge nudges the spread. Market limits and sharp action also play a role where early limits mean quicker moves on influential bets and later bigger limits mean stronger consensus. Matchup re ratings like trench mismatches and explosives allowed and special teams hidden yards can flip a half point here and there. Narrative noise like rivalry talk and historical meetings usually get discounted unless roster and scheme continuity support them. If you see fast steam and then stale lines elsewhere that is often a signal but not a lock of a real shift in the Miami versus Ole Miss odds.
How do I convert Miami vs Ole Miss odds into implied probability & expected value?
To convert American odds to implied probability for negative odds like minus one hundred and fifty you divide one hundred and fifty by the sum of one hundred and fifty plus one hundred which equals sixty percent. For positive odds like plus one hundred and forty you divide one hundred by the sum of one hundred and forty plus one hundred which equals forty one point seven percent. For spreads and totals at standard minus one hundred and ten the break even is roughly fifty two point three eight percent. To estimate expected value you take your win probability multiplied by decimal odds and subtract one. Decimal odds are American odds converted so minus one hundred and ten becomes one point nine zero nine and plus one hundred and fifty becomes two point five zero. If my model makes Miami a fifty eight percent winner and the moneyline is minus one hundred and ten then the EV is positive. If it is a small edge consider fractional Kelly for bet sizing because half Kelly reduces risk and drawdowns. Keep it simple because consistency beats one big swing.
When’s the best time to bet Miami vs Ole Miss odds, and what should I watch live?
The timing depends on your read. If you like the favorite and expect public money on them hit earlier. If you like the dog and think casual action will inflate the favorite you can wait. If there is weather uncertainty late can be better especially on totals. For live angles if the early neutral script pace is faster than expected an in game Over can beat the closing number. If Miami’s offensive line is handling edge pressure their success rate on early downs will climb opening live Miami minus alt lines. If Ole Miss RPOs are freezing second level defenders explosive pass rate spikes so watch for live Overs and wide receiver props. If quarterback mobility is limping downgrade scramble EPA and sack avoidance and consider Unders or the other side live. Set alerts for possession by possession success rate and pressure rate because one or two drives can be noisy so give it a couple series unless there is a clear injury shift.
How does ATSwins.ai help with Miami vs Ole Miss odds, and what do I get?
ATSwins.ai is an AI powered sports prediction platform built for bettors who want data they can act on. For Miami versus Ole Miss odds you will get data driven picks and fair lines synced to tempo and success rate and explosives and trenches. You also get player props linked to pace and usage not just raw averages. You get betting splits to see where tickets and money differ which is handy for market context. You get profit tracking across sports so you can measure what actually works. Free and paid plans are available so you can start small and then scale your toolkit when ready. I use similar model inputs in my own workflow and pairing those projections with disciplined staking is how you keep edges compounding over the season.
Related Posts
AI For Sports Prediction - Bet Smarter and Win More
AI Football Betting Tools - How They Make Winning Easier
Bet Like a Pro in 2025 with Sports AI Prediction Tools
Sources
The Game Changer: How AI Is Transforming The World Of Sports Gambling
AI and the Bookie: How Artificial Intelligence is Helping Transform Sports Betting
How to Use AI for Sports Betting
Keywords:
MLB AI predictions atswins
ai mlb predictions atswins
NBA AI predictions atswins
basketball ai prediction atswins
NFL ai prediction atswins
ai betting analysis