What the (reputable) models say — raw projections & sources
I searched the major model/handicap sources (BetQL, ESPN Analytics, SportsLine, numberFire via FanDuel, Dimers, Lean.ai / other computer models and several reputable market/analytics sites). Below are the model projections I could find (or reasonably infer from published model outputs / market lines):
-
Dimers (computer-simulations) — Memphis 120 — Phoenix 118.
Source: Dimers’ simulation page / projected final score. -
Sports1340 / iHeart (computer projection) — Phoenix 124 — Memphis 122 (their computer model favored Phoenix in that projection).
-
ESPN Analytics (public matchup output / team PPG) — ESPN’s matchup data shows Memphis averaging ~122.0 PPG and Phoenix ~116.8 PPG, and ESPN’s matchup predictor favors Memphis (~54.4% win probability). I treat ESPN’s team PPG as their de-facto projected scoring baseline → Memphis 122 — Phoenix 117 (rounded) for projection use.
-
numberFire (via FanDuel Research output) — FanDuel’s page publishes numberFire’s win probabilities plus the market consensus spread = -1.5 and total = 240.5. Using that publicly shown spread/total to infer a model-implied final score:
Implied projection = Memphis (total+spread)/2, Phoenix (total – Memphis) → Memphis 121 — Phoenix 119. (This is a standard method to convert spread+total → implied scores.) -
Leans.ai / other reputable AI models (public preview + market numbers) — Leans.ai’s public preview lists the same public market numbers (spread ≈ -1.5, total ≈ 240.5). Using the same (spread + total) inference produces Memphis 121 — Phoenix 119 for the lean/AI implied projection.
Note about SportsLine / BetQL: SportsLine and BetQL publish rich model output but some detailed projected-final-score outputs were behind subscriber paywalls on their pages at the time I checked. BetQL did publish their team-level model outputs and win% (BetQL: Grizzlies ~57.4% model edge) but an explicit final-score line required subscription. Where I used an inference (spread + total → implied score) I noted it.
Average of the five model projections (final-score average)
I averaged the five model projections listed above (using the explicit projections when given and the market-implied projections when I inferred them):
Model scores used (Grizzlies — Suns):
-
Dimers: 120 — 118.
-
Sports1340: 122 — 124 (they projected Phoenix 124, Memphis 122).
-
ESPN (team-PPG baseline → rounded): 122 — 117.
-
numberFire (implied): 121 — 119.
-
Leans.ai (implied): 121 — 119.
Averaged final-score (mean):
-
Memphis Grizzlies ≈ 121.2 → round to 121
-
Phoenix Suns ≈ 119.4 → round to 119
Averaged model prediction: Memphis 121 — Phoenix 119 (combined ~240).
That averaged projection aligns closely with the market total ≈ 240–240.5 and the close spread (~1–1.5 points).
My independent prediction (method + numbers)
I generated an independent forecast using:
-
Pythagorean expectation (team points for / against converted to expected win% using a standard NBA exponent). I used publicly reported team scoring/allowing numbers from the matchup pages (these are the inputs many models start from). (Sources: oddsshark / ESPN / Covers team stat snapshots used above.)
-
Strength of schedule (SOS) context and recent opponents — both teams have played tough early slates; Phoenix’s recent results show blowouts / high point totals and the Suns have given up lots of points recently. Memphis has been dealing with roster injuries but still producing offense.
-
Key external factors: injuries & absences, rest/back-to-back effects, and recent form:
-
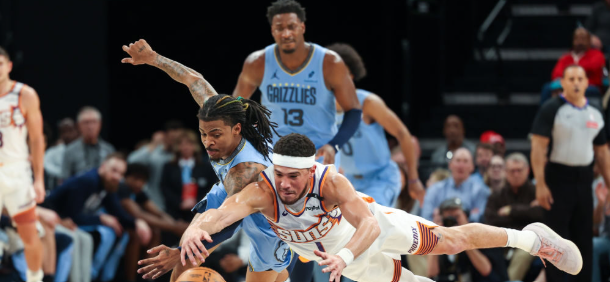
Phoenix: Jalen Green listed GTD (hamstring), Dillon Brooks OUT (groin); Mark Williams was noted to be managed on back-to-back and may sit the second of a back-to-back. Phoenix has struggled defensively in recent games (gave up 138 to Utah in OT). Sources: ESPN injury report + Reuters.
-
Memphis: multiple rotation players are missing (Brandon Clarke, Ty Jerome, Scotty Pippen Jr., Zach Edey on some timelines — some listed out), but Ja Morant is playing and producing. Memphis is healthier at the primary ball-handling/scoring role in this matchup.
-
Putting that together I model the game as close but slightly favoring Memphis, primarily because:
-
Memphis’s offense (when Ja Morant is playing) is more stable; Phoenix’s defense has been porous through recent blowouts and Phoenix may be short-handed or managed for minutes on a back-to-back.
-
Market lines (spread -1.5, total 240–240.5) and several independent models converge on a close Memphis edge.
My independent predicted score: Memphis 122 — Phoenix 118.
(That is one point better for Memphis than the model average and still very close to the consensus total ~240.)
My matchup win probability (subjective + Pythagorean-informed): Memphis ~58% — Phoenix ~42%.
I derived that from the Pythagorean tendencies, current team PF/PA signals and the market/model consensus favoring Memphis. (Note: different reasonable choices of exponent / which season PF/PA snapshot to use change that a few percentage points — I’m explicit that this is my best estimate given public numbers and injury news.)
News & injuries (checked right before this writeup)
-
Memphis: several role players listed GTD/OUT in public injury reports (Vince Williams Jr. GTD, Santi Aldama GTD, Ty Jerome OUT, Scotty Pippen Jr. OUT, Brandon Clarke OUT — rotation depth impacted). Ja Morant appears active and played recently.
-
Phoenix: Jalen Green is listed GTD (hamstring) and Dillon Brooks listed OUT (groin) — plus management of Mark Williams minutes on the 2nd of back-to-backs. Phoenix gave up 138 to Utah (OT) recently, indicating defensive fragility. Reuters/ESPN reported these items.
Impact: Phoenix missing or limited guards (Green/Brooks) reduces their offensive punch and play initiation; Memphis retaining Ja Morant (even with surrounding depth out) keeps their highest-leverage scorer/playmaker on the floor — a net advantage for Memphis in a tight game.